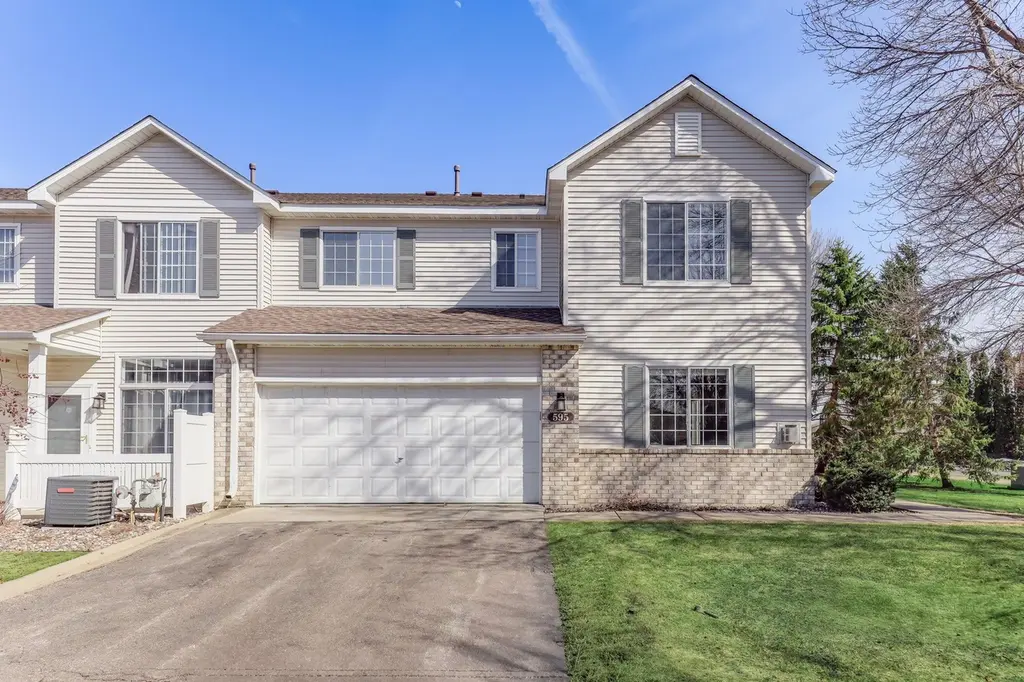
595 Tamarack Trl #1301 · Farmington, MN
Flood risk 1/10 · Minimal
- FEMA flood zone
- X (unshaded)
- Chance of flooding over 30 yrs
- 0.0%
- Est. flood insurance / yr
- $507 – $1,088
Fire risk 1/10 · Minimal
- Est. fire insurance / yr
- $888 – $1,650
Heat risk 2/10 · Minimal
- Hot days now (above 99°F)
- 7 days/yr
- Hot days in 30 yrs
- 14 days/yr
Wind risk 2/10 · Minimal
- Chance of severe wind over 30 yrs
- —
Air-quality risk 2/10 · Minimal
- Unhealthy air days now
- 1 days/yr
- Unhealthy air days in 30 yrs
- 2 days/yr
Risk factors via First Street. Map © Google.
Why this score? — see what drove the D+ grade
The composite is a weighted blend of 9 inputs, each scored 0–100. Each bar is that input's sub-score; the figure is the points it added to the 100-point composite (weight × sub-score).
- ARV discount +15.0/15.0
- Cash flow +12.4/30.0
- 1% rule +5.7/10.0
- Schools +4.4/10.0
- Livability +3.8/5.0
- DSCR +3.7/10.0
- Rent growth +2.5/5.0
- Condition / age +2.5/5.0
- Appreciation +0.0/10.0
$215,000
🖨 Deal sheet 📄 Offer letter ✓ Due diligence
Listing remarks
From the moment you walk in, the space feels open, bright, and easy to settle into—this two-story end-unit townhome is designed for low-maintenance living without compromise. The main level offers an open layout with a comfortable living room anchored by a fireplace, and a spacious kitchen featuring a breakfast bar for casual dining and a walk-in pantry that keeps everything organized and out of sight. A convenient half bath adds everyday practicality. Upstairs, both bedrooms are thoughtfully separated from the main living space, along with a versatile loft and dedicated laundry room. The primary bedroom stands out with a large walk-in closet complete with built-in shelving for effici
Key facts
- $410 HOA
- 2 garage spots
- Built 2001
Neighborhood map
What this means for you Summary
Snapshot
- This is a 2-bed/2.0-bath townhouse listed at $215k.
Deal economics
- At list price, monthly cash flow is $-35 ($-422/yr) — negative.
- To cash-flow at today's rent, offer at most $209k (2.9% below list).
- Meets the 1% rule at list price ($2k rent vs $215k).
- Recommended offer: $209k (3.0% below list) — sets the bar for market timing.
- Cap rate 6.1% vs local median 3.8% in Farmington — top-decile yield for the area; either an underpriced asset or a hidden risk that comps aren't pricing in. Stress-test before assuming the spread holds.
Location & tenants
- Location reads 75/100 on livability (#203 in MN, #4,269 nationally) — a middle-class / working-renter tenant base. Strengths: crime A+, employment A+, housing A+; Watch: amenities F, commute F.
- Farmington Public School District (suburban): math 43% / reading 52% proficiency, ranked #104 of 301 in MN (top 35%) — families likely to look elsewhere, expect single-tenant / working-renter base with shorter leases; only 12% free/reduced lunch — higher-income household profile.
- Market conditions: 325 active listings in the ZIP; 2 comparable units currently listed for rent nearby; high-income renter base; 2,134 units permitted in Dakota County in 2024 (898 in 5+ unit buildings).
Forward outlook
- Local home prices are declining (-3.0%/yr); year-one equity from $1k of loan paydown is wiped out by about $6k of value loss. Plan a longer hold.
- Dakota County population projected at +11% by 2050 — modest demand growth; plan on rents tracking national, not racing it.
Negotiation context
- It's been on market 53 days — a 3% lower offer ($209k) is reasonable based on typical stale-listing flexibility.
- 4 sale attempts since 7y ago; this cycle's ask has dropped $45k (17%) from the opening price — seller is motivated, your offer sets the floor, not the list.
Questions for the listing agent
- What do current leases actually rent for vs. the listed asking? Can we see a recent rent roll and the last 12 months of T-12 income?
- It's been on market 53 days. Have you received any prior offers? Is the seller open to a 3% concession, seller financing, or rate buy-down credit?
- What does the HOA fee cover, when was the last increase, and are there any pending special assessments or reserve-fund shortfalls?
- Is there a deadline driving the sale (1031 exchange, divorce, estate, relocation)? That informs how much negotiation room exists.
- Schools are B-rated — typically a magnet for longer-tenancy family renters. What's the average tenant stay here, and is there a school-zone premium baked into asking?
- The area grade is low — what's the realistic commute time and amenity access for the typical tenant pool here? Any planned neighborhood developments (good or bad) we should know about?
- What's the average days-on-market for RENTAL listings here right now (not sales)? A rising rental-DOM trend means longer vacancies and softer asking-rent achievability than the comps imply.
- What's the recent tenant-quality profile in this submarket — average credit score on applications, eviction rate, late-payment / NSF rate, and stable-employment percentage? A property-management company in the area should have these aggregated.
- How much new for-sale + rental construction is in the pipeline within 1–3 miles? Heavy new supply typically softens prices + rents 12–24 months out; constrained supply supports both.
Investment metrics
- 1% rule
- 1.07% ✓
- Cap rate
- 6.10%
- Cash-on-cash
- -0.70%
- DSCR
- 0.97
- GRM
- 7.8
CMA / ARV
- ARV (on-the-fly)
- $265,485
- Comps found
- 1
Show comp detail 1 sale within ~0.75 mi
| Address | Dist | Beds/Ba | Sqft | Sold | Price | $/sf | Match |
|---|---|---|---|---|---|---|---|
| 1204 Prairie View Trl | 0.48mi | 3/2.0 (+1) | 1,404 (-13%) | 15mo | $231,800 | $165 | 38 |
Match score weights: distance 35% · size 25% · config 20% · recency 20%. Top-matched comps best support the ARV.
Projected returns pro-forma
-3.0% appreciation · 3.0% rent growth · sell at horizon
- IRR
- -17.3%
- Equity multiple
- 0.39×
- Total profit
- $-36,816
- Equity at exit
- $32,057
- IRR
- -9.0%
- Equity multiple
- 0.44×
- Total profit
- $-33,874
- Equity at exit
- $18,589
Cash invested: $60,200 (down + closing). Projections, not guarantees.
Landlord ↔ Tenant lean methodology
- Overall (STATE)
- 46 Balanced
- State Minnesota
- 46 Balanced · D+2
- County
- — inherits STATE
- City
- — inherits STATE
ZIP-level market 55024
- Home prices YoY
- -31.2%
- Active inventory
- 325
- Price-to-rent
- 7.8×
Monthly cashflow live
- Estimated rent
- $2,307 medium interval (Pro) →
- Mortgage (P&I)
- −$1,127
- Tax from tax record
- −$231 /mo · $2,770/yr
- Insurance
- −$90
- HOA
- −$410
- Vacancy / Maint / Mgmt
- −$485
- Net cashflow
- $-35
Break-even live
UW: 25.0% down · 7.5% · 30yr · 1.5% tax · 5.0% vac · 8.0% maint · 8.0% mgmt
Financing live
Cash to close
- Down payment
- $53,750
- Closing costs
- $6,450
- Reserves months
- —
- Total cash needed
- —
Loan-product check · same deal, 3 products live
Conventional
25% down · 7.5% · 30yr
- Down + closing
- —
- Monthly P&I
- —
- Monthly cashflow
- —
- DSCR
- —
- Eligible?
- —
Personal DTI + credit; lowest rate.
DSCR
20% down · 8.5% · 30yr
- Down + closing
- —
- Monthly P&I
- —
- Monthly cashflow
- —
- DSCR
- —
- Eligible?
- —
No personal income docs; deal must DSCR.
Hard money
10% down · 12.0% · 12mo
- Down + closing
- —
- Monthly P&I
- —
- Monthly cashflow
- —
- DSCR
- —
- Eligible?
- —
Short-term bridge; refi at stabilization.
Rent comps 2 comps
| Address | Beds | Baths | Sqft | Rent | $/sqft | DOM | Units | Dist |
|---|---|---|---|---|---|---|---|---|
| 505 13th St Farmington, MN | 3.0 | 2.0 | 1600 | $2,495 | $1.56 | 1d | 1 | 0.82mi |
| 310 3rd St Farmington, MN | 1.0–2.0 | 1.0–2.0 | 956 | $2,400 | $2.51 | 1d | 1 | 0.96mi |
HOA detail
- Monthly dues
- $410 · $4,920/yr
Listing history 26 events
-
2026-06-07statusdays on market $215,000 Pending 53 DOM
-
2026-05-14price $215,000
-
2026-05-07price $220,000
-
2026-04-30price $225,000
-
2026-04-24price $230,000
-
2026-04-17price $235,000
-
2026-04-15soldstatus $200,000
-
2026-04-09price $240,000
-
2026-04-02price $250,000
-
2026-03-27$260,000 Active
-
2026-03-26historical
-
2025-01-20historical
-
2025-01-06price $247,000
-
2024-11-16price $250,000
-
2024-10-29price $260,000
-
2024-10-18$265,000 Active
-
2024-10-10historical
-
2024-10-01price $250,000
-
2024-09-26price $260,000
-
2024-09-13$270,000 Active
-
2024-09-12historical
-
2019-09-16soldstatus $200,500
-
2019-08-30soldstatus $200,500 Sold
-
2019-07-30historical Contingent - Inspection
-
2019-07-22price $194,900
-
2019-06-27$199,900 Active
ⓘ Source: listings_history table (triggers on properties + properties_extension) + one-shot
backfill from property_details.listing_events for pre-trigger history.
Tax reassessment forecast MN · Partial reset (capped growth)
- Current annual tax
- $2,770 · $231/mo
- Projected year-2 tax
- $2,770 · $231/mo
- Expected delta
- $0/yr ($0/mo · 0.0%)
ⓘ Screening estimate from a state-policy table — verify with the county assessor before closing.
Climate risk First Street
- Flood 1/10 Low FEMA zone X (unshaded) · 0% chance over 30 yrs
- Wildfire 1/10 Low
- Heat 2/10 Low 7 d/yr ≥99°F today · 14 d/yr by 30 yrs out
- Wind 2/10 Low
- Air quality 2/10 Low 1 unhealthy d/yr today · 2 by 30 yrs out
Nearby sold comps map
Loading sold comps map…
Walkable amenities ~0.75 mi
Loading nearby amenities…
Taxation est. · year 1
- Rental income
- $27,687
- − Mortgage interest
- −$12,043
- − Property taxes
- −$2,770
- − Insurance
- −$1,075
- − Repairs & maintenance
- −$2,215
- − Management
- −$2,215
- − HOA
- −$4,920
- − Depreciation
- −$6,255
- Taxable loss
- −$3,806
- Est. tax savings @ 24.0%
- +$913
- After-tax cash flow
- $491/yr
For passive investors: Depreciation is non-cash, so a rental often shows a tax loss while cash-flowing — sheltering income. Rental losses are passive: they offset passive income freely, and up to $25,000/yr can offset ordinary (W-2) income if you actively participate and your MAGI is under $100k (phasing out to $0 by $150k); unused losses carry forward. On sale, claimed depreciation is recaptured at up to 25%, and gains may owe capital-gains tax (a 1031 exchange can defer both). Figures are a year-1 estimate at your 24.0% rate — not tax advice; consult a CPA.
Schools (NCES district)
- District
- Farmington Public School District
- NCES district ID
- 2711820
- Math proficiency
- 43% ▼ -12.00%
- Reading proficiency
- 52% ▼ -7.00%
- Median HH income
- $83,959
- Composite
- 43.93/100
- National rank
- #2905
- State rank
- #104 of 301 in MN
Livability — Farmington
- Score
- 75/100
- State rank
- #203
- US rank
- #4269
Category grades
Schools grade is shown separately in the Schools card above.
Census & demographics
- Census place
- Farmington, MN
- County
- Dakota County · 417,704 people
- City population
- 37,287
- Metro
- Minneapolis-St. Paul-Bloomington, MN-WI
- Population (ZIP)
- 37,287
- Household income
- $127,280
- Rent vs Own
- Severe rent burden
- 288.0
Population outlook (Dakota County) Hauer SSP2
- Today (2025)
- 450,671 people
- By 2030
- 465,068 · +3.2%
- By 2040
- 486,770 · +8.0%
- By 2050
- 498,743 · +10.7%
- By 2075
- 533,865 · +18.5%
- By 2100
- 550,133 · +22.1%
Race, ethnicity, and origin ACS 2023
- Neighborhood character
- Predominantly White (84%)
- Race & ethnicity
- White 84% Hispanic / Latino 6% Two or more races 4% Black 4% Asian 3%
- Hispanic origin (detail)
- Mexican 3%
- Common ancestry
- Portuguese 14% Scottish 3% Romanian 3%
- Foreign-born
- 5% · Canada, Vietnam
- Languages at home
- 93% English-only · Spanish 3% Other Asian/Pacific 1% Russian/Polish/Slavic 1%
Political lean MEDSL · Dakota
- 2024 margin
- D (+12.9) · D 55.4% · R 42.5% · Other 2.1%
- 2008→2024 swing
- +7.4pp toward D · 2008: 5.5pp · 2024: 12.9pp
- All cycles
- 2024: D+12.9 2020: D+13.9 2016: D+4.7 2012: D+2.9 2008: D+5.5
Not yet ingested
- Civics
- —
Market trends
- HPI YoY
- ▼ -102.47%
- Current HPI
- 225.6882
- Rent YoY
- —
- Metro
- Minneapolis-St. Paul-Bloomington, MN-WI
- State GDP YoY
- ▲ 2.41%
- F500 in state
- 34
Industry mix (Fortune 500 HQ in MN)
| Industry | F500 HQs | Revenue |
|---|---|---|
| Healthcare | 2 | $407B |
|
||
| Retail | 2 | $150B |
|
||
| Consumer Goods | 2 | $32B |
|
||
| Industrial Machinery | 2 | $6B |
|
||
| Agriculture | 1 | $40B |
|
||
| Healthcare / Medical Devices | 1 | $32B |
|
||
Price history
+7.6% since first listed25 events — show timeline
- 2026-05-14 Price Changed $215,000 NORTHSTARMLS as Distributed by MLS Grid
- 2026-05-07 Price Changed $220,000 NORTHSTARMLS as Distributed by MLS Grid
- 2026-04-30 Price Changed $225,000 NORTHSTARMLS as Distributed by MLS Grid
- 2026-04-24 Price Changed $230,000 NORTHSTARMLS as Distributed by MLS Grid
- 2026-04-17 Price Changed $235,000 NORTHSTARMLS as Distributed by MLS Grid
- 2026-04-15 Sold (Public Records) $200,000 Public Records
- 2026-04-09 Price Changed $240,000 NORTHSTARMLS as Distributed by MLS Grid
- 2026-04-02 Price Changed $250,000 NORTHSTARMLS as Distributed by MLS Grid
- 2026-03-27 Listed $260,000 NORTHSTARMLS as Distributed by MLS Grid
- 2026-03-26 Coming Soon — NORTHSTARMLS as Distributed by MLS Grid
- 2025-01-20 Listing Removed — NORTHSTARMLS as Distributed by MLS Grid
- 2025-01-06 Price Changed $247,000 NORTHSTARMLS as Distributed by MLS Grid
- 2024-11-16 Price Changed $250,000 NORTHSTARMLS as Distributed by MLS Grid
- 2024-10-29 Price Changed $260,000 NORTHSTARMLS as Distributed by MLS Grid
- 2024-10-18 Listed $265,000 NORTHSTARMLS as Distributed by MLS Grid
- 2024-10-10 Listing Removed — NORTHSTARMLS as Distributed by MLS Grid
- 2024-10-01 Price Changed $250,000 NORTHSTARMLS as Distributed by MLS Grid
- 2024-09-26 Price Changed $260,000 NORTHSTARMLS as Distributed by MLS Grid
- 2024-09-13 Listed $270,000 NORTHSTARMLS as Distributed by MLS Grid
- 2024-09-12 Coming Soon — NORTHSTARMLS as Distributed by MLS Grid
- 2019-09-16 Sold (Public Records) $200,500 Public Records
- 2019-08-30 Sold (MLS) $200,500 NORTHSTARMLS as Distributed by MLS Grid
- 2019-07-30 Contingent — NORTHSTARMLS as Distributed by MLS Grid
- 2019-07-22 Price Changed $194,900 NORTHSTARMLS as Distributed by MLS Grid
- 2019-06-27 Listed $199,900 NORTHSTARMLS as Distributed by MLS Grid
Property tax history
+3.2%/yrLatest (2025): $2,770 · +4.8% YoY. Source: county tax records.
Cash-flow waterfall
monthlySold comps — $/sqft
last 12 mo · ≤1 miLoading sold comps…