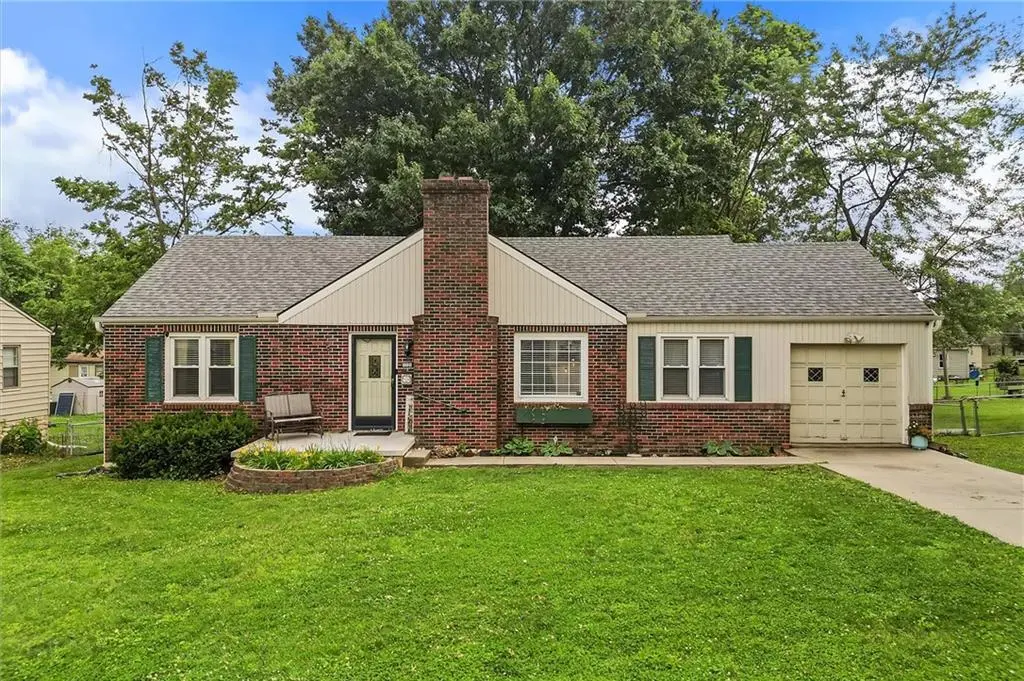
111 Northview Dr · Excelsior Springs, MO
Flood risk 1/10 · Minimal
- FEMA flood zone
- X (unshaded)
- Chance of flooding over 30 yrs
- 0.0%
- Est. flood insurance / yr
- $473 – $860
Fire risk 3/10 · Minor
- Est. fire insurance / yr
- $1,054 – $1,958
Heat risk 4/10 · Minor
- Hot days now (above 107°F)
- 7 days/yr
- Hot days in 30 yrs
- 16 days/yr
Wind risk 2/10 · Minimal
- Chance of severe wind over 30 yrs
- —
Air-quality risk 3/10 · Minor
- Unhealthy air days now
- 3 days/yr
- Unhealthy air days in 30 yrs
- 3 days/yr
Risk factors via First Street. Map © Google.
Why this score? — see what drove the D grade
The composite is a weighted blend of 9 inputs, each scored 0–100. Each bar is that input's sub-score; the figure is the points it added to the 100-point composite (weight × sub-score).
- Cash flow +14.9/30.0
- ARV discount +8.5/15.0
- DSCR +4.6/10.0
- 1% rule +3.6/10.0
- Livability +3.4/5.0
- Schools +2.9/10.0
- Rent growth +2.5/5.0
- Condition / age +2.5/5.0
- Appreciation +0.0/10.0
$179,000
🖨 Deal sheet (PDF) 📄 Offer letter ✓ Due diligence
Listing remarks MLS
Great location! Huge fenced yard, nice covered deck and big shade tree in the back. Arch doorways, great layout with formal dining and a breakfast room off the kitchen. Simple updates will turn this home into a beautiful charmer! Easy to fall in love with this home and all that it has to offer!
Key facts
- Covered deck
- Cottage-style home
- Major updates
Tags
Property features AI
Exterior
- Parking: Attached garage (1 car)
- Utilities: Public water; Public sewer
- Home design: Single family residence; Residential property; Ranch style; North-facing
- Construction: Brick/mortar construction; Composition roof
- Exterior features: Metal fencing; City lot; Paved road with public maintenance
Interior
- Kitchen: Breakfast area (kitchen-adjacent)
- Bedrooms: 3 bedrooms
- Bathrooms: 1 full bathroom
- Heating & cooling: Forced air heating; Electric cooling
- Interior features: Ranch floor plan; Breakfast area and formal dining area; Two fireplaces (living room and basement)
- Laundry & utility: Laundry in basement
Neighborhood map
What this means for you Summary
Snapshot
- This is a 3-bed/1.0-bath single-family listed at $179k.
Deal economics
- At list price, monthly cash flow is $54 ($649/yr) — positive.
- The deal already cash-flows at list — no discount required.
- To meet the 1% rule (rent ≥ 1% of price), the offer needs to be $153k (14.4% below list).
- Recommended offer: $153k (14.4% below list) — sets the bar for 1% rule.
- Cap rate 6.7% vs local median 4.6% in Excelsior Springs — top-decile yield for the area; either an underpriced asset or a hidden risk that comps aren't pricing in. Stress-test before assuming the spread holds.
Location & tenants
- Location reads 67/100 on livability (#228 in MO) — a middle-class / working-renter tenant base. Strengths: cost of living A+, housing A+; Watch: crime D+, amenities F, commute F.
- Excelsior Springs 40 (town): math 27% / reading 40% proficiency, ranked #225 of 324 in MO (top 69%) — families likely to look elsewhere, expect single-tenant / working-renter base with shorter leases.
- Zoned schools: Lewis Elementary (math 35% / reading 41%, grade F, #604 of 1,115 statewide, top 54%, 425 students, 62% FRL); Excelsior Springs Middle (math 21% / reading 33%, grade F, #306 of 391 statewide, top 80%, 576 students, 51% FRL); Excelsior Springs High (math 12% / reading 62%, grade F, #291 of 521 statewide, top 60%, 787 students, 37% FRL).
- Market conditions: 122 active listings in the ZIP; 5 comparable units currently listed for rent nearby; rentals leasing fast (median 3d on market — plan ~1-2 weeks tenant-placement turnaround); solid renter incomes; 341 units permitted in Clay County in 2024 (40 in 5+ unit buildings).
Forward outlook
- Local home prices are declining (-3.0%/yr); year-one equity from $1k of loan paydown is wiped out by about $5k of value loss. Plan a longer hold.
- Clay County population projected at +24% by 2050 — long-run rental-demand tailwind backs the buy-and-hold thesis.
Negotiation context
- Only 4 days on market — expect competitive offers; lowballing is unlikely to land.
- 2 sale attempts since 7y ago with the ask held roughly flat each time — persistent listings suggest the price (not the market) is what's stuck; bring a comps-based counter.
Risks & watch-outs
- Watch-outs: built in 1941 — expect roof / HVAC / electrical / plumbing capex.
Questions for the listing agent
- Built in 1941 — when were the roof, HVAC, electrical panel, plumbing, and water heater last replaced?
- Is there a deadline driving the sale (1031 exchange, divorce, estate, relocation)? That informs how much negotiation room exists.
- Schools are D-rated, which usually means shorter tenancies and higher turnover. Who's the typical renter profile here, and what's been the actual vacancy rate?
- Crime grade is D in this area — have there been break-ins, vandalism, or insurance claims at this property in the last 3 years? What carrier currently insures it and at what premium?
- The area grade is low — what's the realistic commute time and amenity access for the typical tenant pool here? Any planned neighborhood developments (good or bad) we should know about?
- What's the average days-on-market for RENTAL listings here right now (not sales)? A rising rental-DOM trend means longer vacancies and softer asking-rent achievability than the comps imply.
- What's the recent tenant-quality profile in this submarket — average credit score on applications, eviction rate, late-payment / NSF rate, and stable-employment percentage? A property-management company in the area should have these aggregated.
- How much new for-sale + rental construction is in the pipeline within 1–3 miles? Heavy new supply typically softens prices + rents 12–24 months out; constrained supply supports both.
Investment metrics
- 1% rule
- 0.86% ✗
- Cap rate
- 6.66%
- Cash-on-cash
- 1.29%
- DSCR
- 1.06
- GRM
- 9.7
CMA / ARV
- ARV (on-the-fly)
- $183,168
- Comps found
- 12
Show comp detail 12 sales within ~0.75 mi
| Address | Dist | Beds/Ba | Sqft | Sold | Price | $/sf | Match |
|---|---|---|---|---|---|---|---|
| 1004 Hickory St | 0.18mi | 3/1.0 | 1,100 (-4%) | 1mo | $175,000 | $159 | 83 |
| 1 Vine St | 0.26mi | 3/1.0 | 1,108 (-4%) | 0mo | $155,000 | $140 | 81 |
| 411 Holtz St | 0.29mi | 3/1.0 | 1,092 (-5%) | 5mo | $149,900 | $137 | 74 |
| 936 St Paul Ave | 0.20mi | 3/2.0 | 1,233 (+7%) | 4mo | $175,000 | $142 | 72 |
| 232 Old Orchard St | 0.26mi | 2/1.0 (-1) | 1,238 (+8%) | 1mo | $219,900 | $178 | 70 |
| 899 Williams St | 0.24mi | 3/2.0 | 1,246 (+8%) | 3mo | $199,900 | $160 | 69 |
| 602 Saint Louis Ave | 0.49mi | 2/1.0 (-1) | 1,109 (-4%) | 4mo | $182,500 | $165 | 62 |
| 712 St Louis Ave | 0.57mi | 2/1.0 (-1) | 1,120 (-3%) | 2mo | $109,900 | $98 | 62 |
| 902 Ley Cir | 0.38mi | 3/1.5 | 1,300 (+13%) | 2mo | $215,000 | $165 | 57 |
| 124 Wildwood St | 0.30mi | 3/3.0 | 1,288 (+12%) | 3mo | $178,000 | $138 | 56 |
| 821 St Louis Ave | 0.70mi | 2/1.0 (-1) | 1,196 (+4%) | 6mo | $175,000 | $146 | 51 |
| 824 Rowell Ave | 0.73mi | 3/2.0 | 1,232 (+7%) | 3mo | $215,000 | $175 | 48 |
Match score weights: distance 35% · size 25% · config 20% · recency 20%. Top-matched comps best support the ARV.
Projected returns pro-forma
-3.0% appreciation · 3.0% rent growth · sell at horizon
- IRR
- -14.3%
- Equity multiple
- 0.49×
- Total profit
- $-25,589
- Equity at exit
- $26,689
- IRR
- -5.5%
- Equity multiple
- 0.64×
- Total profit
- $-17,957
- Equity at exit
- $15,477
Cash invested: $50,120 (down + closing). Projections, not guarantees.
Landlord ↔ Tenant lean methodology
- Overall (STATE)
- 81 Strongly Landlord-Friendly
- State Missouri
- 81 Strongly Landlord-Friendly · R+10
- County
- — inherits STATE
- City
- — inherits STATE
ZIP-level market 64024
- Home prices YoY
- -15.3%
- Active inventory
- 122
- Price-to-rent
- 9.7×
Monthly cashflow live
- Estimated rent
- $1,532 high interval (Pro) →
- Mortgage (P&I)
- −$939
- Tax from tax record
- −$143 /mo · $1,717/yr
- Insurance
- −$75
- HOA
- −$0
- Vacancy / Maint / Mgmt
- −$322
- Net cashflow
- $54
Break-even live
Sensitivity live
| Price | -10% $155 | -5% $105 | +0% $54 | +5% $3 | +10% $-47 |
|---|---|---|---|---|---|
| Rent | -10% $-67 | -5% $-6 | +0% $54 | +5% $115 | +10% $175 |
| Rate | -1.0pp $144 | -0.5pp $100 | base $54 | +0.5pp $8 | +1.0pp $-40 |
UW: 25.0% down · 7.5% · 30yr · 1.5% tax · 5.0% vac · 8.0% maint · 8.0% mgmt
Financing live
Cash to close
- Down payment
- $44,750
- Closing costs
- $5,370
- Reserves months
- —
- Total cash needed
- —
Loan-product check · same deal, 3 products live
Conventional
25% down · 7.5% · 30yr
- Down + closing
- —
- Monthly P&I
- —
- Monthly cashflow
- —
- DSCR
- —
- Eligible?
- —
Personal DTI + credit; lowest rate.
DSCR
20% down · 8.5% · 30yr
- Down + closing
- —
- Monthly P&I
- —
- Monthly cashflow
- —
- DSCR
- —
- Eligible?
- —
No personal income docs; deal must DSCR.
Hard money
10% down · 12.0% · 12mo
- Down + closing
- —
- Monthly P&I
- —
- Monthly cashflow
- —
- DSCR
- —
- Eligible?
- —
Short-term bridge; refi at stabilization.
Rent comps 5 comps
| Address | Beds | Baths | Sqft | Rent | $/sqft | DOM | Units | Dist |
|---|---|---|---|---|---|---|---|---|
| 410 N Titus Ave Excelsior Springs, MO | 3.0 | 2.0 | 910 | $1,476 | $1.62 | 45d | 1 | 0.14mi |
| 317 Woods St Excelsior Springs, MO | 2.0 | 1.0 | 884 | $1,350 | $1.53 | 3d | 1 | 0.19mi |
| 139 S Maple St Excelsior Springs, MO | 3.0 | 2.0 | 1490 | $1,650 | $1.11 | 3d | 1 | 0.23mi |
| 1406 Magnolia W Excelsior Springs, MO | 2.0 | 1.0 | 750 | $895 | $1.19 | 23d | 2 | 0.37mi |
| 701 Tiger Dr Excelsior Springs, MO | 2.0 | 1.5 | 800 | $1,250 | $1.56 | 3d | 1 | 0.68mi |
Listing history 5 events
-
2026-06-13statusdays on market $179,000 Pending 4 DOM
-
2026-06-09days on market $179,000 Active 3 DOM
-
2026-06-08days on market $179,000 Active 2 DOM
-
2026-06-07remarks 633-char remark
-
2026-06-07$179,000 Active 1 DOM
ⓘ Source: listings_history table (triggers on properties + properties_extension) + one-shot
backfill from property_details.listing_events for pre-trigger history.
Tax reassessment forecast MO · Resets to sale price
- Current annual tax
- $1,717 · $143/mo
- Projected year-2 tax
- $1,736 · $145/mo
- Expected delta
- +$20/yr (+$2/mo · 1.1%)
ⓘ Screening estimate from a state-policy table — verify with the county assessor before closing.
Climate risk First Street
- Flood 1/10 Low FEMA zone X (unshaded) · 0% chance over 30 yrs
- Wildfire 3/10 Moderate
- Heat 4/10 Moderate 7 d/yr ≥107°F today · 16 d/yr by 30 yrs out
- Wind 2/10 Low
- Air quality 3/10 Moderate 3 unhealthy d/yr today · 3 by 30 yrs out
Nearby sold comps map
Loading sold comps map…
Walkable amenities ~0.75 mi
Loading nearby amenities…
Taxation est. · year 1
- Rental income
- $18,386
- − Mortgage interest
- −$10,027
- − Property taxes
- −$1,717
- − Insurance
- −$895
- − Repairs & maintenance
- −$1,471
- − Management
- −$1,471
- − Depreciation
- −$5,207
- Taxable loss
- −$2,402
- Est. tax savings @ 24.0%
- +$576
- After-tax cash flow
- $1,225/yr
For passive investors: Depreciation is non-cash, so a rental often shows a tax loss while cash-flowing — sheltering income. Rental losses are passive: they offset passive income freely, and up to $25,000/yr can offset ordinary (W-2) income if you actively participate and your MAGI is under $100k (phasing out to $0 by $150k); unused losses carry forward. On sale, claimed depreciation is recaptured at up to 25%, and gains may owe capital-gains tax (a 1031 exchange can defer both). Figures are a year-1 estimate at your 24.0% rate — not tax advice; consult a CPA.
Schools (NCES district)
- District
- Excelsior Springs 40
- NCES district ID
- 2911650
- Math proficiency
- 27% ▼ -6.00%
- Reading proficiency
- 40% ▼ -1.00%
- Median HH income
- $52,747
- Composite
- 29.32/100
- National rank
- #6548
- State rank
- #225 of 324 in MO
Livability — Excelsior Springs
- Score
- 67/100
- State rank
- #228
- US rank
- #11166
Category grades
Schools grade is shown separately in the Schools card above.
Census & demographics
- Census place
- Excelsior Springs, MO
- County
- Clay County · 220,651 people
- City population
- 15,574
- Metro
- Kansas City, MO-KS
- Population (ZIP)
- 15,574
- Household income
- $77,895
- Rent vs Own
- Severe rent burden
- 329.0
Population outlook (Clay County) Hauer SSP2
- Today (2025)
- 266,022 people
- By 2030
- 280,057 · +5.3%
- By 2040
- 306,153 · +15.1%
- By 2050
- 328,630 · +23.5%
- By 2075
- 375,182 · +41.0%
- By 2100
- 392,861 · +47.7%
Race, ethnicity, and origin ACS 2023
- Neighborhood character
- Predominantly White (85%)
- Race & ethnicity
- White 85% Two or more races 7% Hispanic / Latino 6% Black 3% Native American 1%
- Hispanic origin (detail)
- Mexican 4% Cuban 2%
- Common ancestry
- Italian 2% Serbian 2% Portuguese 1%
- Foreign-born
- 3% · Canada, China
- Languages at home
- 95% English-only · Spanish 3%
Political lean MEDSL · Clay
- 2024 margin
- Lean R (+5.6) · D 46.4% · R 52.0% · Other 1.6%
- 2008→2024 swing
- -4.9pp toward R · 2008: -0.7pp · 2024: -5.6pp
- All cycles
- 2024: R+5.6 2020: R+4.1 2016: R+11.1 2012: R+8.4 2008: R+0.7
Not yet ingested
- Civics
- —
Market trends
- HPI YoY
- ▼ -54.83%
- Current HPI
- 302.9184
- Rent YoY
- —
- Metro
- Kansas City, MO-KS
- State GDP YoY
- ▲ 1.84%
- F500 in state
- 20
Industry mix (Fortune 500 HQ in MO)
| Industry | F500 HQs | Revenue |
|---|---|---|
| Healthcare | 1 | $163B |
|
||
| Insurance | 1 | $21B |
|
||
| Industrial Technology | 1 | $17B |
|
||
| Retail | 1 | $16B |
|
||
| Industrial Distribution | 1 | $10B |
|
||
| Utilities | 1 | $9B |
|
||
Price history
+59.1% since first listed5 events — show timeline
- 2026-06-06 Listed $179,000 Heartland MLS as Distributed by MLS Grid
- 2019-09-19 Sold (MLS) — Heartland MLS as Distributed by MLS Grid
- 2019-08-19 Pending — Heartland MLS as Distributed by MLS Grid
- 2019-08-10 Listed $112,500 Heartland MLS as Distributed by MLS Grid
- 2013-03-08 Sold (Public Records) — Public Records
Property tax history
+3.3%/yrLatest (2025): $1,717 · +12.0% YoY. Source: county tax records.
Cash-flow waterfall
monthlySold comps — $/sqft
last 12 mo · ≤1 miLoading sold comps…