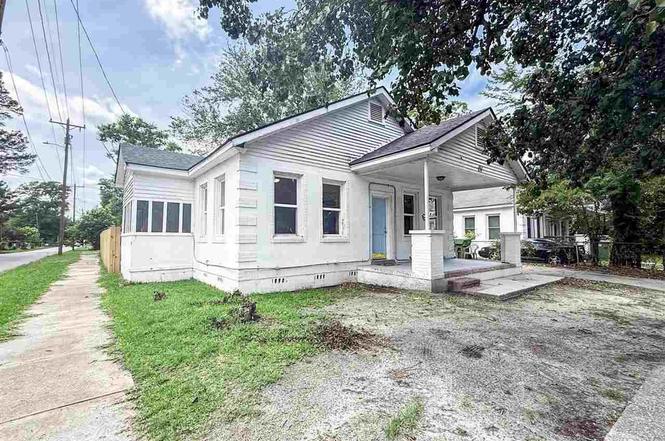
151 Harrell St · Florence, SC
Flood risk 1/10 · Minimal
- FEMA flood zone
- X (unshaded)
- Chance of flooding over 30 yrs
- 0.0%
- Est. flood insurance / yr
- $507 – $1,088
Fire risk 4/10 · Minor
- Est. fire insurance / yr
- $783 – $1,453
Heat risk 7/10 · Major
- Hot days now (above 107°F)
- 7 days/yr
- Hot days in 30 yrs
- 16 days/yr
Wind risk 8/10 · Major
- Chance of severe wind over 30 yrs
- 80.0%
Air-quality risk 1/10 · Minimal
- Unhealthy air days now
- 0 days/yr
- Unhealthy air days in 30 yrs
- 0 days/yr
Risk factors via First Street. Map © Google.
Why this score? — see what drove the D+ grade
The composite is a weighted blend of 9 inputs, each scored 0–100. Each bar is that input's sub-score; the figure is the points it added to the 100-point composite (weight × sub-score).
- Cash flow +18.7/30.0
- DSCR +5.9/10.0
- ARV discount +5.1/15.0
- 1% rule +3.8/10.0
- Rent growth +3.7/5.0
- Schools +3.2/10.0
- Livability +3.1/5.0
- Condition / age +2.5/5.0
- Appreciation +0.0/10.0
$170,000
🖨 Deal sheet (PDF) 📄 Offer letter ✓ Due diligence
Listing remarks
Three bedroom and one bathroom home with over 1,000 sq ft sitting on a corner lot within the city limits! THIS HOME IS MOVE IN READY!! The options are endless if you are wanting to owner occupy or purchase as an invest opportunity! * Some images are virtually staged *
Key facts
- 5,663 sq ft lot
- Built 1945
- Listed 3 days
Property features AI
Exterior
- Utilities: Public water; Public sewer
- Home design: Single-family residence; Residential property
- Construction: Wood siding; Shingle roof; Built area above grade: 1,170
- Exterior features: Porch; Fenced yard; Corner lot
Interior
- Kitchen: Range
- Flooring: Tile; Vinyl; Hardwood
- Bathrooms: 1 full bathroom
- Heating & cooling: Heat pump and central heating; Central air conditioning
- Interior features: Range; Tile, vinyl and hardwood flooring; Crawl space basement
Neighborhood map
What this means for you Summary
Snapshot
- This is a 3-bed/1.0-bath single-family listed at $170k.
Deal economics
- At list price, monthly cash flow is $168 ($2k/yr) — positive.
- The deal already cash-flows at list — no discount required.
- To meet the 1% rule (rent ≥ 1% of price), the offer needs to be $149k (12.2% below list).
- Recommended offer: $149k (12.2% below list) — sets the bar for 1% rule.
- Cap rate 7.5% vs local median 3.5% in Florence — top-decile yield for the area; either an underpriced asset or a hidden risk that comps aren't pricing in. Stress-test before assuming the spread holds.
Location & tenants
- Location reads 62/100 on livability (#196 in SC) — a middle-class / working-renter tenant base. Strengths: cost of living A+, housing A+, health & safety B+; Watch: employment C-, crime F, amenities F.
- Florence 01 (urban): math 29% / reading 47% proficiency, ranked #34 of 80 in SC (top 42%) — families likely to look elsewhere, expect single-tenant / working-renter base with shorter leases.
- Zoned schools: Royall Elementary (math 43% / reading 61%, grade C-, #145 of 597 statewide, top 26%, 478 students, 100% FRL); Williams Middle (math 23% / reading 46%, grade F, #107 of 229 statewide, top 47%, 836 students, 100% FRL); Wilson High (math 52% / reading 75%, grade B-, #95 of 196 statewide, top 49%, 1,365 students, 100% FRL) — zoned schools average 100% FRL vs 57% district-wide (43 pts higher); higher-poverty schools than district average — tighter screening recommended.
- Zoned-school proficiency averages 50% at this address vs 38% district-wide (+12 pts) — the actual schools serving this property are materially stronger than the Florence 01 average implies; a family-tenant draw the district grade alone would hide.
- Market conditions: Rents rising fast (+4.7%/yr); 340 active listings in the ZIP; 657 units permitted in Florence County in 2024 (40 in 5+ unit buildings).
Forward outlook
- Local home prices are declining (-3.0%/yr); year-one equity from $1k of loan paydown is wiped out by about $5k of value loss. Plan a longer hold.
Negotiation context
- Only 3 days on market — expect competitive offers; lowballing is unlikely to land.
- 4 sale attempts since 5y ago with the ask held roughly flat each time — persistent listings suggest the price (not the market) is what's stuck; bring a comps-based counter.
- Current owner paid $45k; list at $170k implies a 278% gain — meaningful room to come down on a strong offer.
Risks & watch-outs
- Watch-outs: built in 1945 — expect roof / HVAC / electrical / plumbing capex.
- Climate carrying-cost: severe wind risk, 80% chance of damaging wind over 30y; extreme-heat days projected 7→16/yr by 2055 (HVAC capex compounding) — expect insurance premiums to compound above CPI over the hold.
Questions for the listing agent
- Built in 1945 — when were the roof, HVAC, electrical panel, plumbing, and water heater last replaced?
- Is there a deadline driving the sale (1031 exchange, divorce, estate, relocation)? That informs how much negotiation room exists.
- Crime grade is F in this area — have there been break-ins, vandalism, or insurance claims at this property in the last 3 years? What carrier currently insures it and at what premium?
- The area grade is low — what's the realistic commute time and amenity access for the typical tenant pool here? Any planned neighborhood developments (good or bad) we should know about?
- What's the average days-on-market for RENTAL listings here right now (not sales)? A rising rental-DOM trend means longer vacancies and softer asking-rent achievability than the comps imply.
- What's the recent tenant-quality profile in this submarket — average credit score on applications, eviction rate, late-payment / NSF rate, and stable-employment percentage? A property-management company in the area should have these aggregated.
- How much new for-sale + rental construction is in the pipeline within 1–3 miles? Heavy new supply typically softens prices + rents 12–24 months out; constrained supply supports both.
Investment metrics
- 1% rule
- 0.88% ✗
- Cap rate
- 7.48%
- Cash-on-cash
- 4.23%
- DSCR
- 1.19
- GRM
- 9.5
CMA / ARV
- ARV (on-the-fly)
- $161,460
- Comps found
- 12
Show comp detail 12 sales within ~0.75 mi
| Address | Dist | Beds/Ba | Sqft | Sold | Price | $/sf | Match |
|---|---|---|---|---|---|---|---|
| 1203 Waverly Ave | 0.43mi | 3/1.5 | 1,120 (-4%) | 1mo | $49,000 | $44 | 70 |
| 1206 Gregg Ave | 0.51mi | 3/1.0 | 1,226 (+5%) | 2mo | $179,900 | $147 | 67 |
| 418 Winston St | 0.54mi | 2/1.5 (-1) | 1,128 (-4%) | 3mo | $182,000 | $161 | 60 |
| 1310 King Ave | 0.63mi | 2/1.0 (-1) | 1,152 (-2%) | 7mo | $165,000 | $143 | 57 |
| 426 Manor Cir | 0.62mi | 3/1.0 | 1,074 (-8%) | 4mo | $110,000 | $102 | 54 |
| 705 Lawson St | 0.58mi | 4/1.0 (+1) | 1,319 (+13%) | 2mo | $120,000 | $91 | 45 |
| 1103 Heatherwood Cirlce Cir | 0.72mi | 3/1.0 | 1,301 (+11%) | 9mo | $168,000 | $129 | 40 |
| 515 W Pennsylvania St | 0.71mi | 2/1.0 (-1) | 1,023 (-13%) | 1mo | $55,000 | $54 | 40 |
| 1301 Gregg Ave | 0.60mi | 2/1.0 (-1) | 1,306 (+12%) | 10mo | $180,000 | $138 | 40 |
| 903 W Cedar St | 0.66mi | 3/1.0 | 1,341 (+15%) | 8mo | $190,000 | $142 | 39 |
| 320 N Schofield St | 0.70mi | 3/1.0 | 1,000 (-14%) | 8mo | $165,000 | $165 | 36 |
| 1005 Kalmia St | 0.74mi | 2/2.0 (-1) | 1,080 (-8%) | 10mo | $139,900 | $130 | 36 |
Match score weights: distance 35% · size 25% · config 20% · recency 20%. Top-matched comps best support the ARV.
Projected returns pro-forma
-3.0% appreciation · 4.7% rent growth · sell at horizon
- IRR
- -8.1%
- Equity multiple
- 0.70×
- Total profit
- $-14,338
- Equity at exit
- $25,348
- IRR
- 3.3%
- Equity multiple
- 1.25×
- Total profit
- $11,997
- Equity at exit
- $14,698
Cash invested: $47,600 (down + closing). Projections, not guarantees.
Landlord ↔ Tenant lean methodology
- Overall (STATE)
- 90 Strongly Landlord-Friendly
- State South Carolina
- 90 Strongly Landlord-Friendly · R+6
- County
- — inherits STATE
- City
- — inherits STATE
ZIP-level market 29501
- Rents YoY
- 4.7%
- Active inventory
- 340
- Price-to-rent
- 9.5×
Monthly cashflow live
- Estimated rent
- $1,493 medium interval (Pro) →
- Mortgage (P&I)
- −$891
- Tax from tax record
- −$49 /mo · $592/yr
- Insurance
- −$71
- HOA
- −$0
- Vacancy / Maint / Mgmt
- −$314
- Net cashflow
- $168
Break-even live
Sensitivity live
| Price | -10% $264 | -5% $216 | +0% $168 | +5% $120 | +10% $72 |
|---|---|---|---|---|---|
| Rent | -10% $50 | -5% $109 | +0% $168 | +5% $227 | +10% $286 |
| Rate | -1.0pp $253 | -0.5pp $211 | base $168 | +0.5pp $124 | +1.0pp $79 |
UW: 25.0% down · 7.5% · 30yr · 1.5% tax · 5.0% vac · 8.0% maint · 8.0% mgmt
Financing live
Cash to close
- Down payment
- $42,500
- Closing costs
- $5,100
- Reserves months
- —
- Total cash needed
- —
Loan-product check · same deal, 3 products live
Conventional
25% down · 7.5% · 30yr
- Down + closing
- —
- Monthly P&I
- —
- Monthly cashflow
- —
- DSCR
- —
- Eligible?
- —
Personal DTI + credit; lowest rate.
DSCR
20% down · 8.5% · 30yr
- Down + closing
- —
- Monthly P&I
- —
- Monthly cashflow
- —
- DSCR
- —
- Eligible?
- —
No personal income docs; deal must DSCR.
Hard money
10% down · 12.0% · 12mo
- Down + closing
- —
- Monthly P&I
- —
- Monthly cashflow
- —
- DSCR
- —
- Eligible?
- —
Short-term bridge; refi at stabilization.
Listing history 3 events
-
2026-06-22days on market $170,000 Active 3 DOM
-
2026-06-19remarks 270-char remark
-
2026-06-19$170,000 Active 1 DOM
ⓘ Source: listings_history table (triggers on properties + properties_extension) + one-shot
backfill from property_details.listing_events for pre-trigger history.
Tax reassessment forecast SC · Resets to sale price
- Current annual tax
- $592 · $49/mo
- Projected year-2 tax
- $969 · $81/mo
- Expected delta
- +$377/yr (+$31/mo · 63.8%)
ⓘ Screening estimate from a state-policy table — verify with the county assessor before closing.
Climate risk First Street
- Flood 1/10 Low FEMA zone X (unshaded) · 0% chance over 30 yrs
- Wildfire 4/10 Moderate
- Heat 7/10 Severe 7 d/yr ≥107°F today · 16 d/yr by 30 yrs out
- Wind 8/10 Severe 80% chance of damaging wind over 30 yrs
- Air quality 1/10 Low 0 unhealthy d/yr today · 0 by 30 yrs out
Nearby sold comps map
Loading sold comps map…
Walkable amenities ~0.75 mi
Loading nearby amenities…
Taxation est. · year 1
- Rental income
- $17,916
- − Mortgage interest
- −$9,523
- − Property taxes
- −$592
- − Insurance
- −$850
- − Repairs & maintenance
- −$1,433
- − Management
- −$1,433
- − Depreciation
- −$4,945
- Taxable loss
- −$860
- Est. tax savings @ 24.0%
- +$206
- After-tax cash flow
- $2,221/yr
For passive investors: Depreciation is non-cash, so a rental often shows a tax loss while cash-flowing — sheltering income. Rental losses are passive: they offset passive income freely, and up to $25,000/yr can offset ordinary (W-2) income if you actively participate and your MAGI is under $100k (phasing out to $0 by $150k); unused losses carry forward. On sale, claimed depreciation is recaptured at up to 25%, and gains may owe capital-gains tax (a 1031 exchange can defer both). Figures are a year-1 estimate at your 24.0% rate — not tax advice; consult a CPA.
Schools (NCES district)
- District
- Florence 01
- NCES district ID
- 4502130
- Math proficiency
- 29% ▼ -10.00%
- Reading proficiency
- 47% ▬ 0.00%
- Median HH income
- $45,782
- Composite
- 32.36/100
- National rank
- #5737
- State rank
- #34 of 80 in SC
Livability — Florence
- Score
- 62/100
- State rank
- #196
- US rank
- #17076
Category grades
Schools grade is shown separately in the Schools card above.
Census & demographics
- Census place
- Florence, SC
- County
- Florence County · 93,345 people
- City population
- 93,345
- Metro
- Florence, SC
- Population (ZIP)
- 48,673
- Household income
- $71,671
- Rent vs Own
- Severe rent burden
- 1792.0
Population outlook (Florence County) Hauer SSP2
- Today (2025)
- 141,714 people
- By 2030
- 142,121 · +0.3%
- By 2040
- 141,344 · -0.3%
- By 2050
- 139,478 · -1.6%
- By 2075
- 132,275 · -6.7%
- By 2100
- 118,374 · -16.5%
Race, ethnicity, and origin ACS 2023
- Neighborhood character
- Diverse neighborhood (Simpson 0.56)
- Race & ethnicity
- White 56% Black 35% Asian 3% Hispanic / Latino 3% Two or more races 3%
- Common ancestry
- Serbian 2% Slovak 2% Lithuanian 1%
- Foreign-born
- 4% · Canada, China
- Languages at home
- 93% English-only · Spanish 3% Other Indo-European 1% Russian/Polish/Slavic 1%
Political lean MEDSL · Florence
- 2024 margin
- Lean R (+8.0) · D 45.3% · R 53.3% · Other 1.3%
- 2008→2024 swing
- -4.8pp toward R · 2008: -3.2pp · 2024: -8.0pp
- All cycles
- 2024: R+8.0 2020: R+2.3 2016: R+5.0 2012: R+0.5 2008: R+3.2
Not yet ingested
- Civics
- —
Market trends
- HPI YoY
- ▼ -181.85%
- Current HPI
- 171.4154
- Rent YoY
- ▲ 4.70%
- Metro
- Florence, SC
- State GDP YoY
- ▲ 4.51%
- F500 in state
- 2
Industry mix (Fortune 500 HQ in SC)
| Industry | F500 HQs | Revenue |
|---|---|---|
| Packaging | 1 | $7B |
|
||
Price history
+958.6% since first listed8 events — show timeline
- 2026-06-18 Listed $170,000 RAGPD
- 2025-01-02 Relisted — RAGPD
- 2024-06-12 Listed $124,900 RAGPD
- 2021-11-03 Listed $100,000 RAGPD
- 2002-12-31 Sold (Public Records) $45,000 Public Records
- 2002-05-31 Sold (Public Records) $18,000 Public Records
- 1990-09-30 Sold (Public Records) $16,059 Public Records
- 1990-07-31 Sold (Public Records) $16,059 Public Records
Property tax history
-1.9%/yrLatest (2025): $592 · +6.2% YoY. Source: county tax records.
Cash-flow waterfall
monthlySold comps — $/sqft
last 12 mo · ≤1 miLoading sold comps…