9916 Golf Course Rd #54 · West Ocean City, MD
Flood risk 9/10 · Severe
- FEMA flood zone
- AE
- Chance of flooding over 30 yrs
- 0.99%
- Est. flood insurance / yr
- $1,737 – $8,500
Fire risk 3/10 · Minor
- Est. fire insurance / yr
- $755 – $1,403
Heat risk 9/10 · Severe
- Hot days now (above 101°F)
- 7 days/yr
- Hot days in 30 yrs
- 17 days/yr
Wind risk 8/10 · Major
- Chance of severe wind over 30 yrs
- 80.0%
Air-quality risk 2/10 · Minimal
- Unhealthy air days now
- 1 days/yr
- Unhealthy air days in 30 yrs
- 2 days/yr
Risk factors via First Street. Map © Google.
Why this score? — see what drove the C- grade
The composite is a weighted blend of 9 inputs, each scored 0–100. Each bar is that input's sub-score; the figure is the points it added to the 100-point composite (weight × sub-score).
- Cash flow +16.2/30.0
- ARV discount +15.0/15.0
- DSCR +5.0/10.0
- 1% rule +3.9/10.0
- Livability +3.9/5.0
- Schools +3.3/10.0
- Rent growth +2.5/5.0
- Condition / age +2.5/5.0
- Appreciation +0.0/10.0
$299,900
🖨 Deal sheet 📄 Offer letter ✓ Due diligence
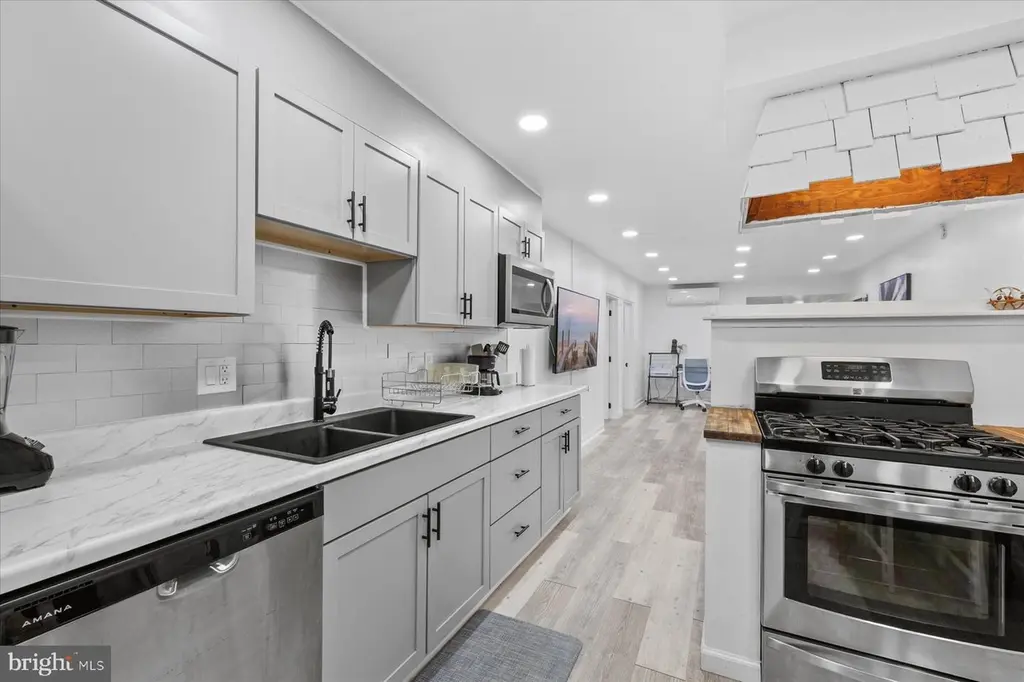
Listing remarks MLS
Turnkey, fully renovated, and perfectly positioned in West Ocean City—this one checks every box. This fully renovated 5-bedroom, 2-bath home has been thoughtfully updated from top to bottom and is ready for immediate enjoyment or investment. Improvements include added bedrooms, updated siding and window trim, a refreshed kitchen, upgraded electrical and plumbing, renovated bathrooms, new flooring, added closet space, interior A/C units, new furnishings and TVs, and fresh paint throughout—every detail has been addressed. Enjoy outdoor living with a shaded front deck plus additional rear decking, offering multiple spaces to relax or entertain. Tucked away at the back of Delmarva Park, this home offers a quiet setting while still being moments from everything Ocean City and West Ocean City have to offer. Boaters will love the proximity to the West Ocean City fishing harbor—with room to store a boat on the property—while beachgoers and commuters will appreciate the nearby Park & Ride just steps away. A rare combination of privacy, convenience, and move-in-ready condition makes this property a standout opportunity.
Key facts
- Fully renovated
- Updated siding
- Renovated bathrooms
Tags
Neighborhood map
What this means for you Summary
Snapshot
- This is a 5-bed/1.5-bath manufactured listed at $300k.
Deal economics
- At list price, monthly cash flow is $-270 ($-3k/yr) — negative.
- To cash-flow at today's rent, offer at most $252k (15.9% below list).
- To meet the 1% rule (rent ≥ 1% of price), the offer needs to be $266k (11.3% below list).
- Recommended offer: $252k (15.9% below list) — sets the bar for cash-flow.
- Cap rate 6.9% vs local median 2.6% in West Ocean City — top-decile yield for the area; either an underpriced asset or a hidden risk that comps aren't pricing in. Stress-test before assuming the spread holds.
Location & tenants
- Location reads 78/100 on livability (#69 in MD, #2,499 nationally) — a middle-class / working-renter tenant base. Strengths: employment A+, housing A+, health & safety A+; Watch: amenities C-, commute F, cost of living D-.
- Worcester County Public Schools (town): math 30% / reading 44% proficiency, ranked #6 of 24 in MD (top 25%) — families likely to look elsewhere, expect single-tenant / working-renter base with shorter leases.
- Market conditions: 673 active listings in the ZIP; solid renter incomes; 354 units permitted in Worcester County in 2024 (6 in 5+ unit buildings).
- This rent runs 40% of the median local income ($80k/yr) — at the standard rent-burdened threshold; future hikes will face affordability resistance.
Forward outlook
- Local home prices are declining (-3.0%/yr); year-one equity from $2k of loan paydown is wiped out by about $9k of value loss. Plan a longer hold.
- Worcester County population projected to shrink 4% by 2050 — rents likely to lag national; underwrite the cash flow, not the appreciation.
Negotiation context
- It's been on market 142 days — a 12% lower offer ($264k) is reasonable based on typical stale-listing flexibility.
- 3 sale attempts since 2y ago; this cycle's ask has dropped $39k (12%) from the opening price — seller is motivated, your offer sets the floor, not the list.
Risks & watch-outs
- Watch-outs: flood insurance adds $427/mo.
- Climate carrying-cost: in FEMA flood zone AE (mandatory federal flood insurance); severe wind risk, 80% chance of damaging wind over 30y; extreme-heat days projected 7→17/yr by 2055 (HVAC capex compounding) — expect insurance premiums to compound above CPI over the hold.
Questions for the listing agent
- What do current leases actually rent for vs. the listed asking? Can we see a recent rent roll and the last 12 months of T-12 income?
- It's been on market 142 days. Have you received any prior offers? Is the seller open to a 16% concession, seller financing, or rate buy-down credit?
- Built in 1975 — when were the roof, HVAC, electrical panel, plumbing, and water heater last replaced?
- What's the actual annual flood-insurance premium (NFIP or private), and is the property in a SFHA with mandatory coverage?
- What does the HOA fee cover, when was the last increase, and are there any pending special assessments or reserve-fund shortfalls?
- Why hasn't it sold? Are there any deal-killer items the seller is aware of (foundation, flood, title, zoning, code violations)?
- Is there a deadline driving the sale (1031 exchange, divorce, estate, relocation)? That informs how much negotiation room exists.
- What's the average days-on-market for RENTAL listings here right now (not sales)? A rising rental-DOM trend means longer vacancies and softer asking-rent achievability than the comps imply.
- What's the recent tenant-quality profile in this submarket — average credit score on applications, eviction rate, late-payment / NSF rate, and stable-employment percentage? A property-management company in the area should have these aggregated.
- How much new for-sale + rental construction is in the pipeline within 1–3 miles? Heavy new supply typically softens prices + rents 12–24 months out; constrained supply supports both.
Investment metrics
- 1% rule
- 0.89% ✗
- Cap rate
- 6.92%
- Cash-on-cash
- 2.24%
- DSCR
- 1.10
- GRM
- 9.4
CMA / ARV
- ARV (median comp)
- $561,920
- List price
- $299,900
- Delta
- -46.63%
- Verdict
- UNDERPRICED
- Comps
- 14 within 2.0 mi
Projected returns pro-forma
-3.0% appreciation · 3.0% rent growth · sell at horizon
- IRR
- -22.7%
- Equity multiple
- 0.22×
- Total profit
- $-65,557
- Equity at exit
- $44,716
- IRR
- -16.8%
- Equity multiple
- 0.07×
- Total profit
- $-78,306
- Equity at exit
- $25,930
Cash invested: $83,972 (down + closing). Projections, not guarantees.
Landlord ↔ Tenant lean methodology
- Overall (STATE)
- 27 Tenant-Leaning
- State Maryland
- 27 Tenant-Leaning · D+14
- County
- — inherits STATE
- City
- — inherits STATE
ZIP-level market 21842
- Home prices YoY
- -5.0%
- Active inventory
- 673
- Price-to-rent
- 9.4×
Monthly cashflow live
- Estimated rent
- $2,659 medium interval (Pro) →
- Mortgage (P&I)
- −$1,573
- Tax from tax record
- −$121 /mo · $1,454/yr
- Insurance
- −$125
- Flood insurance flood zone
- −$427 /mo · $5,118/yr
- HOA
- −$125
- Vacancy / Maint / Mgmt
- −$558
- Net cashflow
- $-270
Break-even live
UW: 25.0% down · 7.5% · 30yr · 1.5% tax · 5.0% vac · 8.0% maint · 8.0% mgmt
Financing live
Cash to close
- Down payment
- $74,975
- Closing costs
- $8,997
- Reserves months
- —
- Total cash needed
- —
Loan-product check · same deal, 3 products live
Conventional
25% down · 7.5% · 30yr
- Down + closing
- —
- Monthly P&I
- —
- Monthly cashflow
- —
- DSCR
- —
- Eligible?
- —
Personal DTI + credit; lowest rate.
DSCR
20% down · 8.5% · 30yr
- Down + closing
- —
- Monthly P&I
- —
- Monthly cashflow
- —
- DSCR
- —
- Eligible?
- —
No personal income docs; deal must DSCR.
Hard money
10% down · 12.0% · 12mo
- Down + closing
- —
- Monthly P&I
- —
- Monthly cashflow
- —
- DSCR
- —
- Eligible?
- —
Short-term bridge; refi at stabilization.
HOA detail
- Monthly dues
- $125 · $1,500/yr
- Likely covers
- electric
Listing history 22 events
-
2026-06-18days on market $299,900 Active 142 DOM
-
2026-06-17days on market $299,900 Active 141 DOM
-
2026-06-16days on market $299,900 Active 140 DOM
-
2026-06-15days on market $299,900 Active 139 DOM
-
2026-06-14days on market $299,900 Active 137 DOM
-
2026-06-13pricedays on market $299,900 Active 136 DOM
-
2026-06-10days on market $329,000 Active 134 DOM
-
2026-06-09days on market $329,000 Active 133 DOM
-
2026-06-08days on market $329,000 Active 132 DOM
-
2026-06-07days on market $329,000 Active 131 DOM
-
2026-06-02days on market $329,000 Active 126 DOM
-
2026-06-01days on market $329,000 Active 125 DOM
-
2026-05-31days on market $329,000 Active 124 DOM
-
2026-05-30days on market $329,000 Active 123 DOM
-
2026-04-17price $329,000 1157-char remark
Show marketing remark (1157 chars)
Turnkey, fully renovated, and perfectly positioned in West Ocean City—this one checks every box. This fully renovated 5-bedroom, 2-bath home has been thoughtfully updated from top to bottom and is ready for immediate enjoyment or investment. Improvements include added bedrooms, updated siding and window trim, a refreshed kitchen, upgraded electrical and plumbing, renovated bathrooms, new flooring, added closet space, interior A/C units, new furnishings and TVs, and fresh paint throughout—every detail has been addressed. Enjoy outdoor living with a shaded front deck plus additional rear decking, offering multiple spaces to relax or entertain. Tucked away at the back of Delmarva Park, this home offers a quiet setting while still being moments from everything Ocean City and West Ocean City have to offer. Boaters will love the proximity to the West Ocean City fishing harbor—with room to store a boat on the property—while beachgoers and commuters will appreciate the nearby Park & Ride just steps away. A rare combination of privacy, convenience, and move-in-ready condition makes this property a standout opportunity.
-
2026-01-27$339,000 Active 1157-char remark
Show marketing remark (1157 chars)
Turnkey, fully renovated, and perfectly positioned in West Ocean City—this one checks every box. This fully renovated 5-bedroom, 2-bath home has been thoughtfully updated from top to bottom and is ready for immediate enjoyment or investment. Improvements include added bedrooms, updated siding and window trim, a refreshed kitchen, upgraded electrical and plumbing, renovated bathrooms, new flooring, added closet space, interior A/C units, new furnishings and TVs, and fresh paint throughout—every detail has been addressed. Enjoy outdoor living with a shaded front deck plus additional rear decking, offering multiple spaces to relax or entertain. Tucked away at the back of Delmarva Park, this home offers a quiet setting while still being moments from everything Ocean City and West Ocean City have to offer. Boaters will love the proximity to the West Ocean City fishing harbor—with room to store a boat on the property—while beachgoers and commuters will appreciate the nearby Park & Ride just steps away. A rare combination of privacy, convenience, and move-in-ready condition makes this property a standout opportunity.
-
2025-10-15historical
-
2025-07-14$349,900 Active
-
2025-07-12historical
-
2025-05-23price $349,900
-
2024-07-15$399,900 Active
-
2024-07-12historical
ⓘ Source: listings_history table (triggers on properties + properties_extension) + one-shot
backfill from property_details.listing_events for pre-trigger history.
Tax reassessment forecast MD · Partial reset (capped growth)
- Current annual tax
- $1,454 · $121/mo
- Projected year-2 tax
- $2,361 · $197/mo
- Expected delta
- +$908/yr (+$76/mo · 62.4%)
ⓘ Screening estimate from a state-policy table — verify with the county assessor before closing.
Climate risk First Street
- Flood 9/10 Extreme FEMA zone AE · 99% chance over 30 yrs
- Wildfire 3/10 Moderate
- Heat 9/10 Extreme 7 d/yr ≥101°F today · 17 d/yr by 30 yrs out
- Wind 8/10 Severe 80% chance of damaging wind over 30 yrs
- Air quality 2/10 Low 1 unhealthy d/yr today · 2 by 30 yrs out
Nearby sold comps map
Loading sold comps map…
Walkable amenities ~0.75 mi
Loading nearby amenities…
Taxation est. · year 1
- Rental income
- $31,907
- − Mortgage interest
- −$16,799
- − Property taxes
- −$1,454
- − Insurance
- −$6,618
- − Repairs & maintenance
- −$2,553
- − Management
- −$2,553
- − HOA
- −$1,500
- − Depreciation
- −$8,724
- Taxable loss
- −$8,293
- Est. tax savings @ 24.0%
- +$1,990
- After-tax cash flow
- $-1,247/yr
For passive investors: Depreciation is non-cash, so a rental often shows a tax loss while cash-flowing — sheltering income. Rental losses are passive: they offset passive income freely, and up to $25,000/yr can offset ordinary (W-2) income if you actively participate and your MAGI is under $100k (phasing out to $0 by $150k); unused losses carry forward. On sale, claimed depreciation is recaptured at up to 25%, and gains may owe capital-gains tax (a 1031 exchange can defer both). Figures are a year-1 estimate at your 24.0% rate — not tax advice; consult a CPA.
Schools (NCES district)
- District
- Worcester County Public Schools
- NCES district ID
- 2400720
- Math proficiency
- 30% ▼ -25.00%
- Reading proficiency
- 44% ▼ -20.00%
- Median HH income
- $56,748
- Composite
- 32.6/100
- National rank
- #5672
- State rank
- #6 of 24 in MD
Livability — West Ocean City
- Score
- 78/100
- State rank
- #69
- US rank
- #2499
Category grades
Schools grade is shown separately in the Schools card above.
Census & demographics
- Census place
- West Ocean City, MD
- County
- Worcester County · 35,603 people
- Metro
- Salisbury, MD-DE
- Population (ZIP)
- 11,226
- Household income
- $79,876
- Rent vs Own
- Severe rent burden
- 322.0
Population outlook (Worcester County) Hauer SSP2
- Today (2025)
- 51,363 people
- By 2030
- 51,191 · -0.3%
- By 2040
- 50,459 · -1.8%
- By 2050
- 49,451 · -3.7%
- By 2075
- 48,533 · -5.5%
- By 2100
- 44,223 · -13.9%
Race, ethnicity, and origin ACS 2023
- Neighborhood character
- Predominantly White (86%)
- Race & ethnicity
- White 86% Hispanic / Latino 8% Two or more races 5% Black 3%
- Hispanic origin (detail)
- Mexican 3%
- Common ancestry
- Romanian 6% Slovak 3% Lithuanian 2%
- Foreign-born
- 10% · Canada, China
- Languages at home
- 87% English-only · Spanish 7% Russian/Polish/Slavic 3% Other Indo-European 2%
Political lean MEDSL · Worcester
- 2024 margin
- Strong R (+22.0) · D 38.0% · R 60.0% · Other 2.0%
- 2008→2024 swing
- -6.5pp toward R · 2008: -15.5pp · 2024: -22.0pp
- All cycles
- 2024: R+22.0 2020: R+19.0 2016: R+27.9 2012: R+18.3 2008: R+15.5
Not yet ingested
- Civics
- —
Market trends
- HPI YoY
- ▼ -25.65%
- Current HPI
- 482.18
- Rent YoY
- —
- Metro
- Salisbury, MD-DE
- State GDP YoY
- ▲ 2.97%
- F500 in state
- 12
Industry mix (Fortune 500 HQ in MD)
| Industry | F500 HQs | Revenue |
|---|---|---|
| Aerospace / Defense | 1 | $71B |
|
||
| Utilities | 1 | $25B |
|
||
| Hotels | 1 | $24B |
|
||
| Consumer Goods | 1 | $7B |
|
||
| Real Estate | 1 | $6B |
|
||
| Chemicals | 1 | $2B |
|
||
Price history
-17.7% since first listed8 events — show timeline
- 2026-04-17 Price Changed $329,000 BRIGHT MLS
- 2026-01-27 Listed $339,000 BRIGHT MLS
- 2025-10-15 Listing Removed — BRIGHT MLS
- 2025-07-14 Listed $349,900 BRIGHT MLS
- 2025-07-12 Listing Removed — BRIGHT MLS
- 2025-05-23 Price Changed $349,900 BRIGHT MLS
- 2024-07-15 Listed $399,900 BRIGHT MLS
- 2024-07-12 Coming Soon — BRIGHT MLS
Property tax history
+8.7%/yrLatest (2025): $1,454 · +8.3% YoY. Source: county tax records.
Cash-flow waterfall
monthlySold comps — $/sqft
last 12 mo · ≤1 miLoading sold comps…