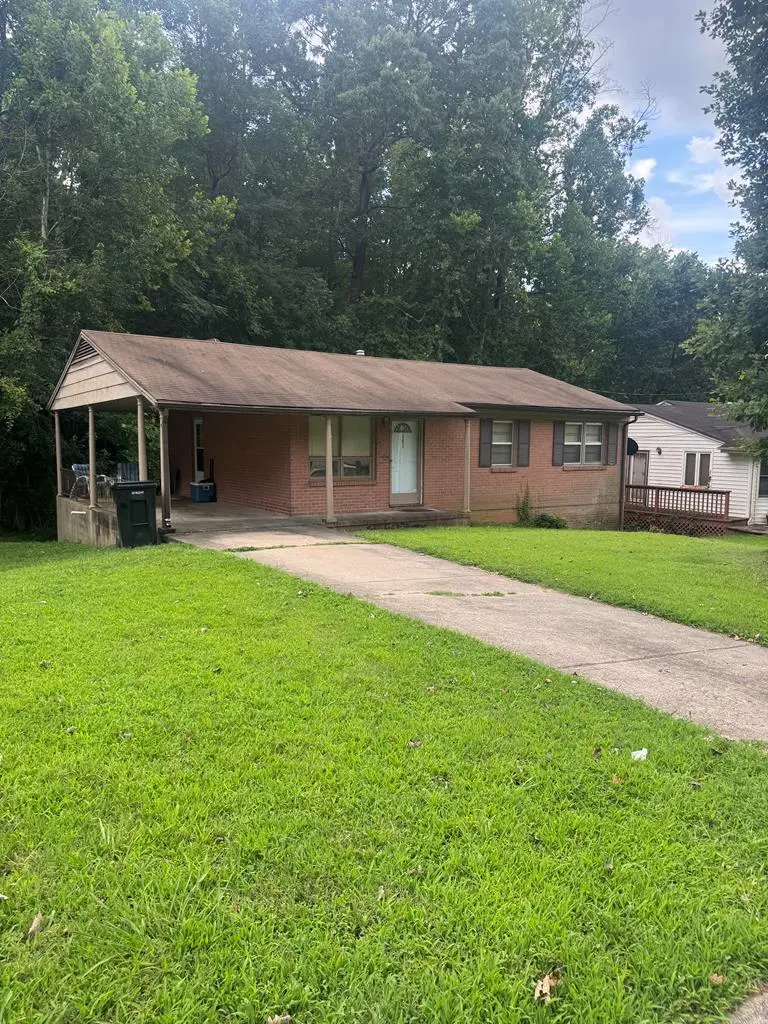
141 Starmont Dr · Danville, VA
Flood risk 7/10 · Major
- FEMA flood zone
- X (unshaded)
- Chance of flooding over 30 yrs
- 0.77%
- Est. flood insurance / yr
- $473 – $860
Fire risk 3/10 · Minor
- Est. fire insurance / yr
- $666 – $1,236
Heat risk 6/10 · Moderate
- Hot days now (above 105°F)
- 7 days/yr
- Hot days in 30 yrs
- 18 days/yr
Wind risk 4/10 · Minor
- Chance of severe wind over 30 yrs
- 9.0%
Air-quality risk 2/10 · Minimal
- Unhealthy air days now
- 0 days/yr
- Unhealthy air days in 30 yrs
- 1 days/yr
Risk factors via First Street. Map © Google.
Why this score? — see what drove the D+ grade
The composite is a weighted blend of 9 inputs, each scored 0–100. Each bar is that input's sub-score; the figure is the points it added to the 100-point composite (weight × sub-score).
- ARV discount +15.0/15.0
- Cash flow +13.8/30.0
- DSCR +4.2/10.0
- Livability +3.9/5.0
- Schools +3.0/10.0
- 1% rule +2.7/10.0
- Rent growth +2.5/5.0
- Condition / age +2.5/5.0
- Appreciation +0.0/10.0
$164,900
🖨 Deal sheet 📄 Offer letter ✓ Due diligence
Listing remarks MLS
Great home in a great location. Nice floorplan for entertaining
Key facts
- 0.24 acre lot
- Built 1964
- Listed 331 days
Neighborhood map
What this means for you Summary
Snapshot
- This is a 3-bed/1.5-bath single-family listed at $165k.
Deal economics
- At list price, monthly cash flow is $-41 ($-486/yr) — negative.
- To cash-flow at today's rent, offer at most $158k (4.3% below list).
- To meet the 1% rule (rent ≥ 1% of price), the offer needs to be $126k (23.5% below list).
- Recommended offer: $126k (23.5% below list) — sets the bar for 1% rule.
- Cap rate 6.4% vs local median 5.3% in Danville — meaningfully above typical; check what's discounted (condition, days-on-market, listing class) to confirm the premium yield is real.
Location & tenants
- Location reads 77/100 on livability (#91 in VA, #2,952 nationally) — a middle-class / working-renter tenant base. Strengths: cost of living A+, housing A+, health & safety A+; Watch: amenities D+, crime D-, commute F.
- Danville City Public School District (town): math 30% / reading 44% proficiency, ranked #128 of 131 in VA (top 98%) — families likely to look elsewhere, expect single-tenant / working-renter base with shorter leases; 71% free/reduced lunch — lower-income household profile, screen leases tightly.
- Market conditions: 211 active listings in the ZIP; 4 comparable units currently listed for rent nearby; rentals lingering (median 44d on market — plan ~5-8 weeks vacancy on turnover, expect pricing pressure); 100% of comp listings sitting > 30 days — soft ceiling on asking rent; 54 units permitted in Danville city in 2024 (40 in 5+ unit buildings).
- This rent runs 32% of the median local income ($48k/yr) — at the standard rent-burdened threshold; future hikes will face affordability resistance.
Forward outlook
- Local home prices are declining (-3.0%/yr); year-one equity from $1k of loan paydown is wiped out by about $5k of value loss. Plan a longer hold.
- Danville County population projected to shrink 7% by 2050 — rents likely to lag national; underwrite the cash flow, not the appreciation.
Negotiation context
- It's been on market 332 days — a 12% lower offer ($145k) is reasonable based on typical stale-listing flexibility.
- 5 sale attempts since 3y ago with the ask held roughly flat each time — persistent listings suggest the price (not the market) is what's stuck; bring a comps-based counter.
Risks & watch-outs
- Watch-outs: flood insurance adds $56/mo.
- Climate carrying-cost: major flood risk; extreme-heat days projected 7→18/yr by 2055 (HVAC capex compounding) — expect insurance premiums to compound above CPI over the hold.
Questions for the listing agent
- What do current leases actually rent for vs. the listed asking? Can we see a recent rent roll and the last 12 months of T-12 income?
- It's been on market 332 days. Have you received any prior offers? Is the seller open to a 23% concession, seller financing, or rate buy-down credit?
- Built in 1964 — when were the roof, HVAC, electrical panel, plumbing, and water heater last replaced?
- What's the actual annual flood-insurance premium (NFIP or private), and is the property in a SFHA with mandatory coverage?
- Why hasn't it sold? Are there any deal-killer items the seller is aware of (foundation, flood, title, zoning, code violations)?
- Is there a deadline driving the sale (1031 exchange, divorce, estate, relocation)? That informs how much negotiation room exists.
- Schools are B-rated — typically a magnet for longer-tenancy family renters. What's the average tenant stay here, and is there a school-zone premium baked into asking?
- Crime grade is D in this area — have there been break-ins, vandalism, or insurance claims at this property in the last 3 years? What carrier currently insures it and at what premium?
- The area grade is low — what's the realistic commute time and amenity access for the typical tenant pool here? Any planned neighborhood developments (good or bad) we should know about?
- What's the average days-on-market for RENTAL listings here right now (not sales)? A rising rental-DOM trend means longer vacancies and softer asking-rent achievability than the comps imply.
- What's the recent tenant-quality profile in this submarket — average credit score on applications, eviction rate, late-payment / NSF rate, and stable-employment percentage? A property-management company in the area should have these aggregated.
- How much new for-sale + rental construction is in the pipeline within 1–3 miles? Heavy new supply typically softens prices + rents 12–24 months out; constrained supply supports both.
Investment metrics
- 1% rule
- 0.77% ✗
- Cap rate
- 6.40%
- Cash-on-cash
- 0.39%
- DSCR
- 1.02
- GRM
- 10.9
CMA / ARV
- ARV (median comp)
- $205,095
- List price
- $164,900
- Delta
- -19.60%
- Verdict
- UNDERPRICED
- Comps
- 20 within 1.0 mi
Show comp detail 12 sales within ~0.75 mi
| Address | Dist | Beds/Ba | Sqft | Sold | Price | $/sf | Match |
|---|---|---|---|---|---|---|---|
| 408 Arnett Blvd | 0.14mi | 3/2.0 | 1,356 (+12%) | 10mo | $203,000 | $150 | 63 |
| 217 Arnett Blvd | 0.51mi | 3/2.0 | 1,272 (+5%) | 8mo | $180,000 | $142 | 59 |
| 223 Rocklawn Ave | 0.60mi | 4/1.0 (+1) | 1,176 (-3%) | 2mo | $148,900 | $127 | 59 |
| 312 White Rock Rd | 0.40mi | 3/2.0 | 1,344 (+11%) | 3mo | $115,000 | $86 | 58 |
| 180 Ficklen Ave | 0.71mi | 2/1.0 (-1) | 1,210 (+0%) | 4mo | $132,000 | $109 | 56 |
| 323 Hampton Dr | 0.60mi | 3/1.5 | 1,316 (+9%) | 6mo | $217,500 | $165 | 52 |
| 209 Rocklawn Ave | 0.64mi | 3/1.0 | 1,122 (-7%) | 6mo | $50,050 | $45 | 52 |
| 210 N Woodberry Ave | 0.57mi | 3/1.0 | 1,056 (-13%) | 0mo | $120,000 | $114 | 50 |
| 1467 Myrtle Ave | 0.71mi | 3/1.0 | 1,098 (-9%) | 3mo | $59,900 | $55 | 47 |
| 250 Jordan St St | 0.59mi | 2/1.5 (-1) | 1,093 (-10%) | 9mo | $129,900 | $119 | 44 |
| 121 Princess Dr | 0.60mi | 3/2.0 | 1,040 (-14%) | 9mo | $190,000 | $183 | 39 |
| 188 Hamlin Ave | 0.72mi | 3/1.0 | 1,048 (-13%) | 8mo | $127,000 | $121 | 35 |
Match score weights: distance 35% · size 25% · config 20% · recency 20%. Top-matched comps best support the ARV.
Projected returns pro-forma
-3.0% appreciation · 3.0% rent growth · sell at horizon
- IRR
- -18.1%
- Equity multiple
- 0.36×
- Total profit
- $-29,344
- Equity at exit
- $24,587
- IRR
- -10.4%
- Equity multiple
- 0.37×
- Total profit
- $-29,052
- Equity at exit
- $14,258
Cash invested: $46,172 (down + closing). Projections, not guarantees.
Landlord ↔ Tenant lean methodology
- Overall (STATE)
- 55 Moderately Landlord-Leaning
- State Virginia
- 55 Moderately Landlord-Leaning · D+2
- County
- — inherits STATE
- City
- — inherits STATE
ZIP-level market 24540
- Home prices YoY
- -20.0%
- Active inventory
- 211
- Price-to-rent
- 10.9×
Monthly cashflow live
- Estimated rent
- $1,262 medium interval (Pro) →
- Mortgage (P&I)
- −$865
- Tax from tax record
- −$48 /mo · $579/yr
- Insurance
- −$69
- Flood insurance flood zone
- −$56 /mo · $666/yr
- HOA
- −$0
- Vacancy / Maint / Mgmt
- −$265
- Net cashflow
- $-41
Break-even live
UW: 25.0% down · 7.5% · 30yr · 1.5% tax · 5.0% vac · 8.0% maint · 8.0% mgmt
Financing live
Cash to close
- Down payment
- $41,225
- Closing costs
- $4,947
- Reserves months
- —
- Total cash needed
- —
Loan-product check · same deal, 3 products live
Conventional
25% down · 7.5% · 30yr
- Down + closing
- —
- Monthly P&I
- —
- Monthly cashflow
- —
- DSCR
- —
- Eligible?
- —
Personal DTI + credit; lowest rate.
DSCR
20% down · 8.5% · 30yr
- Down + closing
- —
- Monthly P&I
- —
- Monthly cashflow
- —
- DSCR
- —
- Eligible?
- —
No personal income docs; deal must DSCR.
Hard money
10% down · 12.0% · 12mo
- Down + closing
- —
- Monthly P&I
- —
- Monthly cashflow
- —
- DSCR
- —
- Eligible?
- —
Short-term bridge; refi at stabilization.
Rent comps 4 comps
| Address | Beds | Baths | Sqft | Rent | $/sqft | DOM | Units | Dist |
|---|---|---|---|---|---|---|---|---|
| 134 Hartford St Danville, VA | 4.0 | 1.0 | 1325 | $1,350 | $1.02 | 43d | 1 | 0.28mi |
| 128 Lowell St Danville, VA | 3.0 | 1.0 | 918 | $1,050 | $1.14 | 43d | 1 | 0.28mi |
| 117 Ida St Danville, VA | 3.0 | 1.0 | 925 | $1,163 | $1.26 | 43d | 1 | 1.02mi |
| 1353 N Main St Apt 6 Danville, VA | 2.0 | 1.0 | 850 | $650 | $0.76 | 43d | 1 | 1.11mi |
Listing history 23 events
-
2026-06-19days on market $164,900 Active 332 DOM
-
2026-06-18days on market $164,900 Active 331 DOM
-
2026-06-17days on market $164,900 Active 330 DOM
-
2026-06-16days on market $164,900 Active 329 DOM
-
2026-06-15days on market $164,900 Active 328 DOM
-
2026-06-14days on market $164,900 Active 326 DOM
-
2026-06-13days on market $164,900 Active 325 DOM
-
2026-06-10days on market $164,900 Active 323 DOM
-
2026-06-09days on market $164,900 Active 322 DOM
-
2026-06-08days on market $164,900 Active 321 DOM
-
2026-06-07days on market $164,900 Active 320 DOM
-
2026-06-05days on market $164,900 Active 317 DOM
-
2026-06-02days on market $164,900 Active 315 DOM
-
2026-06-01days on market $164,900 Active 314 DOM
-
2026-05-31days on market $164,900 Active 313 DOM
-
2026-05-30days on market $164,900 Active 312 DOM
-
2026-04-08status Active 63-char remark
Show marketing remark (63 chars)
Great home in a great location. Nice floorplan for entertaining
-
2026-01-23status Active 317-char remark
Show marketing remark (317 chars)
Welcome to Starmont! This charming brick home offers 3 bedrooms 2.5 bathrooms with a spacious layout ready for your personal touch, perfect for anyone looking to update and make it their own. Whether you're a first-time home buyer or an investor, this home is a great opportunity to add value in a fantastic location.
-
2026-01-23price $164,900 317-char remark
Show marketing remark (317 chars)
Welcome to Starmont! This charming brick home offers 3 bedrooms 2.5 bathrooms with a spacious layout ready for your personal touch, perfect for anyone looking to update and make it their own. Whether you're a first-time home buyer or an investor, this home is a great opportunity to add value in a fantastic location.
-
2025-07-14$169,900 Active 317-char remark
Show marketing remark (317 chars)
Welcome to Starmont! This charming brick home offers 3 bedrooms 2.5 bathrooms with a spacious layout ready for your personal touch, perfect for anyone looking to update and make it their own. Whether you're a first-time home buyer or an investor, this home is a great opportunity to add value in a fantastic location.
-
2024-01-17status Active 63-char remark
Show marketing remark (63 chars)
Great home in a great location. Nice floorplan for entertaining
-
2024-01-17price $165,900 63-char remark
Show marketing remark (63 chars)
Great home in a great location. Nice floorplan for entertaining
-
2023-10-17$169,900 Active 63-char remark
Show marketing remark (63 chars)
Great home in a great location. Nice floorplan for entertaining
ⓘ Source: listings_history table (triggers on properties + properties_extension) + one-shot
backfill from property_details.listing_events for pre-trigger history.
Tax reassessment forecast VA · Resets to sale price
- Current annual tax
- $579 · $48/mo
- Projected year-2 tax
- $1,352 · $113/mo
- Expected delta
- +$774/yr (+$64/mo · 133.7%)
ⓘ Screening estimate from a state-policy table — verify with the county assessor before closing.
Climate risk First Street
- Flood 7/10 Severe FEMA zone X (unshaded) · 77% chance over 30 yrs
- Wildfire 3/10 Moderate
- Heat 6/10 Major 7 d/yr ≥105°F today · 18 d/yr by 30 yrs out
- Wind 4/10 Moderate 9% chance of damaging wind over 30 yrs
- Air quality 2/10 Low 0 unhealthy d/yr today · 1 by 30 yrs out
Nearby sold comps map
Loading sold comps map…
Walkable amenities ~0.75 mi
Loading nearby amenities…
Taxation est. · year 1
- Rental income
- $15,140
- − Mortgage interest
- −$9,237
- − Property taxes
- −$579
- − Insurance
- −$1,491
- − Repairs & maintenance
- −$1,211
- − Management
- −$1,211
- − Depreciation
- −$4,797
- Taxable loss
- −$3,386
- Est. tax savings @ 24.0%
- +$813
- After-tax cash flow
- $327/yr
For passive investors: Depreciation is non-cash, so a rental often shows a tax loss while cash-flowing — sheltering income. Rental losses are passive: they offset passive income freely, and up to $25,000/yr can offset ordinary (W-2) income if you actively participate and your MAGI is under $100k (phasing out to $0 by $150k); unused losses carry forward. On sale, claimed depreciation is recaptured at up to 25%, and gains may owe capital-gains tax (a 1031 exchange can defer both). Figures are a year-1 estimate at your 24.0% rate — not tax advice; consult a CPA.
Schools (NCES district)
- District
- Danville City Public School District
- NCES district ID
- 5101110
- Math proficiency
- 30% ▼ -22.00%
- Reading proficiency
- 44% ▼ -8.00%
- Median HH income
- $31,952
- Composite
- 30.23/100
- National rank
- #6298
- State rank
- #128 of 131 in VA
Livability — Danville
- Score
- 77/100
- State rank
- #91
- US rank
- #2952
Category grades
Schools grade is shown separately in the Schools card above.
Census & demographics
- Census place
- Danville, VA
- County
- Danville City · 59,055 people
- City population
- 59,055
- Metro
- Danville, VA
- Population (ZIP)
- 31,013
- Household income
- $47,924
- Rent vs Own
- Severe rent burden
- 1170.0
Population outlook (Danville County) Hauer SSP2
- Today (2025)
- 40,989 people
- By 2030
- 40,432 · -1.4%
- By 2040
- 39,255 · -4.2%
- By 2050
- 38,035 · -7.2%
- By 2075
- 35,612 · -13.1%
- By 2100
- 30,365 · -25.9%
Race, ethnicity, and origin ACS 2023
- Neighborhood character
- Diverse neighborhood (Simpson 0.57)
- Race & ethnicity
- White 50% Black 42% Two or more races 5% Hispanic / Latino 4%
- Common ancestry
- Slovak 1% Lithuanian 1% Serbian 1%
- Foreign-born
- 2% · Canada
- Languages at home
- 97% English-only · Spanish 2%
Political lean MEDSL · Danville
- 2024 margin
- Strong D (+21.1) · D 60.1% · R 39.0%
- 2008→2024 swing
- +1.9pp toward D · 2008: 19.1pp · 2024: 21.1pp
- All cycles
- 2024: D+21.1 2020: D+22.1 2016: D+19.9 2012: D+22.1 2008: D+19.1
Not yet ingested
- Civics
- —
Market trends
- HPI YoY
- ▼ -58.79%
- Current HPI
- 235.1746
- Rent YoY
- —
- Metro
- Danville, VA
- State GDP YoY
- ▲ 2.40%
- F500 in state
- 50
Industry mix (Fortune 500 HQ in VA)
| Industry | F500 HQs | Revenue |
|---|---|---|
| Aerospace / Defense | 4 | $236B |
|
||
| Technology / Defense | 3 | $32B |
|
||
| Financial Services | 2 | $176B |
|
||
| Utilities | 2 | $27B |
|
||
| Insurance | 2 | $25B |
|
||
| Technology | 2 | $15B |
|
||
Price history
-2.9% since first listed7 events — show timeline
- 2026-04-08 Relisted — DRRAR
- 2026-01-23 Relisted — DRRAR
- 2026-01-23 Price Changed $164,900 DRRAR
- 2025-07-14 Listed $169,900 DRRAR
- 2024-01-17 Relisted — DRRAR
- 2024-01-17 Price Changed $165,900 DRRAR
- 2023-10-17 Listed $169,900 DRRAR
Property tax history
+0.2%/yrLatest (2025): $579 · +0.0% YoY. Source: county tax records.
Cash-flow waterfall
monthlySold comps — $/sqft
last 12 mo · ≤1 miLoading sold comps…