23 Wildwood Ln · Greenvale, NY
Flood risk 1/10 · Minimal
- FEMA flood zone
- X (unshaded)
- Chance of flooding over 30 yrs
- 0.0%
- Est. flood insurance / yr
- $507 – $1,088
Fire risk 2/10 · Minimal
- Est. fire insurance / yr
- $691 – $1,283
Heat risk 6/10 · Moderate
- Hot days now (above 98°F)
- 7 days/yr
- Hot days in 30 yrs
- 16 days/yr
Wind risk 6/10 · Moderate
- Chance of severe wind over 30 yrs
- 63.0%
Air-quality risk 4/10 · Minor
- Unhealthy air days now
- 4 days/yr
- Unhealthy air days in 30 yrs
- 5 days/yr
Risk factors via First Street. Map © Google.
Why this score? — see what drove the C grade
The composite is a weighted blend of 9 inputs, each scored 0–100. Each bar is that input's sub-score; the figure is the points it added to the 100-point composite (weight × sub-score).
- Cash flow +16.4/30.0
- Schools +7.9/10.0
- Appreciation +7.7/10.0
- ARV discount +7.5/15.0
- DSCR +5.1/10.0
- 1% rule +4.0/10.0
- Livability +3.9/5.0
- Rent growth +2.5/5.0
- Condition / age +2.5/5.0
$2,399,000
🖨 Deal sheet 📄 Offer letter ✓ Due diligence
Listing remarks
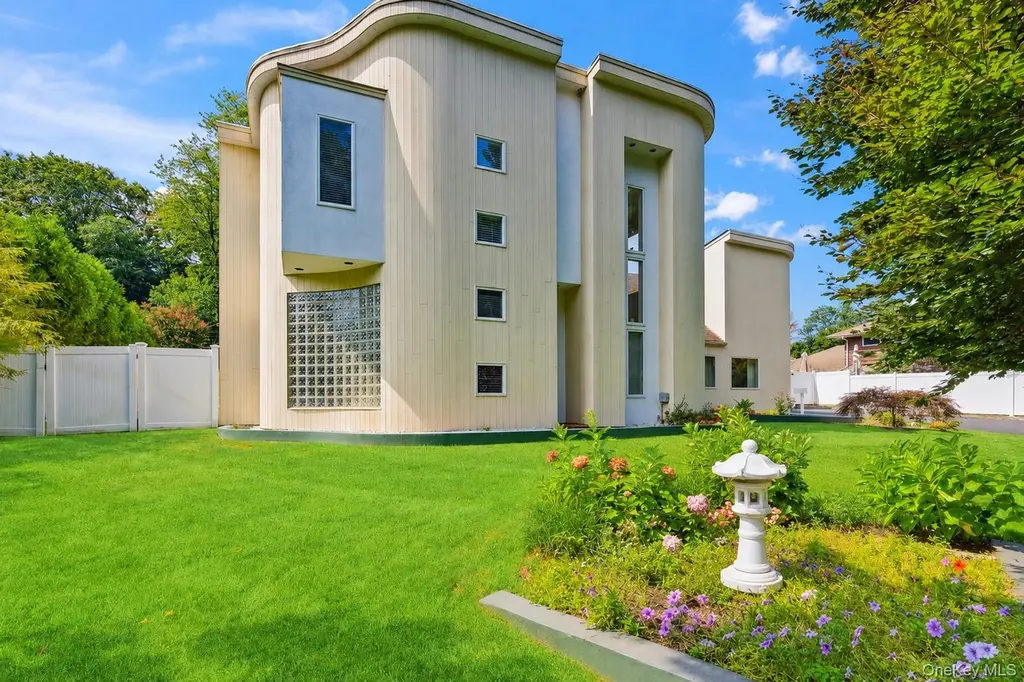
Welcome to 23 Wildwood Lane - an expansive modern contemporary located on a Old Brookville Street and set on . 60 flat usable acres. This spacious home includes 5 oversized bedrooms and 5 well-appointed baths, including two primary ensuites with one located on the main level. Designed with flexibility in mind, this layout is ideal for multi-generational living. A dramatic entry foyer features 20-ft. soaring ceilings and the elegant and timeless marble floors set the tone for the rest of this unique home. Multiple sun-filled living spaces, and an open floor plan are designed for both everyday living and hosting large gatherings. The meticulously constructed eat-in kitchen flows seamlessly in
Key facts
- 0.6 acre lot
- 2 garage spots
- Built 1950
Property features AI
Exterior
- Parking: Driveway; Garage; 2-car garage
- Utilities: Cesspool sewer; Cable available; Electricity available; Water connected
- Home design: Single family residence; Updated/remodeled
- Construction: Cedar exterior construction; Full attic
- Exterior features: Cedar construction; Full backyard fencing; Back yard fence; Not waterfront; Deck; Porch
Interior
- Kitchen: Convection oven; Cooktop; Electric cooktop; Electric oven; Electric range; Oven; Dishwasher; Disposal; Refrigerator; Stainless steel appliances; Kitchen island; Marble counters; Water purifier (owned); Breakfast bar; Eat-in kitchen; Open kitchen
- Bedrooms: Includes a bedroom on the first floor
- Flooring: Carpet; Tile; Wood
- Bathrooms: 4 full bathrooms; 1 half bathroom
- Heating & cooling: Oil heating; Central air conditioning
- Interior features: First-floor bedroom; Breakfast bar; Cathedral ceilings; Double vanity; Eat-in kitchen; Entrance foyer; Formal dining room; High ceilings; His and hers closets; In-law floorplan; Kitchen island; Marble counters; Open floorplan; Open kitchen; Primary bathroom; Master on main level; Recessed lighting; Soaking tub; Storage; Walk-through kitchen; Walk-in closets; Oversized windows; Skylights; Deck; Porch
- Laundry & utility: Washer; Dryer; Electric water heater; Tankless water heater; Indirect water heater
Neighborhood map
What this means for you Summary
Snapshot
- This is a 5-bed/4.5-bath single-family listed at $2.40M.
Deal economics
- At list price, monthly cash flow is $1k ($16k/yr) — positive.
- The deal already cash-flows at list — no discount required.
- To meet the 1% rule (rent ≥ 1% of price), the offer needs to be $2.15M (10.4% below list).
- Recommended offer: $2.15M (10.4% below list) — sets the bar for 1% rule.
Location & tenants
- Location reads 77/100 on livability (#204 in NY, #3,174 nationally) — a middle-class / working-renter tenant base. Strengths: crime A+, commute A+, employment A+; Watch: cost of living F, health & safety F.
- North Shore Central School District (suburban): math 88% / reading 84% proficiency, ranked #24 of 590 in NY (top 4%) — strong family-tenant draw, lease renewals of 3-5y typical; only 5% free/reduced lunch — higher-income household profile.
- Zoned schools: Glen Head Elementary School (math 82% / reading 82%, grade A+, #138 of 2,108 statewide, top 8%, 371 students, 0% FRL) — zoned schools at 0% FRL track the district average.
- Market conditions: 10 active listings in the ZIP; 1 comparable units currently listed for rent nearby; 824 units permitted in Nassau County in 2024 (153 in 5+ unit buildings).
Forward outlook
- In year one you build about $147k of equity ($17k loan paydown + $130k appreciation (5.4% local appreciation)).
- Nassau County population projected at +7% by 2050 — modest demand growth; plan on rents tracking national, not racing it.
- At projected returns (5.4% appreciation + 3.0% rent growth), your $672k cash investment doubles in ~4 years — after that, you're playing with house money.
- By year 2, paydown + projected appreciation supports a ~$235k cash-out refi (75% LTV) — recoverable capital for the next deal without selling this one.
Negotiation context
- It's been on market 21 days — a 2% lower offer ($2.36M) is reasonable based on typical stale-listing flexibility.
- Current owner paid $995k; list at $2.40M implies a 141% gain — meaningful room to come down on a strong offer.
Risks & watch-outs
- Watch-outs: built in 1950 — expect roof / HVAC / electrical / plumbing capex.
- Climate carrying-cost: major wind risk, 63% chance of damaging wind over 30y; extreme-heat days projected 7→16/yr by 2055 (HVAC capex compounding) — expect insurance premiums to compound above CPI over the hold.
Questions for the listing agent
- Built in 1950 — when were the roof, HVAC, electrical panel, plumbing, and water heater last replaced?
- Is there a deadline driving the sale (1031 exchange, divorce, estate, relocation)? That informs how much negotiation room exists.
- Schools are A-rated — typically a magnet for longer-tenancy family renters. What's the average tenant stay here, and is there a school-zone premium baked into asking?
- What's the average days-on-market for RENTAL listings here right now (not sales)? A rising rental-DOM trend means longer vacancies and softer asking-rent achievability than the comps imply.
- What's the recent tenant-quality profile in this submarket — average credit score on applications, eviction rate, late-payment / NSF rate, and stable-employment percentage? A property-management company in the area should have these aggregated.
- How much new for-sale + rental construction is in the pipeline within 1–3 miles? Heavy new supply typically softens prices + rents 12–24 months out; constrained supply supports both.
Investment metrics
- 1% rule
- 0.90% ✗
- Cap rate
- 6.97%
- Cash-on-cash
- 2.43%
- DSCR
- 1.11
- GRM
- 9.3
CMA / ARV
- ARV (on-the-fly)
- $2,398,838
- Comps found
- 7
Show comp detail 7 sales within ~0.75 mi
| Address | Dist | Beds/Ba | Sqft | Sold | Price | $/sf | Match |
|---|---|---|---|---|---|---|---|
| 27 Addison Ln | 0.11mi | 5/5.0 | 4,610 (-1%) | 11mo | $1,800,000 | $390 | 82 |
| 74 Woods Dr | 0.51mi | 5/4.5 | 4,466 (-4%) | 4mo | $2,180,000 | $488 | 66 |
| 16 Flamingo Rd N | 0.45mi | 5/3.5 | 4,318 (-8%) | 12mo | $2,487,500 | $576 | 53 |
| 15 Flamingo Rd | 0.69mi | 5/3.5 | 4,464 (-4%) | 5mo | $2,725,000 | $610 | 53 |
| 100 Glen Cove Rd | 0.21mi | 6/3.0 (+1) | 3,992 (-14%) | 10mo | $1,400,000 | $351 | 47 |
| 19 Peacock Dr | 0.70mi | 5/4.0 | 4,829 (+4%) | 19mo | $2,483,500 | $514 | 44 |
| 58 Woods Dr | 0.56mi | 6/4.5 (+1) | 4,000 (-14%) | 23mo | $2,750,000 | $688 | 26 |
Match score weights: distance 35% · size 25% · config 20% · recency 20%. Top-matched comps best support the ARV.
Projected returns pro-forma
5.43% appreciation · 3.0% rent growth · sell at horizon
- IRR
- 16.0%
- Equity multiple
- 2.04×
- Total profit
- $698,812
- Equity at exit
- $1,422,783
- IRR
- 16.2%
- Equity multiple
- 3.99×
- Total profit
- $2,011,183
- Equity at exit
- $2,509,535
Cash invested: $671,720 (down + closing). Projections, not guarantees.
Landlord ↔ Tenant lean methodology
- Overall (STATE)
- 15 Strongly Tenant-Friendly
- State New York
- 15 Strongly Tenant-Friendly · D+10
- County
- — inherits STATE
- City
- — inherits STATE
ZIP-level market 11548
- Home prices YoY
- 2.0%
- Active inventory
- 10
- Price-to-rent
- 9.3×
Monthly cashflow live
- Estimated rent
- $21,500 medium interval (Pro) →
- Mortgage (P&I)
- −$12,581
- Tax from tax record
- −$2,045 /mo · $24,534/yr
- Insurance
- −$1,000
- HOA
- −$0
- Vacancy / Maint / Mgmt
- −$4,515
- Net cashflow
- $1,360
Break-even live
UW: 25.0% down · 7.5% · 30yr · 1.5% tax · 5.0% vac · 8.0% maint · 8.0% mgmt
Financing live
Cash to close
- Down payment
- $599,750
- Closing costs
- $71,970
- Reserves months
- —
- Total cash needed
- —
Loan-product check · same deal, 3 products live
Conventional
25% down · 7.5% · 30yr
- Down + closing
- —
- Monthly P&I
- —
- Monthly cashflow
- —
- DSCR
- —
- Eligible?
- —
Personal DTI + credit; lowest rate.
DSCR
20% down · 8.5% · 30yr
- Down + closing
- —
- Monthly P&I
- —
- Monthly cashflow
- —
- DSCR
- —
- Eligible?
- —
No personal income docs; deal must DSCR.
Hard money
10% down · 12.0% · 12mo
- Down + closing
- —
- Monthly P&I
- —
- Monthly cashflow
- —
- DSCR
- —
- Eligible?
- —
Short-term bridge; refi at stabilization.
Rent comps 1 comps
| Address | Beds | Baths | Sqft | Rent | $/sqft | DOM | Units | Dist |
|---|---|---|---|---|---|---|---|---|
| 8 Plaka Ct Glen Head, NY | 6.0 | 6.0 | 5100 | $21,500 | $4.22 | 1d | 1 | 1.23mi |
Listing history 14 events
-
2026-06-18days on market $2,399,000 Active 21 DOM
-
2026-06-17days on market $2,399,000 Active 20 DOM
-
2026-06-16days on market $2,399,000 Active 19 DOM
-
2026-06-15days on market $2,399,000 Active 18 DOM
-
2026-06-13days on market $2,399,000 Active 16 DOM
-
2026-06-13days on market $2,399,000 Active 15 DOM
-
2026-06-09days on market $2,399,000 Active 12 DOM
-
2026-06-08days on market $2,399,000 Active 11 DOM
-
2026-06-07days on market $2,399,000 Active 10 DOM
-
2026-06-04days on market $2,399,000 Active 7 DOM
-
2026-06-03days on market $2,399,000 Active 6 DOM
-
2026-06-02days on market $2,399,000 Active 5 DOM
-
2026-06-01days on market $2,399,000 Active 4 DOM
-
2026-05-31days on market $2,399,000 Active 3 DOM
ⓘ Source: listings_history table (triggers on properties + properties_extension) + one-shot
backfill from property_details.listing_events for pre-trigger history.
Tax reassessment forecast NY · Partial reset (capped growth)
- Current annual tax
- $24,534 · $2,045/mo
- Projected year-2 tax
- $32,539 · $2,712/mo
- Expected delta
- +$8,004/yr (+$667/mo · 32.6%)
ⓘ Screening estimate from a state-policy table — verify with the county assessor before closing.
Climate risk First Street
- Flood 1/10 Low FEMA zone X (unshaded) · 0% chance over 30 yrs
- Wildfire 2/10 Low
- Heat 6/10 Major 7 d/yr ≥98°F today · 16 d/yr by 30 yrs out
- Wind 6/10 Major 63% chance of damaging wind over 30 yrs
- Air quality 4/10 Moderate 4 unhealthy d/yr today · 5 by 30 yrs out
Nearby sold comps map
Loading sold comps map…
Walkable amenities ~0.75 mi
Loading nearby amenities…
Taxation est. · year 1
- Rental income
- $258,000
- − Mortgage interest
- −$134,381
- − Property taxes
- −$24,534
- − Insurance
- −$11,995
- − Repairs & maintenance
- −$20,640
- − Management
- −$20,640
- − Depreciation
- −$69,789
- Taxable loss
- −$23,980
- Est. tax savings @ 24.0%
- +$5,755
- After-tax cash flow
- $22,078/yr
For passive investors: Depreciation is non-cash, so a rental often shows a tax loss while cash-flowing — sheltering income. Rental losses are passive: they offset passive income freely, and up to $25,000/yr can offset ordinary (W-2) income if you actively participate and your MAGI is under $100k (phasing out to $0 by $150k); unused losses carry forward. On sale, claimed depreciation is recaptured at up to 25%, and gains may owe capital-gains tax (a 1031 exchange can defer both). Figures are a year-1 estimate at your 24.0% rate — not tax advice; consult a CPA.
Schools (NCES district)
- District
- North Shore Central School District
- NCES district ID
- 3626370
- Math proficiency
- 88% ▼ -3.00%
- Reading proficiency
- 84% ▼ -2.00%
- Median HH income
- $113,973
- Composite
- 78.77/100
- National rank
- #69
- State rank
- #24 of 590 in NY
Livability — Greenvale
- Score
- 77/100
- State rank
- #204
- US rank
- #3174
Category grades
Schools grade is shown separately in the Schools card above.
Census & demographics
- Census place
- Greenvale, NY
- Population (ZIP)
- 2,171
Population outlook (Nassau County) Hauer SSP2
- Today (2025)
- 1,409,302 people
- By 2030
- 1,431,482 · +1.6%
- By 2040
- 1,471,607 · +4.4%
- By 2050
- 1,502,845 · +6.6%
- By 2075
- 1,575,403 · +11.8%
- By 2100
- 1,554,356 · +10.3%
Race, ethnicity, and origin ACS 2023
- Neighborhood character
- Predominantly White (71%)
- Race & ethnicity
- White 71% Asian 17% Hispanic / Latino 5% Black 5% Two or more races 3%
- Common ancestry
- Scotch-Irish 5% Romanian 3% Subsaharan African 1%
- Foreign-born
- 36% · China, Canada, South Korea
- Languages at home
- 66% English-only · Chinese 11% Other Indo-European 9% Russian/Polish/Slavic 5%
Political lean MEDSL · Nassau
- 2024 margin
- Toss-up / Even · D 47.9% · R 52.1%
- 2008→2024 swing
- -12.6pp toward R · 2008: 8.4pp · 2024: -4.2pp
- All cycles
- 2024: R+4.2 2020: D+9.5 2016: D+5.3 2012: D+6.7 2008: D+8.4
Not yet ingested
- Civics
- —
Market trends
- HPI YoY
- ▲ 5.43%
- Current HPI
- 273.4132
- Rent YoY
- —
- Metro
- —
- State GDP YoY
- ▲ 2.60%
- F500 in state
- 92
Industry mix (Fortune 500 HQ in NY)
| Industry | F500 HQs | Revenue |
|---|---|---|
| Financial Services | 10 | $950B |
|
||
| Consumer Goods | 9 | $162B |
|
||
| Insurance | 4 | $225B |
|
||
| Telecommunications | 2 | $144B |
|
||
| Pharmaceuticals | 2 | $112B |
|
||
| Media / Entertainment | 2 | $69B |
|
||
Price history
+399.8% since first listed5 events — show timeline
- 2026-05-29 Listed $2,399,000 OneKey® MLS as Distributed by MLS Grid
- 2026-05-28 Coming Soon $2,399,000 OneKey® MLS as Distributed by MLS Grid
- 2003-10-03 Sold (Public Records) $995,000 Public Records
- 1996-11-20 Sold (Public Records) $690,000 Public Records
- 1986-10-15 Sold (Public Records) $480,000 Public Records
Property tax history
+2.1%/yrLatest (2024): $24,534 · +0.8% YoY. Source: county tax records.
Cash-flow waterfall
monthlySold comps — $/sqft
last 12 mo · ≤1 miLoading sold comps…