 Triplex
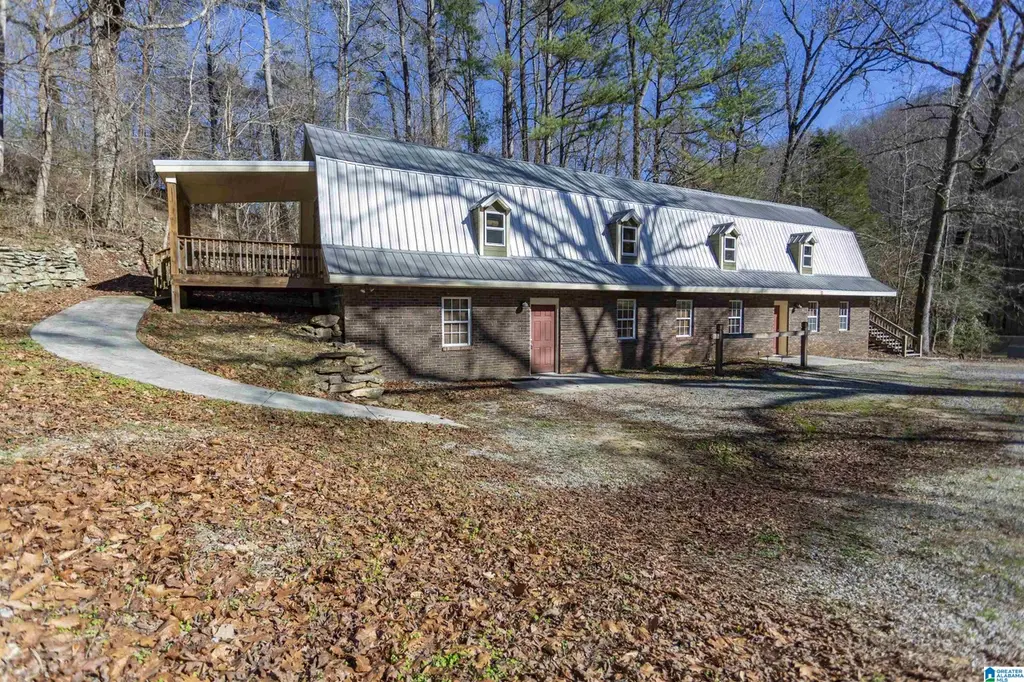
110 Clay Dr · Hayden, AL
Flood risk 8/10 · Major
- FEMA flood zone
- X (unshaded)
- Chance of flooding over 30 yrs
- 0.78%
- Est. flood insurance / yr
- $507 – $1,088
Fire risk 4/10 · Minor
- Est. fire insurance / yr
- $916 – $1,700
Heat risk 5/10 · Moderate
- Hot days now (above 105°F)
- 7 days/yr
- Hot days in 30 yrs
- 18 days/yr
Wind risk 5/10 · Moderate
- Chance of severe wind over 30 yrs
- 25.0%
Air-quality risk 3/10 · Minor
- Unhealthy air days now
- 2 days/yr
- Unhealthy air days in 30 yrs
- 3 days/yr
Risk factors via First Street. Map © Google.
Why this score? — see what drove the B- grade
The composite is a weighted blend of 9 inputs, each scored 0–100. Each bar is that input's sub-score; the figure is the points it added to the 100-point composite (weight × sub-score).
- Cash flow +29.9/30.0
- DSCR +10.0/10.0
- ARV discount +7.5/15.0
- 1% rule +7.3/10.0
- Livability +3.2/5.0
- Schools +2.8/10.0
- Rent growth +2.5/5.0
- Condition / age +2.5/5.0
- Appreciation +0.0/10.0
$350,000
🖨 Deal sheet 📄 Offer letter ✓ Due diligence
Multi-family units
County records classify this as Multi-Family (5+ Unit). Listing-text estimate: 3 units. estimate disagrees with records
5+ unit building — per-unit beds/baths from public records are typically unavailable; the breakdown below (if shown) is an estimate from the listing text.
Listing remarks MLS
Tucked in the woods, this unique 3060 sq ft triplex offers the rare charm of a Gatlinburg-style retreat paired with solid income potential for investors. Surrounded by 2 acres of natural beauty and a rich local history, the property provides a peaceful cabin-like atmosphere while remaining convenient to Cullman & Bham. The upper level unit features a 2 bed/1 bath layout with spacious living spaces. On the lower level, you'll find 2 separate living spaces- a well designed studio apartment (complete w a living room, kitchen, bathroom, & laundry), as well as a 1 bed bed/1 bath apartment- both offering comfortable, private living. All units are currently rented, providing immediate cash flow. The property includes ample outdoor space, presenting potential for future developments. This is a solid opportunity for investors seeking a fully leased multifamily property with stable income and future upside. Don't let this one slip away! (Please allow 48 hour notice for showings. )
Key facts
- Ample outdoor space
- 2 acre lot
- Built 1989
Tags
Neighborhood map
What this means for you Summary
Snapshot
- This is a 3 × 4-bed/1.0-bath units multifamily listed at $350k.
Deal economics
- At list price, monthly cash flow is $1k ($15k/yr) — positive. Per door: $409/mo.
- The deal already cash-flows at list — no discount required.
- Meets the 1% rule at list price ($4k rent vs $350k).
- Recommended offer: $308k (12.0% below list) — sets the bar for market timing.
- Cap rate 10.7% vs local median 4.2% in Hayden — top-decile yield for the area; either an underpriced asset or a hidden risk that comps aren't pricing in. Stress-test before assuming the spread holds.
Location & tenants
- Location reads 65/100 on livability (#137 in AL) — a middle-class / working-renter tenant base. Strengths: cost of living A+, housing A+, crime A-; Watch: schools D+, amenities F, commute F.
- Blount County (rural): math 20% / reading 45% proficiency, ranked #54 of 129 in AL (top 42%) — families likely to look elsewhere, expect single-tenant / working-renter base with shorter leases.
- Market conditions: 54 active listings in the ZIP; 13 units permitted in Blount County in 2024 (0 in 5+ unit buildings).
Forward outlook
- Local home prices are declining (-3.0%/yr); year-one equity from $2k of loan paydown is wiped out by about $10k of value loss. Plan a longer hold.
- Blount County population projected to shrink 8% by 2050 — rents likely to lag national; underwrite the cash flow, not the appreciation.
- At projected returns (-3.0% appreciation + 3.0% rent growth), your $98k cash investment doubles in ~8 years — after that, you're playing with house money.
Negotiation context
- It's been on market 138 days — a 12% lower offer ($308k) is reasonable based on typical stale-listing flexibility.
- 5 sale attempts since 6y ago with the ask held roughly flat each time — persistent listings suggest the price (not the market) is what's stuck; bring a comps-based counter.
- Current owner paid $190k; list at $350k implies a 84% gain — meaningful room to come down on a strong offer.
Risks & watch-outs
- Watch-outs: flood insurance adds $66/mo.
- Climate carrying-cost: severe flood risk; moderate wind risk, 25% chance of damaging wind over 30y; extreme-heat days projected 7→18/yr by 2055 (HVAC capex compounding) — expect insurance premiums to compound above CPI over the hold.
Questions for the listing agent
- It's been on market 138 days. Have you received any prior offers? Is the seller open to a 12% concession, seller financing, or rate buy-down credit?
- Can we see the unit-by-unit rent roll, current vacancy, and any below-market leases? What's the average tenancy length?
- What capital expenditures (roof, boiler, parking lot, exteriors) have been made in the last 5 years, and what's planned in the next 2?
- What's the actual annual flood-insurance premium (NFIP or private), and is the property in a SFHA with mandatory coverage?
- Why hasn't it sold? Are there any deal-killer items the seller is aware of (foundation, flood, title, zoning, code violations)?
- Is there a deadline driving the sale (1031 exchange, divorce, estate, relocation)? That informs how much negotiation room exists.
- Schools are D-rated, which usually means shorter tenancies and higher turnover. Who's the typical renter profile here, and what's been the actual vacancy rate?
- What's the average days-on-market for RENTAL listings here right now (not sales)? A rising rental-DOM trend means longer vacancies and softer asking-rent achievability than the comps imply.
- What's the recent tenant-quality profile in this submarket — average credit score on applications, eviction rate, late-payment / NSF rate, and stable-employment percentage? A property-management company in the area should have these aggregated.
- How much new apartment / multifamily construction is in the pipeline within 1–3 miles? Heavy new supply (>2% of stock underway) typically softens rents 12–24 months out; light construction supports rent growth.
Investment metrics
- 1% rule
- 1.23% ✓
- Cap rate
- 10.72%
- Cash-on-cash
- 15.83%
- DSCR
- 1.70
- GRM
- 6.8
CMA / ARV
No comps found within radius.
Projected returns pro-forma
-3.0% appreciation · 3.0% rent growth · sell at horizon
- IRR
- 5.6%
- Equity multiple
- 1.22×
- Total profit
- $21,292
- Equity at exit
- $52,186
- IRR
- 15.0%
- Equity multiple
- 2.21×
- Total profit
- $118,765
- Equity at exit
- $30,262
Cash invested: $98,000 (down + closing). Projections, not guarantees.
Landlord ↔ Tenant lean methodology
- Overall (STATE)
- 90 Strongly Landlord-Friendly
- State Alabama
- 90 Strongly Landlord-Friendly · R+15
- County
- — inherits STATE
- City
- — inherits STATE
ZIP-level market 35079
- Home prices YoY
- -12.4%
- Active inventory
- 54
- Price-to-rent
- 20.3×
Monthly cashflow live
- Estimated rent
- $4,314 medium interval (Pro) →
- Mortgage (P&I)
- −$1,835
- Tax from tax record
- −$134 /mo · $1,611/yr
- Insurance
- −$146
- Flood insurance flood zone
- −$66 /mo · $798/yr
- HOA
- −$0
- Vacancy / Maint / Mgmt
- −$906
- Net cashflow
- $1,226
Break-even live
3-unit breakdown (identical units grouped — click to expand)
| Units | Beds | Baths | Est. rent |
|---|---|---|---|
| 3× units | 4 | 1 | $4,314 |
| #1 | 4 | 1 | $1,438 |
| #2 | 4 | 1 | $1,438 |
| #3 | 4 | 1 | $1,438 |
| Total (3 units) | $4,314 | ||
UW: 25.0% down · 7.5% · 30yr · 1.5% tax · 5.0% vac · 8.0% maint · 8.0% mgmt
Financing live
Cash to close
- Down payment
- $87,500
- Closing costs
- $10,500
- Reserves months
- —
- Total cash needed
- —
Loan-product check · same deal, 3 products live
Conventional
25% down · 7.5% · 30yr
- Down + closing
- —
- Monthly P&I
- —
- Monthly cashflow
- —
- DSCR
- —
- Eligible?
- —
Personal DTI + credit; lowest rate.
DSCR
20% down · 8.5% · 30yr
- Down + closing
- —
- Monthly P&I
- —
- Monthly cashflow
- —
- DSCR
- —
- Eligible?
- —
No personal income docs; deal must DSCR.
Hard money
10% down · 12.0% · 12mo
- Down + closing
- —
- Monthly P&I
- —
- Monthly cashflow
- —
- DSCR
- —
- Eligible?
- —
Short-term bridge; refi at stabilization.
Listing history 22 events
-
2026-06-05days on market $350,000 Active 138 DOM
-
2026-06-03days on market $350,000 Active 137 DOM
-
2026-06-02days on market $350,000 Active 136 DOM
-
2026-06-01days on market $350,000 Active 135 DOM
-
2026-05-31days on market $350,000 Active 134 DOM
-
2026-01-17$350,000 Active 996-char remark
Show marketing remark (996 chars)
Tucked in the woods, this unique 3060 sq ft triplex offers the rare charm of a Gatlinburg-style retreat paired with solid income potential for investors. Surrounded by 2 acres of natural beauty and a rich local history, the property provides a peaceful cabin-like atmosphere while remaining convenient to Cullman & Bham. The upper level unit features a 2 bed/1 bath layout with spacious living spaces. On the lower level, you'll find 2 separate living spaces- a well designed studio apartment (complete w a living room, kitchen, bathroom, & laundry), as well as a 1 bed bed/1 bath apartment- both offering comfortable, private living. All units are currently rented, providing immediate cash flow. The property includes ample outdoor space, presenting potential for future developments. This is a solid opportunity for investors seeking a fully leased multifamily property with stable income and future upside. Don't let this one slip away! (Please allow 48 hour notice for showings. )
-
2024-01-09price $325,000
-
2023-11-17price $349,000
-
2021-08-27soldstatus $189,900
-
2021-08-24soldstatus $189,900 Sold
-
2021-08-18historical
-
2021-07-21historical Contingent
-
2021-07-01historical
-
2021-04-03historical Contingent
-
2021-03-08status Active
-
2021-02-11historical Contingent
-
2021-02-11price $189,900
-
2021-02-10status Active
-
2020-11-25historical Contingent
-
2020-09-30status Active
-
2020-08-12historical Contingent
-
2020-07-23$200,000 Active
ⓘ Source: listings_history table (triggers on properties + properties_extension) + one-shot
backfill from property_details.listing_events for pre-trigger history.
Tax reassessment forecast AL · Resets to sale price
- Current annual tax
- $1,611 · $134/mo
- Projected year-2 tax
- $1,611 · $134/mo
- Expected delta
- $0/yr ($0/mo · -0.0%)
ⓘ Screening estimate from a state-policy table — verify with the county assessor before closing.
Climate risk First Street
- Flood 8/10 Severe FEMA zone X (unshaded) · 78% chance over 30 yrs
- Wildfire 4/10 Moderate
- Heat 5/10 Major 7 d/yr ≥105°F today · 18 d/yr by 30 yrs out
- Wind 5/10 Major 25% chance of damaging wind over 30 yrs
- Air quality 3/10 Moderate 2 unhealthy d/yr today · 3 by 30 yrs out
Nearby sold comps map
Loading sold comps map…
Walkable amenities ~0.75 mi
Loading nearby amenities…
Taxation est. · year 1
- Rental income
- $51,768
- − Mortgage interest
- −$19,605
- − Property taxes
- −$1,611
- − Insurance
- −$2,548
- − Repairs & maintenance
- −$4,141
- − Management
- −$4,141
- − Depreciation
- −$10,182
- Taxable income
- $9,539
- Est. tax owed @ 24.0%
- −$2,289
- After-tax cash flow
- $12,423/yr
For passive investors: Depreciation is non-cash, so a rental often shows a tax loss while cash-flowing — sheltering income. Rental losses are passive: they offset passive income freely, and up to $25,000/yr can offset ordinary (W-2) income if you actively participate and your MAGI is under $100k (phasing out to $0 by $150k); unused losses carry forward. On sale, claimed depreciation is recaptured at up to 25%, and gains may owe capital-gains tax (a 1031 exchange can defer both). Figures are a year-1 estimate at your 24.0% rate — not tax advice; consult a CPA.
Schools (NCES district)
- District
- Blount County
- NCES district ID
- 0100420
- Math proficiency
- 20% ▼ -25.00%
- Reading proficiency
- 45% ▼ -1.00%
- Median HH income
- $45,961
- Composite
- 27.79/100
- National rank
- #6891
- State rank
- #54 of 129 in AL
Livability — Hayden
- Score
- 65/100
- State rank
- #137
- US rank
- #13359
Category grades
Schools grade is shown separately in the Schools card above.
Census & demographics
- Population (ZIP)
- 9,388
Population outlook (Blount County) Hauer SSP2
- Today (2025)
- 57,983 people
- By 2030
- 57,405 · -1.0%
- By 2040
- 55,602 · -4.1%
- By 2050
- 53,393 · -7.9%
- By 2075
- 48,248 · -16.8%
- By 2100
- 44,190 · -23.8%
Race, ethnicity, and origin ACS 2023
- Neighborhood character
- Predominantly White (93%)
- Race & ethnicity
- White 93% Two or more races 3% Hispanic / Latino 2% Black 2%
- Common ancestry
- Slovak 2% Italian 1% Serbian 1%
- Foreign-born
- 1% · Canada
- Languages at home
- 98% English-only · Spanish 1% Other Indo-European 1%
Political lean MEDSL · Blount
- 2024 margin
- Solid R (+81.0) · D 9.2% · R 90.2%
- 2008→2024 swing
- -11.5pp toward R · 2008: -69.5pp · 2024: -81.0pp
- All cycles
- 2024: R+81.0 2020: R+80.0 2016: R+81.4 2012: R+74.1 2008: R+69.5
Not yet ingested
- Civics
- —
Market trends
- HPI YoY
- ▼ -36.00%
- Current HPI
- 255.3136
- Rent YoY
- —
- Metro
- —
- State GDP YoY
- ▲ 2.94%
- F500 in state
- 4
Industry mix (Fortune 500 HQ in AL)
| Industry | F500 HQs | Revenue |
|---|---|---|
| Financial Services | 1 | $8B |
|
||
| Healthcare | 1 | $5B |
|
||
Price history
+75.0% since first listed17 events — show timeline
- 2026-01-17 Listed $350,000 Greater Alabama MLS
- 2024-01-09 Price Changed $325,000 Greater Alabama MLS
- 2023-11-17 Price Changed $349,000 Greater Alabama MLS
- 2021-08-27 Sold (Public Records) $189,900 Public Records
- 2021-08-24 Sold (MLS) $189,900 Greater Alabama MLS
- 2021-08-18 Delisted — Greater Alabama MLS
- 2021-07-21 Contingent — Greater Alabama MLS
- 2021-07-01 Delisted — Greater Alabama MLS
- 2021-04-03 Contingent — Greater Alabama MLS
- 2021-03-08 Relisted — Greater Alabama MLS
- 2021-02-11 Contingent — Greater Alabama MLS
- 2021-02-11 Price Changed $189,900 Greater Alabama MLS
- 2021-02-10 Relisted — Greater Alabama MLS
- 2020-11-25 Contingent — Greater Alabama MLS
- 2020-09-30 Relisted — Greater Alabama MLS
- 2020-08-12 Contingent — Greater Alabama MLS
- 2020-07-23 Listed $200,000 Greater Alabama MLS
Property tax history
+6.5%/yrLatest (2025): $1,611 · +4.2% YoY. Source: county tax records.
Cash-flow waterfall
monthlySold comps — $/sqft
last 12 mo · ≤1 miLoading sold comps…