6 Cedar Ln · Winchester, NH
Flood risk No data
- FEMA flood zone
- —
- Chance of flooding over 30 yrs
- —
- Est. flood insurance / yr
- —
Fire risk No data
- Est. fire insurance / yr
- —
Heat risk No data
- Hot days now (above threshold)
- —
- Hot days in 30 yrs
- —
Wind risk No data
- Chance of severe wind over 30 yrs
- —
Air-quality risk No data
- Unhealthy air days now
- —
- Unhealthy air days in 30 yrs
- —
Risk factors via First Street. Map © Google.
Why this score? — see what drove the B+ grade
The composite is a weighted blend of 9 inputs, each scored 0–100. Each bar is that input's sub-score; the figure is the points it added to the 100-point composite (weight × sub-score).
- Cash flow +25.4/30.0
- ARV discount +15.0/15.0
- Appreciation +10.0/10.0
- 1% rule +8.9/10.0
- DSCR +8.4/10.0
- Livability +2.9/5.0
- Schools +2.6/10.0
- Rent growth +2.5/5.0
- Condition / age +2.5/5.0
$114,900
🖨 Deal sheet 📄 Offer letter ✓ Due diligence
Listing remarks
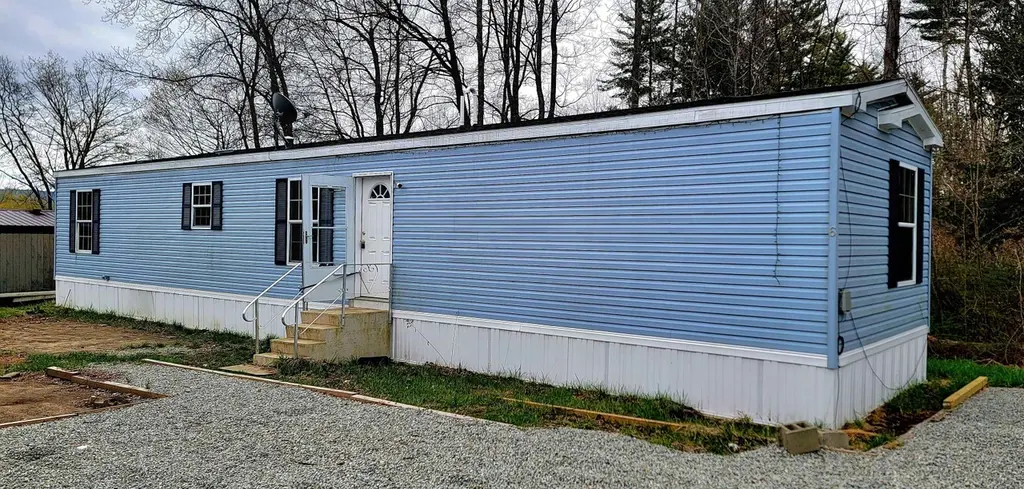
Set on a hilltop in the Elm St Co-Op, this 3BR, 2BA manufactured home sits at the end of the lane and is flanked by several trees providing a nice country feel. The open concept kitchen/living space provides plenty of room for relaxing or entertaining. Just minutes from the Ashuelot river, Pisgah State Park, quaint downtown area, and close proximity to Massachusetts and Vermont, the location of this property is great for outdoor enthusiasts and commuters alike. The monthly association fee covers road maintenance and monthly lot fee. Property owner responsible for water/sewer bill. Park approval required. Property being sold AS IS. * * Come check it out at the OPEN HOUSE on Sunday, May 17th
Key facts
- Built 2022
- Listed 17 days
Tags
Property features AI
Finance
- Financial info: Property is foreclosed/bank-owned/REO
- HOA & community: Monthly park/community fee of $240 covering park rent, plowing, and other services
Exterior
- Utilities: Public water; Public sewer; 100 Amp electric service with circuit breakers; Internet availability unknown; Other utilities (unspecified)
- Home design: Manufactured/Mobile home; Existing structure; Facing information not provided
- Construction: Built in 2022; Vinyl siding; Asphalt shingle roof
- Exterior features: Country setting; Near shopping; Gravel driveway; Located in Elm St Co-Op mobile park (park-approved)
Interior
- Bathrooms: 2 full bathrooms
- Heating & cooling: Natural gas forced air heating
- Interior features: 5 total rooms
Neighborhood map
What this means for you Summary
Snapshot
- This is a 3-bed/2.0-bath manufactured listed at $115k.
Deal economics
- At list price, monthly cash flow is $264 ($3k/yr) — positive.
- The deal already cash-flows at list — no discount required.
- Meets the 1% rule at list price ($2k rent vs $115k).
- Recommended offer: $113k (1.5% below list) — sets the bar for market timing.
Location & tenants
- Location reads 57/100 on livability (#92 in NH) — a working-class tenant base; expect higher turnover. Strengths: cost of living A+, housing A; Watch: crime C-, health & safety D, schools F.
- Winchester School District (rural): math 20% / reading 33% proficiency, ranked #162 of 171 in NH (top 95%) — low school quality limits family demand, transient renter base, plan for 1-2y turnover.
- Market conditions: 43 active listings in the ZIP; 166 units permitted in Cheshire County in 2024 (0 in 5+ unit buildings).
Forward outlook
- In year one you build about $12k of equity ($794 loan paydown + $11k appreciation (10.0% local appreciation)).
- Cheshire County population projected at -18% by 2050 — secular population decline; favor cash flow + early exit over multi-decade hold.
- At projected returns (10.0% appreciation + 3.0% rent growth), your $32k cash investment doubles in ~2 years — after that, you're playing with house money.
- By year 3, paydown + projected appreciation supports a ~$31k cash-out refi (75% LTV) — recoverable capital for the next deal without selling this one.
Negotiation context
- It's been on market 17 days — a 2% lower offer ($113k) is reasonable based on typical stale-listing flexibility.
Questions for the listing agent
- What does the HOA fee cover, when was the last increase, and are there any pending special assessments or reserve-fund shortfalls?
- Is there a deadline driving the sale (1031 exchange, divorce, estate, relocation)? That informs how much negotiation room exists.
- Schools are F-rated, which usually means shorter tenancies and higher turnover. Who's the typical renter profile here, and what's been the actual vacancy rate?
- What's the average days-on-market for RENTAL listings here right now (not sales)? A rising rental-DOM trend means longer vacancies and softer asking-rent achievability than the comps imply.
- What's the recent tenant-quality profile in this submarket — average credit score on applications, eviction rate, late-payment / NSF rate, and stable-employment percentage? A property-management company in the area should have these aggregated.
- How much new for-sale + rental construction is in the pipeline within 1–3 miles? Heavy new supply typically softens prices + rents 12–24 months out; constrained supply supports both.
Investment metrics
- 1% rule
- 1.39% ✓
- Cap rate
- 9.05%
- Cash-on-cash
- 9.85%
- DSCR
- 1.44
- GRM
- 6.0
CMA / ARV
- ARV (on-the-fly)
- $178,911
- Comps found
- 2
Show comp detail 2 sales within ~0.75 mi
| Address | Dist | Beds/Ba | Sqft | Sold | Price | $/sf | Match |
|---|---|---|---|---|---|---|---|
| 14 Redwood Dr | 0.08mi | 3/2.0 | 924 (-0%) | 12mo | $73,500 | $80 | 86 |
| 66 Michigan St | 0.43mi | 2/1.5 (-1) | 924 (-0%) | 16mo | $178,000 | $193 | 59 |
Match score weights: distance 35% · size 25% · config 20% · recency 20%. Top-matched comps best support the ARV.
Projected returns pro-forma
10.0% appreciation · 3.0% rent growth · sell at horizon
- IRR
- 31.5%
- Equity multiple
- 3.47×
- Total profit
- $79,536
- Equity at exit
- $103,511
- IRR
- 27.3%
- Equity multiple
- 7.88×
- Total profit
- $221,292
- Equity at exit
- $223,225
Cash invested: $32,172 (down + closing). Projections, not guarantees.
Landlord ↔ Tenant lean methodology
- Overall (STATE)
- 56 Moderately Landlord-Leaning
- State New Hampshire
- 56 Moderately Landlord-Leaning · D+1
- County
- — inherits STATE
- City
- — inherits STATE
ZIP-level market 03470
- Home prices YoY
- 5.2%
- Active inventory
- 43
- Price-to-rent
- 6.0×
Monthly cashflow live
- Estimated rent
- $1,592 medium interval (Pro) →
- Mortgage (P&I)
- −$603
- Tax from tax record
- −$103 /mo · $1,237/yr
- Insurance
- −$48
- HOA
- −$240
- Vacancy / Maint / Mgmt
- −$334
- Net cashflow
- $264
Break-even live
UW: 25.0% down · 7.5% · 30yr · 1.5% tax · 5.0% vac · 8.0% maint · 8.0% mgmt
Financing live
Cash to close
- Down payment
- $28,725
- Closing costs
- $3,447
- Reserves months
- —
- Total cash needed
- —
Loan-product check · same deal, 3 products live
Conventional
25% down · 7.5% · 30yr
- Down + closing
- —
- Monthly P&I
- —
- Monthly cashflow
- —
- DSCR
- —
- Eligible?
- —
Personal DTI + credit; lowest rate.
DSCR
20% down · 8.5% · 30yr
- Down + closing
- —
- Monthly P&I
- —
- Monthly cashflow
- —
- DSCR
- —
- Eligible?
- —
No personal income docs; deal must DSCR.
Hard money
10% down · 12.0% · 12mo
- Down + closing
- —
- Monthly P&I
- —
- Monthly cashflow
- —
- DSCR
- —
- Eligible?
- —
Short-term bridge; refi at stabilization.
HOA detail
- Monthly dues
- $240 · $2,880/yr
- Likely covers
- watersewer
Listing history 2 events
-
2026-05-11price $114,900
-
2026-05-08$115,000 Active
ⓘ Source: listings_history table (triggers on properties + properties_extension) + one-shot
backfill from property_details.listing_events for pre-trigger history.
Tax reassessment forecast NH · Partial reset (capped growth)
- Current annual tax
- $1,237 · $103/mo
- Projected year-2 tax
- $1,871 · $156/mo
- Expected delta
- +$634/yr (+$53/mo · 51.2%)
ⓘ Screening estimate from a state-policy table — verify with the county assessor before closing.
Nearby sold comps map
Loading sold comps map…
Walkable amenities ~0.75 mi
Loading nearby amenities…
Taxation est. · year 1
- Rental income
- $19,101
- − Mortgage interest
- −$6,436
- − Property taxes
- −$1,237
- − Insurance
- −$574
- − Repairs & maintenance
- −$1,528
- − Management
- −$1,528
- − HOA
- −$2,880
- − Depreciation
- −$3,343
- Taxable income
- $1,575
- Est. tax owed @ 24.0%
- −$378
- After-tax cash flow
- $2,790/yr
For passive investors: Depreciation is non-cash, so a rental often shows a tax loss while cash-flowing — sheltering income. Rental losses are passive: they offset passive income freely, and up to $25,000/yr can offset ordinary (W-2) income if you actively participate and your MAGI is under $100k (phasing out to $0 by $150k); unused losses carry forward. On sale, claimed depreciation is recaptured at up to 25%, and gains may owe capital-gains tax (a 1031 exchange can defer both). Figures are a year-1 estimate at your 24.0% rate — not tax advice; consult a CPA.
Schools (NCES district)
- District
- Winchester School District
- NCES district ID
- 3307140
- Math proficiency
- 20% ▼ -1.00%
- Reading proficiency
- 33% ▲ 1.00%
- Median HH income
- $44,365
- Composite
- 25.72/100
- National rank
- #12806
- State rank
- #162 of 171 in NH
Livability — Winchester
- Score
- 57/100
- State rank
- #92
- US rank
- #21633
Category grades
Schools grade is shown separately in the Schools card above.
Census & demographics
- Census place
- Winchester, NH
- Population (ZIP)
- 5,038
Population outlook (Cheshire County) Hauer SSP2
- Today (2025)
- 74,613 people
- By 2030
- 72,495 · -2.8%
- By 2040
- 66,778 · -10.5%
- By 2050
- 60,963 · -18.3%
- By 2075
- 49,511 · -33.6%
- By 2100
- 39,687 · -46.8%
Race, ethnicity, and origin ACS 2023
- Neighborhood character
- Predominantly White (93%)
- Race & ethnicity
- White 93% Two or more races 6% Hispanic / Latino 2%
- Common ancestry
- Lithuanian 11% Romanian 7% Italian 4%
- Foreign-born
- 1% · Canada
- Languages at home
- 98% English-only · French/Haitian/Cajun 1% Spanish 1%
Political lean MEDSL · Cheshire
- 2024 margin
- Lean D (+9.8) · D 54.4% · R 44.6% · Other 1.1%
- 2008→2024 swing
- -17.8pp toward R · 2008: 27.6pp · 2024: 9.8pp
- All cycles
- 2024: D+9.8 2020: D+17.2 2016: D+12.6 2012: D+24.8 2008: D+27.6
Not yet ingested
- Civics
- —
Market trends
- HPI YoY
- ▲ 18.37%
- Current HPI
- 369.641
- Rent YoY
- —
- Metro
- —
- State GDP YoY
- —
- F500 in state
- 0
Price history
-0.1% since first listed2 events — show timeline
- 2026-05-11 Price Changed $114,900 PrimeMLS
- 2026-05-08 Listed $115,000 PrimeMLS
Property tax history
+7.2%/yrLatest (2024): $1,237 · -7.7% YoY. Source: county tax records.
Cash-flow waterfall
monthlySold comps — $/sqft
last 12 mo · ≤1 miLoading sold comps…