415 N Akers St · Visalia, CA
Flood risk 6/10 · Moderate
- FEMA flood zone
- X
- Chance of flooding over 30 yrs
- 0.8%
- Est. flood insurance / yr
- $507 – $1,088
Fire risk 1/10 · Minimal
- Est. fire insurance / yr
- $659 – $1,223
Heat risk 8/10 · Major
- Hot days now (above 105°F)
- 7 days/yr
- Hot days in 30 yrs
- 16 days/yr
Wind risk 1/10 · Minimal
- Chance of severe wind over 30 yrs
- —
Air-quality risk 10/10 · Severe
- Unhealthy air days now
- 37 days/yr
- Unhealthy air days in 30 yrs
- 39 days/yr
Risk factors via First Street. Map © Google.
Why this score? — see what drove the B- grade
The composite is a weighted blend of 9 inputs, each scored 0–100. Each bar is that input's sub-score; the figure is the points it added to the 100-point composite (weight × sub-score).
- Cash flow +30.0/30.0
- 1% rule +10.0/10.0
- DSCR +10.0/10.0
- ARV discount +7.5/15.0
- Livability +3.6/5.0
- Rent growth +3.3/5.0
- Schools +3.0/10.0
- Condition / age +2.5/5.0
- Appreciation +0.0/10.0
$109,500
🖨 Deal sheet 📄 Offer letter ✓ Due diligence
Listing remarks MLS
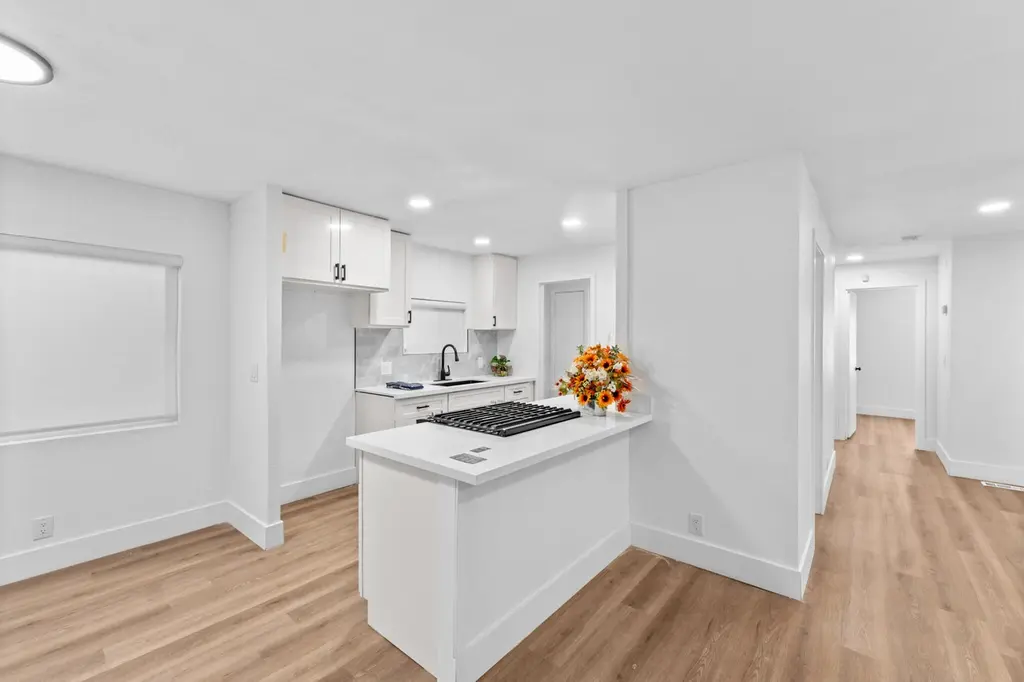
Welcome to this beautifully remodeled 3-bedroom, 2-bathroom mobile home located in the desirable Royal Oaks Mobile Home Park, a peaceful 55+ community. This home boasts a bright, modern design with abundant natural light from brand-new windows and fresh paint inside and out. Enjoy new flooring, updated appliances, and a spacious living room perfect for relaxing. Plus, the home features central A/C and a wonderful covered patio—ideal for enjoying your morning coffee or evening breeze. With its modern updates and prime location, this move-in-ready home is a true gem!
Key facts
- Community pool
- Built 1978
- Listed 54 days
Property features AI
Finance
- HOA & community: Located in a senior community; Home is in a mobile home park (Royal Oaks)
Exterior
- Parking: Attached carport
- Security: Carbon monoxide detector(s); Smoke detector(s)
- Utilities: Public water; Public sewer; Electricity connected; Natural gas connected and available; Water connected
- Home design: Manufactured in park — double wide manufactured home; Pillar/post/pier foundation
- Construction: Shingle roof; Wood skirting; Model: RYEMB; Mobile home dimensions approximately 24' × 58'
- Exterior features: Covered patio and front porch; Deck; Private and community pool; North-facing
Interior
- Kitchen: Gas oven; Range
- Flooring: Laminate
- Bathrooms: 2 full bathrooms
- Heating & cooling: Central heating; Central air conditioning
- Interior features: Gas oven and range; Water heater; Laminate flooring
- Laundry & utility: Washer hookup; Gas dryer hookup; Dedicated laundry room
Neighborhood map
What this means for you Summary
Snapshot
- This is a 3-bed/2.0-bath land listed at $110k.
Deal economics
- At list price, monthly cash flow is $938 ($11k/yr) — positive.
- The deal already cash-flows at list — no discount required.
- Meets the 1% rule at list price ($2k rent vs $110k).
- Recommended offer: $106k (3.0% below list) — sets the bar for market timing.
- Cap rate 16.6% vs local median 3.3% in Visalia — top-decile yield for the area; either an underpriced asset or a hidden risk that comps aren't pricing in. Stress-test before assuming the spread holds.
Location & tenants
- Location reads 72/100 on livability (#196 in CA) — a middle-class / working-renter tenant base. Strengths: commute A+, housing A+, employment B; Watch: amenities D, crime D-, cost of living F.
- Visalia Unified (urban): math 30% / reading 40% proficiency, ranked #273 of 517 in CA (top 53%) — families likely to look elsewhere, expect single-tenant / working-renter base with shorter leases.
- Market conditions: Rents rising (+3.1%/yr); 552 active listings in the ZIP; 22 comparable units currently listed for rent nearby; rentals lingering (median 44d on market — plan ~5-8 weeks vacancy on turnover, expect pricing pressure); 59% of comp listings sitting > 30 days — soft ceiling on asking rent; solid renter incomes; 1,447 units permitted in Tulare County in 2024 (307 in 5+ unit buildings).
- This rent runs 31% of the median local income ($83k/yr) — at the standard rent-burdened threshold; future hikes will face affordability resistance.
Forward outlook
- Local home prices are declining (-3.0%/yr); year-one equity from $757 of loan paydown is wiped out by about $3k of value loss. Plan a longer hold.
- Tulare County population projected at +10% by 2050 — modest demand growth; plan on rents tracking national, not racing it.
- At projected returns (-3.0% appreciation + 3.1% rent growth), your $31k cash investment doubles in ~4 years — after that, you're playing with house money.
Negotiation context
- It's been on market 54 days — a 3% lower offer ($106k) is reasonable based on typical stale-listing flexibility.
- 11 sale attempts since 8y ago with the ask held roughly flat each time — persistent listings suggest the price (not the market) is what's stuck; bring a comps-based counter.
Risks & watch-outs
- Climate carrying-cost: major flood risk; extreme-heat days projected 7→16/yr by 2055 (HVAC capex compounding) — expect insurance premiums to compound above CPI over the hold.
Questions for the listing agent
- It's been on market 54 days. Have you received any prior offers? Is the seller open to a 3% concession, seller financing, or rate buy-down credit?
- Built in 1978 — when were the roof, HVAC, electrical panel, plumbing, and water heater last replaced?
- Is there a deadline driving the sale (1031 exchange, divorce, estate, relocation)? That informs how much negotiation room exists.
- Crime grade is D in this area — have there been break-ins, vandalism, or insurance claims at this property in the last 3 years? What carrier currently insures it and at what premium?
- What's the average days-on-market for RENTAL listings here right now (not sales)? A rising rental-DOM trend means longer vacancies and softer asking-rent achievability than the comps imply.
- What's the recent tenant-quality profile in this submarket — average credit score on applications, eviction rate, late-payment / NSF rate, and stable-employment percentage? A property-management company in the area should have these aggregated.
- How much new for-sale + rental construction is in the pipeline within 1–3 miles? Heavy new supply typically softens prices + rents 12–24 months out; constrained supply supports both.
Investment metrics
- 1% rule
- 1.96% ✓
- Cap rate
- 16.57%
- Cash-on-cash
- 36.71%
- DSCR
- 2.63
- GRM
- 4.3
CMA / ARV
- ARV (median comp)
- $67,881
- List price
- $109,500
- Delta
- 61.31%
- Verdict
- OVERPRICED
- Comps
- 14 within 1.0 mi
Projected returns pro-forma
-3.0% appreciation · 3.12% rent growth · sell at horizon
- IRR
- 32.7%
- Equity multiple
- 2.38×
- Total profit
- $42,287
- Equity at exit
- $16,327
- IRR
- 39.8%
- Equity multiple
- 4.75×
- Total profit
- $114,945
- Equity at exit
- $9,468
Cash invested: $30,660 (down + closing). Projections, not guarantees.
Landlord ↔ Tenant lean methodology
- Overall (STATE)
- 18 Strongly Tenant-Friendly
- State California
- 18 Strongly Tenant-Friendly · D+13
- County
- — inherits STATE
- City
- — inherits STATE
ZIP-level market 93291
- Rents YoY
- 3.1%
- Active inventory
- 552
- Price-to-rent
- 4.3×
Monthly cashflow live
- Estimated rent
- $2,145 high interval (Pro) →
- Mortgage (P&I)
- −$574
- Tax est. 1.5%
- −$137 /mo · $1,642/yr
- Insurance
- −$46
- HOA
- −$0
- Vacancy / Maint / Mgmt
- −$450
- Net cashflow
- $938
Break-even live
UW: 25.0% down · 7.5% · 30yr · 1.5% tax · 5.0% vac · 8.0% maint · 8.0% mgmt
Financing live
Cash to close
- Down payment
- $27,375
- Closing costs
- $3,285
- Reserves months
- —
- Total cash needed
- —
Loan-product check · same deal, 3 products live
Conventional
25% down · 7.5% · 30yr
- Down + closing
- —
- Monthly P&I
- —
- Monthly cashflow
- —
- DSCR
- —
- Eligible?
- —
Personal DTI + credit; lowest rate.
DSCR
20% down · 8.5% · 30yr
- Down + closing
- —
- Monthly P&I
- —
- Monthly cashflow
- —
- DSCR
- —
- Eligible?
- —
No personal income docs; deal must DSCR.
Hard money
10% down · 12.0% · 12mo
- Down + closing
- —
- Monthly P&I
- —
- Monthly cashflow
- —
- DSCR
- —
- Eligible?
- —
Short-term bridge; refi at stabilization.
Rent comps 22 comps
| Address | Beds | Baths | Sqft | Rent | $/sqft | DOM | Units | Dist |
|---|---|---|---|---|---|---|---|---|
| 5936 W Oak Ave Visalia, CA | 3.0 | 2.0 | 1679 | $1,950 | $1.16 | 43d | 1 | 0.25mi |
| 5948 W Crowley Ave Visalia, CA | 3.0 | 2.0 | 1566 | $2,270 | $1.45 | 21d | 1 | 0.26mi |
| 537 N Tommy St Visalia, CA | 3.0 | 2.0 | 1706 | $2,995 | $1.76 | 43d | 1 | 0.27mi |
| 4731 W School Ave Visalia, CA | 3.0 | 2.0 | 1280 | $1,900 | $1.48 | 43d | 1 | 0.52mi |
| 201 N Bollinger St Visalia, CA | 3.0 | 2.0 | 1194 | $1,995 | $1.67 | 43d | 1 | 0.70mi |
| 4845 W Cypress Ave Visalia, CA | 2.0 | 2.0 | 1027 | $1,650 | $1.61 | 43d | 1 | 0.75mi |
| 700 S Linwood St Unit 720 Visalia, CA | 2.0 | 1.0 | 1054 | $1,650 | $1.57 | 43d | 1 | 0.88mi |
| 4401 W Goshen Ave Visalia, CA | 2.0 | 2.0 | 996 | $1,695 | $1.70 | 13d | 2 | 0.88mi |
| 4230 W Grove Ct Visalia, CA | 3.0 | 2.0 | 1734 | $2,300 | $1.33 | 21d | 1 | 0.89mi |
| 4928 Westgate Ct Visalia, CA | 2.0 | 1.0 | 1069 | $2,200 | $2.06 | 21d | 1 | 0.93mi |
| 4052 W Meadow Ave Visalia, CA | 2.0 | 1.0 | 877 | $1,340 | $1.53 | 21d | 1 | 1.19mi |
| 3900-4054 W Meadow Ave Unit 3936 Visalia, CA | 2.0 | 1.0 | 877 | $1,365 | $1.56 | 43d | 1 | 1.24mi |
| 3900-4054 W Meadow Ave Unit 4052 Visalia, CA | 2.0 | 1.0 | 877 | $1,340 | $1.53 | 21d | 1 | 1.24mi |
| 3936 W Meadow Ave Visalia, CA | 2.0 | 1.0 | 877 | $1,365 | $1.56 | 43d | 1 | 1.24mi |
| 6710 W Doe Ave Visalia, CA | 1.0–2.0 | 1.0–2.0 | 1017 | $2,195 | $2.16 | 2d | 4 | 1.26mi |
| 4018 W Elowin Ct Visalia, CA | 3.0 | 2.0 | 1290 | $2,095 | $1.62 | 43d | 1 | 1.28mi |
| 815 S Demaree St Unit 33 Visalia, CA | 2.0 | 1.5 | 890 | $1,300 | $1.46 | 21d | 1 | 1.28mi |
| 815 S Demaree St Apt 40 Visalia, CA | 2.0 | 1.5 | 890 | $1,300 | $1.46 | 43d | 1 | 1.28mi |
| 815 S Demaree St Unit 11 Visalia, CA | 3.0 | 1.5 | 924 | $1,400 | $1.52 | 43d | 1 | 1.28mi |
| 1849 S Noyes St Visalia, CA | 3.0 | 2.0 | 1497 | $2,250 | $1.50 | 43d | 1 | 1.38mi |
| 3417 W Campus Ave Visalia, CA | 2.0 | 2.0 | 1050 | $1,450 | $1.38 | 13d | 1 | 1.47mi |
| 1212 S Demaree St Visalia, CA | 4.0 | 2.0 | 1644 | $2,500 | $1.52 | 43d | 1 | 1.47mi |
Listing history 45 events
-
2026-06-18days on market $109,500 Active 54 DOM
-
2026-06-17days on market $109,500 Active 53 DOM
-
2026-06-16days on market $109,500 Active 52 DOM
-
2026-06-15days on market $109,500 Active 51 DOM
-
2026-06-14days on market $109,500 Active 49 DOM
-
2026-06-13days on market $109,500 Active 48 DOM
-
2026-06-10days on market $109,500 Active 46 DOM
-
2026-06-09days on market $109,500 Active 45 DOM
-
2026-06-08days on market $109,500 Active 44 DOM
-
2026-06-07days on market $109,500 Active 43 DOM
-
2026-06-05pricedays on market $109,500 Active 40 DOM
-
2026-06-03days on market $111,500 Active 39 DOM
-
2026-06-02days on market $111,500 Active 38 DOM
-
2026-06-01days on market $111,500 Active 37 DOM
-
2026-05-31days on market $111,500 Active 36 DOM
-
2026-05-30days on market $111,500 Active 35 DOM
-
2026-05-15price $111,500 674-char remark
-
2026-05-01price $112,500 674-char remark
-
2026-04-24$113,500 Active 674-char remark
-
2026-03-27$149,900 Active 577-char remark
Show marketing remark (577 chars)
Welcome to this beautifully remodeled 3-bedroom, 2-bathroom mobile home located in the desirable Royal Oaks Mobile Home Park, a peaceful 55+ community. This home boasts a bright, modern design with abundant natural light from brand-new windows and fresh paint inside and out. Enjoy new flooring, updated appliances, and a spacious living room perfect for relaxing. Plus, the home features central A/C and a wonderful covered patio—ideal for enjoying your morning coffee or evening breeze. With its modern updates and prime location, this move-in-ready home is a true gem!
-
2025-07-28price $90,000
-
2025-06-25price $95,000
-
2025-01-07$79,000 Active
-
2024-09-26historical $1,500
-
2024-08-26$1,500
-
2024-06-11price $126,000
-
2024-05-16price $136,000
-
2024-04-26soldstatus $135,000 Closed
-
2024-03-24price $139,000
-
2024-03-05price $138,500
-
2024-02-28price $154,000
-
2024-02-20$164,000 Active
-
2024-02-19price $149,000
-
2024-02-19price $150,000
-
2024-02-09$154,000 Active
-
2023-06-15soldstatus $69,999 Closed
-
2023-05-16status Active
-
2023-05-12status Active
-
2023-04-19$69,999 Active
-
2022-09-24price $57,900
-
2022-07-28$59,900 Active
-
2020-02-01soldstatus $34,900
-
2019-07-11soldstatus $45,000
-
2018-09-28soldstatus $25,000
-
2018-07-24$28,000
ⓘ Source: listings_history table (triggers on properties + properties_extension) + one-shot
backfill from property_details.listing_events for pre-trigger history.
Climate risk First Street
- Flood 6/10 Major FEMA zone X · 80% chance over 30 yrs
- Wildfire 1/10 Low
- Heat 8/10 Severe 7 d/yr ≥105°F today · 16 d/yr by 30 yrs out
- Wind 1/10 Low
- Air quality 10/10 Extreme 37 unhealthy d/yr today · 39 by 30 yrs out
Nearby sold comps map
Loading sold comps map…
Walkable amenities ~0.75 mi
Loading nearby amenities…
Taxation est. · year 1
- Rental income
- $25,742
- − Mortgage interest
- −$6,134
- − Property taxes
- −$1,642
- − Insurance
- −$548
- − Repairs & maintenance
- −$2,059
- − Management
- −$2,059
- − Depreciation
- −$3,185
- Taxable income
- $10,114
- Est. tax owed @ 24.0%
- −$2,427
- After-tax cash flow
- $8,828/yr
For passive investors: Depreciation is non-cash, so a rental often shows a tax loss while cash-flowing — sheltering income. Rental losses are passive: they offset passive income freely, and up to $25,000/yr can offset ordinary (W-2) income if you actively participate and your MAGI is under $100k (phasing out to $0 by $150k); unused losses carry forward. On sale, claimed depreciation is recaptured at up to 25%, and gains may owe capital-gains tax (a 1031 exchange can defer both). Figures are a year-1 estimate at your 24.0% rate — not tax advice; consult a CPA.
Schools (NCES district)
- District
- Visalia Unified
- NCES district ID
- 0641160
- Math proficiency
- 30% ▼ -3.00%
- Reading proficiency
- 40% ▼ -10.00%
- Median HH income
- $51,672
- Composite
- 30.47/100
- National rank
- #6223
- State rank
- #273 of 517 in CA
Livability — Visalia
- Score
- 72/100
- State rank
- #196
- US rank
- #6351
Category grades
Schools grade is shown separately in the Schools card above.
Census & demographics
- Census place
- Visalia, CA
- County
- Tulare County · 323,826 people
- City population
- 163,333
- Metro
- Visalia, CA
- Population (ZIP)
- 63,568
- Household income
- $82,610
- Rent vs Own
- Severe rent burden
- 1764.0
Population outlook (Tulare County) Hauer SSP2
- Today (2025)
- 484,681 people
- By 2030
- 496,241 · +2.4%
- By 2040
- 518,507 · +7.0%
- By 2050
- 534,920 · +10.4%
- By 2075
- 548,417 · +13.2%
- By 2100
- 513,085 · +5.9%
Race, ethnicity, and origin ACS 2023
- Neighborhood character
- Diverse neighborhood (Simpson 0.60)
- Race & ethnicity
- Hispanic / Latino 53% White 34% Two or more races 17% Asian 9% Black 2% Native American 1%
- Hispanic origin (detail)
- Mexican 48%
- Common ancestry
- Russian 2% Iranian 2% Lithuanian 1%
- Foreign-born
- 19% · Canada
- Languages at home
- 58% English-only · Spanish 36% Other Asian/Pacific 3% Other Indo-European 1%
Political lean MEDSL · Tulare
- 2024 margin
- Strong R (+20.7) · D 38.5% · R 59.2% · Other 2.3%
- 2008→2024 swing
- -5.4pp toward R · 2008: -15.3pp · 2024: -20.7pp
- All cycles
- 2024: R+20.7 2020: R+7.8 2016: R+12.1 2012: R+17.8 2008: R+15.3
Not yet ingested
- Civics
- —
Market trends
- HPI YoY
- ▼ -204.95%
- Current HPI
- 329.0192
- Rent YoY
- ▲ 3.12%
- Metro
- Visalia, CA
- State GDP YoY
- ▲ 3.21%
- F500 in state
- 116
Industry mix (Fortune 500 HQ in CA)
| Industry | F500 HQs | Revenue |
|---|---|---|
| Technology | 27 | $1,492B |
|
||
| Financial Services | 3 | $174B |
|
||
| Retail | 3 | $44B |
|
||
| Insurance | 3 | $26B |
|
||
| Media / Entertainment | 2 | $115B |
|
||
| Pharmaceuticals / Biotech | 2 | $62B |
|
||
Price history
+291.1% since first listed30 events — show timeline
- 2026-06-04 Price Changed $109,500 TCMLS
- 2026-05-15 Price Changed $111,500 TCMLS
- 2026-05-01 Price Changed $112,500 TCMLS
- 2026-04-24 Listed $113,500 TCMLS
- 2026-03-27 Listed $149,900 TCMLS
- 2025-07-28 Price Changed $90,000 TCMLS
- 2025-06-25 Price Changed $95,000 TCMLS
- 2025-01-07 Listed $79,000 TCMLS
- 2024-09-26 Rental Removed $1,500 RENT.
- 2024-08-26 Listed for Rent $1,500 RENT.
- 2024-06-11 Price Changed $126,000 KCBOR
- 2024-05-16 Price Changed $136,000 KCBOR
- 2024-04-26 Sold (MLS) $135,000 KCBOR
- 2024-03-24 Price Changed $139,000 KCBOR
- 2024-03-05 Price Changed $138,500 KCBOR
- 2024-02-28 Price Changed $154,000 KCBOR
- 2024-02-20 Listed $164,000 KCBOR
- 2024-02-19 Price Changed $149,000 KCBOR
- 2024-02-19 Price Changed $150,000 KCBOR
- 2024-02-09 Listed $154,000 KCBOR
- 2023-06-15 Sold (MLS) $69,999 KCBOR
- 2023-05-16 Relisted — KCBOR
- 2023-05-12 Relisted — KCBOR
- 2023-04-19 Listed $69,999 KCBOR
- 2022-09-24 Price Changed $57,900 TCMLS
- 2022-07-28 Listed $59,900 TCMLS
- 2020-02-01 Sold (MLS) $34,900 TCMLS
- 2019-07-11 Sold (MLS) $45,000 TCMLS
- 2018-09-28 Sold (MLS) $25,000 TCMLS
- 2018-07-24 Listed $28,000 TCMLS
Property tax history
+70.2%/yrLatest (2025): $45,038 · +2.8% YoY. Source: county tax records.
Cash-flow waterfall
monthlySold comps — $/sqft
last 12 mo · ≤1 miLoading sold comps…