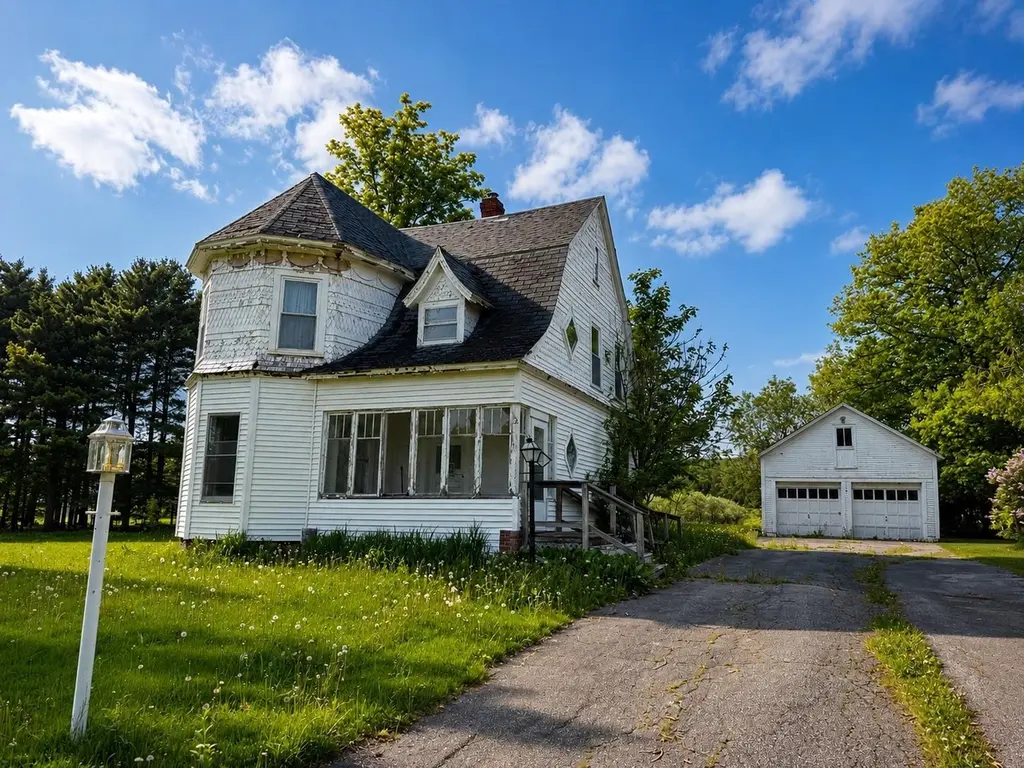
52 Dewey St · Richford, VT
Flood risk 1/10 · Minimal
- FEMA flood zone
- X
- Chance of flooding over 30 yrs
- 0.0%
- Est. flood insurance / yr
- $507 – $1,088
Fire risk 2/10 · Minimal
- Est. fire insurance / yr
- $480 – $892
Heat risk 2/10 · Minimal
- Hot days now (above 89°F)
- 7 days/yr
- Hot days in 30 yrs
- 16 days/yr
Wind risk 2/10 · Minimal
- Chance of severe wind over 30 yrs
- 3.0%
Air-quality risk 2/10 · Minimal
- Unhealthy air days now
- 1 days/yr
- Unhealthy air days in 30 yrs
- 1 days/yr
Risk factors via First Street. Map © Google.
Why this score? — see what drove the B+ grade
The composite is a weighted blend of 9 inputs, each scored 0–100. Each bar is that input's sub-score; the figure is the points it added to the 100-point composite (weight × sub-score).
- Cash flow +30.0/30.0
- 1% rule +10.0/10.0
- DSCR +10.0/10.0
- ARV discount +7.5/15.0
- Appreciation +5.5/10.0
- Schools +5.0/10.0
- Livability +3.4/5.0
- Rent growth +2.5/5.0
- Condition / age +2.5/5.0
$69,900
🖨 Deal sheet 📄 Offer letter ✓ Due diligence
Listing remarks
Bring your vision and imagination. This Victorian home is being sold AS-IS and has suffered deterioration during years of vacancy. Specific condition is unknown and a Hold Harmless Agreement is required prior to all showings due to safety concerns. The property may be best suited for redevelopment, though an ambitious restoration could potentially bring this historic home back to life. Situated on a generously sized lot that appears to be a double lot. The potential for subdivision, an additional dwelling unit, or other development opportunities is a possible, and buyers should perform their own due diligence regarding all zoning, permitting, and development possibilities.
Key facts
- 0.75 acre lot
- 2 garage spots
- Built 1890
Property features AI
Exterior
- Parking: 2-car garage
- Utilities: Community water; Community sewer; 110V electric; Fiber optic and high-speed internet available; Cable available
- Home design: Antique / Historic Victorian style; Existing property
- Construction: Built in 1890; Vinyl siding; Asphalt shingle roof
- Exterior features: City lot in town within a neighborhood; Gravel driveway; White exterior
Interior
- Bathrooms: 1 full bathroom; 1 half bathroom
- Heating & cooling: Oil heating
- Interior features: 10 total rooms; Full basement with interior access
Neighborhood map
What this means for you Summary
Snapshot
- This is a 4-bed/1.5-bath other listed at $70k.
Deal economics
- At list price, monthly cash flow is $791 ($9k/yr) — positive.
- The deal already cash-flows at list — no discount required.
- Meets the 1% rule at list price ($2k rent vs $70k).
- Recommended offer: $69k (1.5% below list) — sets the bar for market timing.
Location & tenants
- Location reads 68/100 on livability (#41 in VT) — a middle-class / working-renter tenant base. Strengths: crime A+, cost of living A+, housing A+; Watch: employment D, schools F, amenities F.
- Market conditions: 22 active listings in the ZIP; 200 units permitted in Franklin County in 2024 (25 in 5+ unit buildings).
Forward outlook
- In year one you build about $1k of equity ($483 loan paydown + $680 appreciation (1.0% local appreciation)).
- Franklin County population projected to shrink 3% by 2050 — rents likely to lag national; underwrite the cash flow, not the appreciation.
- At projected returns (1.0% appreciation + 3.0% rent growth), your $20k cash investment doubles in ~2 years — after that, you're playing with house money.
Negotiation context
- It's been on market 20 days — a 2% lower offer ($69k) is reasonable based on typical stale-listing flexibility.
Risks & watch-outs
- Watch-outs: property tax is 2.9% of price; built in 1890 — expect roof / HVAC / electrical / plumbing capex.
Questions for the listing agent
- Built in 1890 — when were the roof, HVAC, electrical panel, plumbing, and water heater last replaced?
- Property tax is high relative to price — has the assessment been appealed recently, and will the sale trigger a re-assessment?
- Is there a deadline driving the sale (1031 exchange, divorce, estate, relocation)? That informs how much negotiation room exists.
- Schools are F-rated, which usually means shorter tenancies and higher turnover. Who's the typical renter profile here, and what's been the actual vacancy rate?
- What's the average days-on-market for RENTAL listings here right now (not sales)? A rising rental-DOM trend means longer vacancies and softer asking-rent achievability than the comps imply.
- What's the recent tenant-quality profile in this submarket — average credit score on applications, eviction rate, late-payment / NSF rate, and stable-employment percentage? A property-management company in the area should have these aggregated.
- How much new for-sale + rental construction is in the pipeline within 1–3 miles? Heavy new supply typically softens prices + rents 12–24 months out; constrained supply supports both.
Investment metrics
- 1% rule
- 2.45% ✓
- Cap rate
- 19.87%
- Cash-on-cash
- 48.50%
- DSCR
- 3.16
- GRM
- 3.4
CMA / ARV
No comps found within radius.
Projected returns pro-forma
0.97% appreciation · 3.0% rent growth · sell at horizon
- IRR
- 51.2%
- Equity multiple
- 3.64×
- Total profit
- $51,665
- Equity at exit
- $23,761
- IRR
- 52.8%
- Equity multiple
- 7.29×
- Total profit
- $123,171
- Equity at exit
- $31,499
Cash invested: $19,572 (down + closing). Projections, not guarantees.
Landlord ↔ Tenant lean methodology
- Overall (STATE)
- 41 Moderately Tenant-Leaning
- State Vermont
- 41 Moderately Tenant-Leaning · D+15
- County
- — inherits STATE
- City
- — inherits STATE
ZIP-level market 05476
- Home prices YoY
- 0.3%
- Active inventory
- 22
- Price-to-rent
- 3.4×
Monthly cashflow live
- Estimated rent
- $1,713 medium interval (Pro) →
- Mortgage (P&I)
- −$367
- Tax from tax record
- −$166 /mo · $1,995/yr
- Insurance
- −$29
- HOA
- −$0
- Vacancy / Maint / Mgmt
- −$360
- Net cashflow
- $791
Break-even live
UW: 25.0% down · 7.5% · 30yr · 1.5% tax · 5.0% vac · 8.0% maint · 8.0% mgmt
Financing live
Cash to close
- Down payment
- $17,475
- Closing costs
- $2,097
- Reserves months
- —
- Total cash needed
- —
Loan-product check · same deal, 3 products live
Conventional
25% down · 7.5% · 30yr
- Down + closing
- —
- Monthly P&I
- —
- Monthly cashflow
- —
- DSCR
- —
- Eligible?
- —
Personal DTI + credit; lowest rate.
DSCR
20% down · 8.5% · 30yr
- Down + closing
- —
- Monthly P&I
- —
- Monthly cashflow
- —
- DSCR
- —
- Eligible?
- —
No personal income docs; deal must DSCR.
Hard money
10% down · 12.0% · 12mo
- Down + closing
- —
- Monthly P&I
- —
- Monthly cashflow
- —
- DSCR
- —
- Eligible?
- —
Short-term bridge; refi at stabilization.
Listing history 17 events
-
2026-06-18days on market $69,900 Active 20 DOM
-
2026-06-17days on market $69,900 Active 19 DOM
-
2026-06-16days on market $69,900 Active 18 DOM
-
2026-06-15days on market $69,900 Active 17 DOM
-
2026-06-15days on market $69,900 Active 16 DOM
-
2026-06-13days on market $69,900 Active 15 DOM
-
2026-06-12days on market $69,900 Active 14 DOM
-
2026-06-09days on market $69,900 Active 11 DOM
-
2026-06-08days on market $69,900 Active 10 DOM
-
2026-06-08days on market $69,900 Active 9 DOM
-
2026-06-07days on market $69,900 Active 8 DOM
-
2026-06-03days on market $69,900 Active 5 DOM
-
2026-06-02days on market $69,900 Active 4 DOM
-
2026-06-01days on market $69,900 Active 3 DOM
-
2026-05-31days on market $69,900 Active 2 DOM
-
2026-05-29$69,900 Active
-
2026-05-29historical $69,900
ⓘ Source: listings_history table (triggers on properties + properties_extension) + one-shot
backfill from property_details.listing_events for pre-trigger history.
Tax reassessment forecast VT · Partial reset (capped growth)
- Current annual tax
- $1,995 · $166/mo
- Projected year-2 tax
- $1,995 · $166/mo
- Expected delta
- $0/yr ($0/mo · 0.0%)
ⓘ Screening estimate from a state-policy table — verify with the county assessor before closing.
Climate risk First Street
- Flood 1/10 Low FEMA zone X · 0% chance over 30 yrs
- Wildfire 2/10 Low
- Heat 2/10 Low 7 d/yr ≥89°F today · 16 d/yr by 30 yrs out
- Wind 2/10 Low 3% chance of damaging wind over 30 yrs
- Air quality 2/10 Low 1 unhealthy d/yr today · 1 by 30 yrs out
Nearby sold comps map
Loading sold comps map…
Walkable amenities ~0.75 mi
Loading nearby amenities…
Taxation est. · year 1
- Rental income
- $20,551
- − Mortgage interest
- −$3,915
- − Property taxes
- −$1,995
- − Insurance
- −$350
- − Repairs & maintenance
- −$1,644
- − Management
- −$1,644
- − Depreciation
- −$2,033
- Taxable income
- $8,969
- Est. tax owed @ 24.0%
- −$2,153
- After-tax cash flow
- $7,339/yr
For passive investors: Depreciation is non-cash, so a rental often shows a tax loss while cash-flowing — sheltering income. Rental losses are passive: they offset passive income freely, and up to $25,000/yr can offset ordinary (W-2) income if you actively participate and your MAGI is under $100k (phasing out to $0 by $150k); unused losses carry forward. On sale, claimed depreciation is recaptured at up to 25%, and gains may owe capital-gains tax (a 1031 exchange can defer both). Figures are a year-1 estimate at your 24.0% rate — not tax advice; consult a CPA.
Schools (NCES district)
No district data.
Livability — Richford
- Score
- 68/100
- State rank
- #41
- US rank
- #10038
Category grades
Schools grade is shown separately in the Schools card above.
Census & demographics
- Census place
- Richford, VT
- Population (ZIP)
- 3,217
Population outlook (Franklin County) Hauer SSP2
- Today (2025)
- 50,374 people
- By 2030
- 50,718 · +0.7%
- By 2040
- 50,557 · +0.4%
- By 2050
- 48,832 · -3.1%
- By 2075
- 43,526 · -13.6%
- By 2100
- 33,970 · -32.6%
Race, ethnicity, and origin ACS 2023
- Neighborhood character
- Predominantly White (93%)
- Race & ethnicity
- White 93% Two or more races 4% Hispanic / Latino 2%
- Common ancestry
- Lithuanian 15% German 2% Slovak 2%
- Foreign-born
- 1% · Canada, Dominican Republic
- Languages at home
- 97% English-only · Spanish 2% French/Haitian/Cajun 1%
Political lean MEDSL · Franklin
- 2024 margin
- Toss-up / Even · D 50.0% · R 47.0% · Other 3.0%
- 2008→2024 swing
- -21.8pp toward R · 2008: 24.8pp · 2024: 3.0pp
- All cycles
- 2024: D+3.0 2020: D+9.0 2016: D+3.1 2012: D+23.6 2008: D+24.8
Not yet ingested
- Civics
- —
Market trends
- HPI YoY
- ▲ 0.97%
- Current HPI
- 332.3059
- Rent YoY
- —
- Metro
- —
- State GDP YoY
- —
- F500 in state
- 0
Price history
+0.0% since first listed2 events — show timeline
- 2026-05-29 Listed $69,900 PrimeMLS
- 2026-05-29 Coming Soon $69,900 PrimeMLS
Property tax history
-12.1%/yrLatest (2024): $1,995 · +25.6% YoY. Source: county tax records.
Cash-flow waterfall
monthlySold comps — $/sqft
last 12 mo · ≤1 miLoading sold comps…