 10-Plex
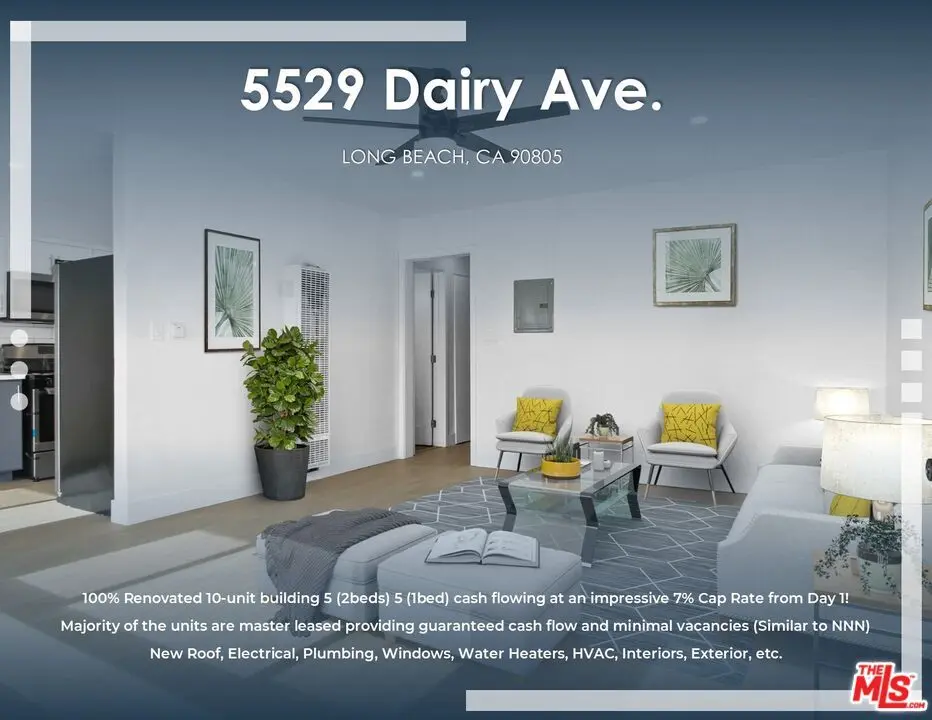
5529 Dairy Ave · Long Beach, CA
Flood risk 3/10 · Minor
- FEMA flood zone
- X
- Chance of flooding over 30 yrs
- 0.2%
- Est. flood insurance / yr
- $507 – $1,088
Fire risk 1/10 · Minimal
- Est. fire insurance / yr
- $659 – $1,223
Heat risk 4/10 · Minor
- Hot days now (above 90°F)
- 7 days/yr
- Hot days in 30 yrs
- 22 days/yr
Wind risk 1/10 · Minimal
- Chance of severe wind over 30 yrs
- —
Air-quality risk 6/10 · Moderate
- Unhealthy air days now
- 10 days/yr
- Unhealthy air days in 30 yrs
- 10 days/yr
Risk factors via First Street. Map © Google.
Why this score? — see what drove the D grade
The composite is a weighted blend of 9 inputs, each scored 0–100. Each bar is that input's sub-score; the figure is the points it added to the 100-point composite (weight × sub-score).
- Cash flow +15.6/30.0
- ARV discount +7.5/15.0
- DSCR +4.8/10.0
- Schools +3.7/10.0
- 1% rule +3.4/10.0
- Livability +3.4/5.0
- Rent growth +3.0/5.0
- Condition / age +2.5/5.0
- Appreciation +0.0/10.0
$3,350,000
🖨 Deal sheet (PDF) 📄 Offer letter ✓ Due diligence
Multi-family units
County records classify this as Multi-Family (5+ Unit). Listing-text estimate: 10 units. confirmed
5+ unit building — per-unit beds/baths from public records are typically unavailable; the breakdown below (if shown) is an estimate from the listing text.
Listing remarks MLS
Huge 650k Price Reduction! Once in a lifetime 100% Renovated 10-unit Master-leased opportunity and cash flowing at an impressive 7% Cap Rate from Day 1! The offering provides investors with a turnkey opportunity to purchase a premium asset where every single unit was vacated, completely renovated and leased at market rent. The building was entirely stripped to the studs and thoroughly renovated with permits featuring a new roof, electrical system, plumbing, HVAC, water heaters, and windows. Other upgrades include new cabinets, modern countertops, new flooring, recessed lighting, updated bathrooms with new vanities and sleek bathtubs, and stainless-steel appliances. The offering brings a diverse unit mix consisting of 5 (1bed/1bath) units and 5 (2bed/1bath) units including 3 brand-new ADUs. The property is separately metered for gas and electrical utilities and each unit has its own individual water heater to further reduce operating costs. Located in prime North Long Beach just minutes from the beach, offering investors the opportunity to acquire a low-maintenance asset in a coastal rental market without premium coastal pricing! Majority of the units are master-leased by a single organization providing guaranteed cash flow and minimal vacancies. (Similar to a hassle-free NNN deal with stable income and more limited landlord responsibilities with ease of management and rent collection).
Key facts
- New plumbing
- New hvac
- New water heaters
Tags
Neighborhood map
What this means for you Summary
Snapshot
- This is a 10 × 15-bed/10.0-bath units multifamily listed at $3.35M.
Deal economics
- At list price, monthly cash flow is $1k ($17k/yr) — positive. Per door: $138/mo.
- The deal already cash-flows at list — no discount required.
- To meet the 1% rule (rent ≥ 1% of price), the offer needs to be $2.81M (16.2% below list).
- Recommended offer: $2.81M (16.2% below list) — sets the bar for 1% rule.
- Cap rate 6.8% vs local median 1.9% in Long Beach — top-decile yield for the area; either an underpriced asset or a hidden risk that comps aren't pricing in. Stress-test before assuming the spread holds.
Location & tenants
- Location reads 67/100 on livability (#319 in CA) — a middle-class / working-renter tenant base. Strengths: amenities A+, commute A+, employment B+; Watch: health & safety C-, crime F, cost of living F.
- Long Beach Unified (urban): math 34% / reading 50% proficiency, ranked #216 of 517 in CA (top 42%) — families likely to look elsewhere, expect single-tenant / working-renter base with shorter leases.
- Zoned schools: Addams Elementary (math 19%, 775 students, 73% FRL); Lindsey Academy (math 16% / reading 28%, grade F, #388 of 498 statewide, top 80%, 725 students, 70% FRL); Jordan High (math 12% / reading 35%, grade F, #935 of 1,170 statewide, top 80%, 2,241 students, 66% FRL).
- Zoned-school proficiency averages 23% at this address vs 42% district-wide (-19 pts) — the specific schools serving this property underperform the Long Beach Unified average; the district grade overstates school quality for this exact location.
- Market conditions: Rents rising (+1.9%/yr); 100 active listings in the ZIP; 19,697 units permitted in Los Angeles County in 2024 (9,426 in 5+ unit buildings).
- At $28,070/mo this rent would consume 459% of the median local household income ($73k/yr) (locally 4834% of renters already pay >50% of income on rent) — very limited rent-growth headroom before tenants either downsize or default.
Forward outlook
- Local home prices are declining (-3.0%/yr); year-one equity from $23k of loan paydown is wiped out by about $100k of value loss. Plan a longer hold.
- Los Angeles County population projected at +9% by 2050 — modest demand growth; plan on rents tracking national, not racing it.
Negotiation context
- It's been on market 75 days — a 6% lower offer ($3.15M) is reasonable based on typical stale-listing flexibility.
- 8 sale attempts since 15y ago; this cycle's ask has dropped $200k (6%) from the opening price — seller is motivated, your offer sets the floor, not the list.
- Current owner paid $710k; list at $3.35M implies a 372% gain — meaningful room to come down on a strong offer.
Questions for the listing agent
- It's been on market 75 days. Have you received any prior offers? Is the seller open to a 16% concession, seller financing, or rate buy-down credit?
- Can we see the unit-by-unit rent roll, current vacancy, and any below-market leases? What's the average tenancy length?
- What capital expenditures (roof, boiler, parking lot, exteriors) have been made in the last 5 years, and what's planned in the next 2?
- Built in 1964 — when were the roof, HVAC, electrical panel, plumbing, and water heater last replaced?
- Why hasn't it sold? Are there any deal-killer items the seller is aware of (foundation, flood, title, zoning, code violations)?
- Is there a deadline driving the sale (1031 exchange, divorce, estate, relocation)? That informs how much negotiation room exists.
- Crime grade is F in this area — have there been break-ins, vandalism, or insurance claims at this property in the last 3 years? What carrier currently insures it and at what premium?
- The area grade is low — what's the realistic commute time and amenity access for the typical tenant pool here? Any planned neighborhood developments (good or bad) we should know about?
- What's the average days-on-market for RENTAL listings here right now (not sales)? A rising rental-DOM trend means longer vacancies and softer asking-rent achievability than the comps imply.
- What's the recent tenant-quality profile in this submarket — average credit score on applications, eviction rate, late-payment / NSF rate, and stable-employment percentage? A property-management company in the area should have these aggregated.
- How much new apartment / multifamily construction is in the pipeline within 1–3 miles? Heavy new supply (>2% of stock underway) typically softens rents 12–24 months out; light construction supports rent growth.
Investment metrics
- 1% rule
- 0.84% ✗
- Cap rate
- 6.79%
- Cash-on-cash
- 1.77%
- DSCR
- 1.08
- GRM
- 9.9
CMA / ARV
- ARV (median comp)
- $1,750,000
- List price
- $3,350,000
- Delta
- 91.43%
- Verdict
- OVERPRICED
- Comps
- 7 within 1.0 mi
Projected returns pro-forma
-3.0% appreciation · 1.95% rent growth · sell at horizon
- IRR
- -14.6%
- Equity multiple
- 0.48×
- Total profit
- $-485,316
- Equity at exit
- $499,496
- IRR
- -7.6%
- Equity multiple
- 0.54×
- Total profit
- $-431,490
- Equity at exit
- $289,647
Cash invested: $938,000 (down + closing). Projections, not guarantees.
Landlord ↔ Tenant lean methodology
- Overall (STATE)
- 18 Strongly Tenant-Friendly
- State California
- 18 Strongly Tenant-Friendly · D+13
- County
- — inherits STATE
- City
- — inherits STATE
ZIP-level market 90805
- Rents YoY
- 1.9%
- Active inventory
- 100
- Price-to-rent
- 99.5×
Monthly cashflow live
- Estimated rent
- $28,070 medium interval (Pro) →
- Mortgage (P&I)
- −$17,568
- Tax from tax record
- −$1,832 /mo · $21,979/yr
- Insurance
- −$1,396
- HOA
- −$0
- Vacancy / Maint / Mgmt
- −$5,895
- Net cashflow
- $1,380
Break-even live
Sensitivity live
| Price | -10% $3,277 | -5% $2,328 | +0% $1,380 | +5% $432 | +10% $-516 |
|---|---|---|---|---|---|
| Rent | -10% $-837 | -5% $271 | +0% $1,380 | +5% $2,489 | +10% $3,598 |
| Rate | -1.0pp $3,067 | -0.5pp $2,232 | base $1,380 | +0.5pp $512 | +1.0pp $-371 |
10-unit breakdown (identical units grouped — click to expand)
| Units | Beds | Baths | Est. rent |
|---|---|---|---|
| 10× units | 15 | 10 | $28,070 |
| #1 | 15 | 10 | $2,807 |
| #2 | 15 | 10 | $2,807 |
| #3 | 15 | 10 | $2,807 |
| #4 | 15 | 10 | $2,807 |
| #5 | 15 | 10 | $2,807 |
| #6 | 15 | 10 | $2,807 |
| #7 | 15 | 10 | $2,807 |
| #8 | 15 | 10 | $2,807 |
| #9 | 15 | 10 | $2,807 |
| #10 | 15 | 10 | $2,807 |
| Total (10 units) | $28,070 | ||
UW: 25.0% down · 7.5% · 30yr · 1.5% tax · 5.0% vac · 8.0% maint · 8.0% mgmt
Financing live
Cash to close
- Down payment
- $837,500
- Closing costs
- $100,500
- Reserves months
- —
- Total cash needed
- —
Loan-product check · same deal, 3 products live
Conventional
25% down · 7.5% · 30yr
- Down + closing
- —
- Monthly P&I
- —
- Monthly cashflow
- —
- DSCR
- —
- Eligible?
- —
Personal DTI + credit; lowest rate.
DSCR
20% down · 8.5% · 30yr
- Down + closing
- —
- Monthly P&I
- —
- Monthly cashflow
- —
- DSCR
- —
- Eligible?
- —
No personal income docs; deal must DSCR.
Hard money
10% down · 12.0% · 12mo
- Down + closing
- —
- Monthly P&I
- —
- Monthly cashflow
- —
- DSCR
- —
- Eligible?
- —
Short-term bridge; refi at stabilization.
Listing history 32 events
-
2026-06-21days on market $3,350,000 Active 75 DOM
-
2026-06-18days on market $3,350,000 Active 72 DOM
-
2026-06-17days on market $3,350,000 Active 71 DOM
-
2026-06-16days on market $3,350,000 Active 70 DOM
-
2026-06-15days on market $3,350,000 Active 69 DOM
-
2026-06-13days on market $3,350,000 Active 67 DOM
-
2026-06-13days on market $3,350,000 Active 66 DOM
-
2026-06-09days on market $3,350,000 Active 63 DOM
-
2026-06-08days on market $3,350,000 Active 62 DOM
-
2026-06-07days on market $3,350,000 Active 61 DOM
-
2026-06-04days on market $3,350,000 Active 58 DOM
-
2026-06-03days on market $3,350,000 Active 57 DOM
-
2026-06-02days on market $3,350,000 Active 56 DOM
-
2026-06-01days on market $3,350,000 Active 55 DOM
-
2026-05-31days on market $3,350,000 Active 54 DOM
-
2026-05-12price $3,350,000 1408-char remark
Show marketing remark (1408 chars)
Huge 650k Price Reduction! Once in a lifetime 100% Renovated 10-unit Master-leased opportunity and cash flowing at an impressive 7% Cap Rate from Day 1! The offering provides investors with a turnkey opportunity to purchase a premium asset where every single unit was vacated, completely renovated and leased at market rent. The building was entirely stripped to the studs and thoroughly renovated with permits featuring a new roof, electrical system, plumbing, HVAC, water heaters, and windows. Other upgrades include new cabinets, modern countertops, new flooring, recessed lighting, updated bathrooms with new vanities and sleek bathtubs, and stainless-steel appliances. The offering brings a diverse unit mix consisting of 5 (1bed/1bath) units and 5 (2bed/1bath) units including 3 brand-new ADUs. The property is separately metered for gas and electrical utilities and each unit has its own individual water heater to further reduce operating costs. Located in prime North Long Beach just minutes from the beach, offering investors the opportunity to acquire a low-maintenance asset in a coastal rental market without premium coastal pricing! Majority of the units are master-leased by a single organization providing guaranteed cash flow and minimal vacancies. (Similar to a hassle-free NNN deal with stable income and more limited landlord responsibilities with ease of management and rent collection).
-
2026-04-07$3,550,000 Active 1408-char remark
Show marketing remark (1408 chars)
Huge 650k Price Reduction! Once in a lifetime 100% Renovated 10-unit Master-leased opportunity and cash flowing at an impressive 7% Cap Rate from Day 1! The offering provides investors with a turnkey opportunity to purchase a premium asset where every single unit was vacated, completely renovated and leased at market rent. The building was entirely stripped to the studs and thoroughly renovated with permits featuring a new roof, electrical system, plumbing, HVAC, water heaters, and windows. Other upgrades include new cabinets, modern countertops, new flooring, recessed lighting, updated bathrooms with new vanities and sleek bathtubs, and stainless-steel appliances. The offering brings a diverse unit mix consisting of 5 (1bed/1bath) units and 5 (2bed/1bath) units including 3 brand-new ADUs. The property is separately metered for gas and electrical utilities and each unit has its own individual water heater to further reduce operating costs. Located in prime North Long Beach just minutes from the beach, offering investors the opportunity to acquire a low-maintenance asset in a coastal rental market without premium coastal pricing! Majority of the units are master-leased by a single organization providing guaranteed cash flow and minimal vacancies. (Similar to a hassle-free NNN deal with stable income and more limited landlord responsibilities with ease of management and rent collection).
-
2026-03-05price
-
2026-02-03Active
-
2026-01-07price
-
2025-12-04Active
-
2025-10-29price
-
2025-09-18Active
-
2023-02-13Active
-
2023-01-19Active
-
2020-10-07$1,350,000 Active
-
2020-09-17soldstatus $710,000 Closed Sale
-
2020-09-17soldstatus $710,000
-
2014-09-10soldstatus $925,000
-
2012-07-23soldstatus $600,000
-
2011-11-22historical
-
2011-11-03$715,000 Active
ⓘ Source: listings_history table (triggers on properties + properties_extension) + one-shot
backfill from property_details.listing_events for pre-trigger history.
Tax reassessment forecast CA · Resets to sale price
- Current annual tax
- $21,979 · $1,832/mo
- Projected year-2 tax
- $25,460 · $2,122/mo
- Expected delta
- +$3,481/yr (+$290/mo · 15.8%)
ⓘ Screening estimate from a state-policy table — verify with the county assessor before closing.
Climate risk First Street
- Flood 3/10 Moderate FEMA zone X · 20% chance over 30 yrs
- Wildfire 1/10 Low
- Heat 4/10 Moderate 7 d/yr ≥90°F today · 22 d/yr by 30 yrs out
- Wind 1/10 Low
- Air quality 6/10 Major 10 unhealthy d/yr today · 10 by 30 yrs out
Nearby sold comps map
Loading sold comps map…
Walkable amenities ~0.75 mi
Loading nearby amenities…
Taxation est. · year 1
- Rental income
- $336,840
- − Mortgage interest
- −$187,652
- − Property taxes
- −$21,979
- − Insurance
- −$16,750
- − Repairs & maintenance
- −$26,947
- − Management
- −$26,947
- − Depreciation
- −$97,455
- Taxable loss
- −$40,890
- Est. tax savings @ 24.0%
- +$9,814
- After-tax cash flow
- $26,375/yr
For passive investors: Depreciation is non-cash, so a rental often shows a tax loss while cash-flowing — sheltering income. Rental losses are passive: they offset passive income freely, and up to $25,000/yr can offset ordinary (W-2) income if you actively participate and your MAGI is under $100k (phasing out to $0 by $150k); unused losses carry forward. On sale, claimed depreciation is recaptured at up to 25%, and gains may owe capital-gains tax (a 1031 exchange can defer both). Figures are a year-1 estimate at your 24.0% rate — not tax advice; consult a CPA.
Schools (NCES district)
- District
- Long Beach Unified
- NCES district ID
- 0622500
- Math proficiency
- 34% ▼ -11.00%
- Reading proficiency
- 50% ▼ -4.00%
- Median HH income
- $56,092
- Composite
- 36.67/100
- National rank
- #4607
- State rank
- #216 of 517 in CA
Livability — Long Beach
- Score
- 67/100
- State rank
- #319
- US rank
- #10758
Category grades
Schools grade is shown separately in the Schools card above.
Census & demographics
- Census place
- Long Beach, CA
- County
- Los Angeles County · 9,444,647 people
- City population
- 466,088
- Metro
- Los Angeles-Long Beach-Anaheim, CA
- Population (ZIP)
- 92,402
- Household income
- $73,415
- Rent vs Own
- Severe rent burden
- 4834.0
Population outlook (Los Angeles County) Hauer SSP2
- Today (2025)
- 10,940,515 people
- By 2030
- 11,256,481 · +2.9%
- By 2040
- 11,729,929 · +7.2%
- By 2050
- 11,948,407 · +9.2%
- By 2075
- 11,818,114 · +8.0%
- By 2100
- 10,842,928 · -0.9%
Race, ethnicity, and origin ACS 2023
- Neighborhood character
- Diverse neighborhood (Simpson 0.60)
- Race & ethnicity
- Hispanic / Latino 59% Black 18% Two or more races 16% Asian 11% White 8% Native American 2%
- Hispanic origin (detail)
- Mexican 48%
- Common ancestry
- Lithuanian 1% Slovak 1%
- Foreign-born
- 30% · Canada, Vietnam
- Languages at home
- 41% English-only · Spanish 49% Other Asian/Pacific 5% Tagalog/Filipino 2%
Political lean MEDSL · Los Angeles
- 2024 margin
- Solid D (+32.9) · D 64.8% · R 31.9% · Other 3.3%
- 2008→2024 swing
- -7.4pp toward R · 2008: 40.4pp · 2024: 32.9pp
- All cycles
- 2024: D+32.9 2020: D+44.2 2016: D+48.0 2012: D+40.0 2008: D+40.4
Not yet ingested
- Civics
- —
Market trends
- HPI YoY
- ▼ -817.43%
- Current HPI
- 456.7913
- Rent YoY
- ▲ 1.95%
- Metro
- Los Angeles-Long Beach-Anaheim, CA
- State GDP YoY
- ▲ 3.21%
- F500 in state
- 116
Industry mix (Fortune 500 HQ in CA)
| Industry | F500 HQs | Revenue |
|---|---|---|
| Technology | 27 | $1,492B |
|
||
| Financial Services | 3 | $174B |
|
||
| Retail | 3 | $44B |
|
||
| Insurance | 3 | $26B |
|
||
| Media / Entertainment | 2 | $115B |
|
||
| Pharmaceuticals / Biotech | 2 | $62B |
|
||
Price history
+368.5% since first listed17 events — show timeline
- 2026-05-12 Price Changed $3,350,000 TheMLS
- 2026-04-07 Listed $3,550,000 TheMLS
- 2026-03-05 Price Changed — TheMLS
- 2026-02-03 Listed — TheMLS
- 2026-01-07 Price Changed — TheMLS
- 2025-12-04 Listed — TheMLS
- 2025-10-29 Price Changed — TheMLS
- 2025-09-18 Listed — TheMLS
- 2023-02-13 Listed — TheMLS
- 2023-01-19 Listed — TheMLS
- 2020-10-07 Listed $1,350,000 CRMLS
- 2020-09-17 Sold (Public Records) $710,000 Public Records
- 2020-09-17 Sold (MLS) $710,000 CRMLS
- 2014-09-10 Sold (Public Records) $925,000 Public Records
- 2012-07-23 Sold (Public Records) $600,000 Public Records
- 2011-11-22 Listing Removed — CRMLS
- 2011-11-03 Listed $715,000 CRMLS
Property tax history
+14.3%/yrLatest (2025): $21,979 · +4.7% YoY. Source: county tax records.
Cash-flow waterfall
monthlySold comps — $/sqft
last 12 mo · ≤1 miLoading sold comps…