14398 Bellflower Ln · Tuscaloosa, AL
Flood risk 1/10 · Minimal
- FEMA flood zone
- X (unshaded)
- Chance of flooding over 30 yrs
- 0.0%
- Est. flood insurance / yr
- $507 – $1,088
Fire risk 4/10 · Minor
- Est. fire insurance / yr
- $916 – $1,700
Heat risk 7/10 · Major
- Hot days now (above 108°F)
- 7 days/yr
- Hot days in 30 yrs
- 19 days/yr
Wind risk 6/10 · Moderate
- Chance of severe wind over 30 yrs
- 55.0%
Air-quality risk 2/10 · Minimal
- Unhealthy air days now
- 0 days/yr
- Unhealthy air days in 30 yrs
- 1 days/yr
Risk factors via First Street. Map © Google.
Why this score? — see what drove the D- grade
The composite is a weighted blend of 9 inputs, each scored 0–100. Each bar is that input's sub-score; the figure is the points it added to the 100-point composite (weight × sub-score).
- ARV discount +15.0/15.0
- Cash flow +7.6/30.0
- Rent growth +3.9/5.0
- Livability +3.9/5.0
- Schools +2.9/10.0
- Condition / age +2.5/5.0
- 1% rule +2.2/10.0
- DSCR +1.7/10.0
- Appreciation +0.0/10.0
$243,820
🖨 Deal sheet (PDF) 📄 Offer letter ✓ Due diligence
Listing remarks MLS
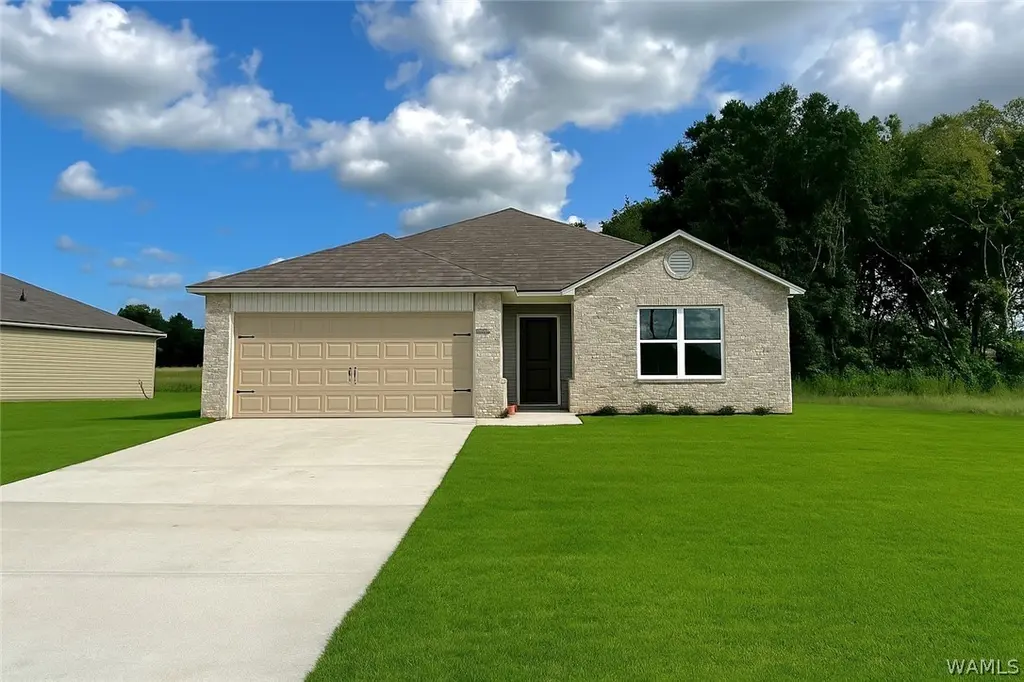
If you're looking for a new home with amazing value, this one checks all the boxes - including BLINDS, REFRIGERATOR, AND WASHER & DRYER already included! Welcome to this stunning 3-bedroom, 2-bath home with a floor plan that stands out. Unlike a typical open concept, this layout provides defined spaces while still offering a natural flow throughout. Each bedroom is generously sized, giving everyone room to relax and unwind. The primary suite includes a large walk-in closet, perfect for staying organized. Step outside to the covered back patio for morning coffee, outdoor dining, or entertaining year-round. With its smart design and beautiful features, this home is one-of-a-kind—you won’t want to miss it! Photos are renderings and stock photos of a completed “Foster" floor plan.
Key facts
- 7,841 sq ft lot
- 2 garage spots
- Built 2026
Neighborhood map
What this means for you Summary
Snapshot
- This is a 3-bed/2.0-bath single-family listed at $244k.
Deal economics
- At list price, monthly cash flow is $-291 ($-3k/yr) — negative.
- To cash-flow at today's rent, offer at most $202k (17.3% below list).
- To meet the 1% rule (rent ≥ 1% of price), the offer needs to be $176k (27.6% below list).
- Recommended offer: $176k (27.6% below list) — sets the bar for 1% rule.
- Cap rate 4.9% vs local median 3.4% in Tuscaloosa — top-decile yield for the area; either an underpriced asset or a hidden risk that comps aren't pricing in. Stress-test before assuming the spread holds.
Location & tenants
- Location reads 77/100 on livability (#9 in AL, #2,909 nationally) — a middle-class / working-renter tenant base. Strengths: amenities A+, health & safety A+, cost of living A; Watch: crime F, employment D-.
- Tuscaloosa County (suburban): math 21% / reading 45% proficiency, ranked #47 of 129 in AL (top 36%) — families likely to look elsewhere, expect single-tenant / working-renter base with shorter leases.
- Market conditions: Rents rising fast (+5.4%/yr); 462 active listings in the ZIP; 10 comparable units currently listed for rent nearby; rentals lingering (median 46d on market — plan ~5-8 weeks vacancy on turnover, expect pricing pressure); 70% of comp listings sitting > 30 days — soft ceiling on asking rent; 622 units permitted in Tuscaloosa County in 2024 (69 in 5+ unit buildings).
- This rent runs 34% of the median local income ($62k/yr) — at the standard rent-burdened threshold; future hikes will face affordability resistance.
Forward outlook
- Local home prices are declining (-3.0%/yr); year-one equity from $2k of loan paydown is wiped out by about $7k of value loss. Plan a longer hold.
- Tuscaloosa County population projected at +26% by 2050 — long-run rental-demand tailwind backs the buy-and-hold thesis.
Negotiation context
- It's been on market 55 days — a 3% lower offer ($237k) is reasonable based on typical stale-listing flexibility.
Risks & watch-outs
- Climate carrying-cost: major wind risk, 55% chance of damaging wind over 30y; extreme-heat days projected 7→19/yr by 2055 (HVAC capex compounding) — expect insurance premiums to compound above CPI over the hold.
Questions for the listing agent
- What do current leases actually rent for vs. the listed asking? Can we see a recent rent roll and the last 12 months of T-12 income?
- It's been on market 55 days. Have you received any prior offers? Is the seller open to a 28% concession, seller financing, or rate buy-down credit?
- Is there a deadline driving the sale (1031 exchange, divorce, estate, relocation)? That informs how much negotiation room exists.
- Crime grade is F in this area — have there been break-ins, vandalism, or insurance claims at this property in the last 3 years? What carrier currently insures it and at what premium?
- The area grade is low — what's the realistic commute time and amenity access for the typical tenant pool here? Any planned neighborhood developments (good or bad) we should know about?
- What's the average days-on-market for RENTAL listings here right now (not sales)? A rising rental-DOM trend means longer vacancies and softer asking-rent achievability than the comps imply.
- What's the recent tenant-quality profile in this submarket — average credit score on applications, eviction rate, late-payment / NSF rate, and stable-employment percentage? A property-management company in the area should have these aggregated.
- How much new for-sale + rental construction is in the pipeline within 1–3 miles? Heavy new supply typically softens prices + rents 12–24 months out; constrained supply supports both.
Investment metrics
- 1% rule
- 0.72% ✗
- Cap rate
- 4.86%
- Cash-on-cash
- -5.11%
- DSCR
- 0.77
- GRM
- 11.5
CMA / ARV
- ARV (median comp)
- $298,826
- List price
- $243,820
- Delta
- -18.41%
- Verdict
- UNDERPRICED
- Comps
- 20 within 1.0 mi
Show comp detail 9 sales within ~0.75 mi
| Address | Dist | Beds/Ba | Sqft | Sold | Price | $/sf | Match |
|---|---|---|---|---|---|---|---|
| 11318 Poppy Ct | 0.02mi | 4/2.0 (+1) | 1,444 (+7%) | 15mo | $244,900 | $170 | 71 |
| 11306 Poppy Ct | 0.02mi | 4/2.0 (+1) | 1,444 (+7%) | 16mo | $239,900 | $166 | 70 |
| 9218 Parkway Gardens Loop | 0.20mi | 4/2.0 (+1) | 1,497 (+10%) | 3mo | $274,900 | $184 | 66 |
| 9332 Parkway Gardens Loop | 0.32mi | 4/2.0 (+1) | 1,497 (+10%) | 3mo | $284,900 | $190 | 60 |
| 9294 Penrose Ln | 0.41mi | 3/2.0 | 1,548 (+14%) | 11mo | $265,000 | $171 | 48 |
| 9125 Cotton Field Cir | 0.72mi | 3/2.0 | 1,300 (-4%) | 14mo | $229,900 | $177 | 48 |
| 1252 Maxwell Cir | 0.69mi | 3/2.0 | 1,557 (+15%) | 3mo | $239,900 | $154 | 40 |
| 10293 Maxwell Way Way | 0.75mi | 4/2.0 (+1) | 1,544 (+14%) | 14mo | $254,900 | $165 | 25 |
| 9121 Cotton Field Cir | 0.72mi | 4/2.0 (+1) | 1,498 (+11%) | 23mo | $249,900 | $167 | 25 |
Match score weights: distance 35% · size 25% · config 20% · recency 20%. Top-matched comps best support the ARV.
Projected returns pro-forma
-3.0% appreciation · 5.42% rent growth · sell at horizon
- IRR
- -22.3%
- Equity multiple
- 0.21×
- Total profit
- $-53,594
- Equity at exit
- $36,354
- IRR
- -11.4%
- Equity multiple
- 0.25×
- Total profit
- $-51,420
- Equity at exit
- $21,081
Cash invested: $68,270 (down + closing). Projections, not guarantees.
Landlord ↔ Tenant lean methodology
- Overall (STATE)
- 90 Strongly Landlord-Friendly
- State Alabama
- 90 Strongly Landlord-Friendly · R+15
- County
- — inherits STATE
- City
- — inherits STATE
ZIP-level market 35405
- Home prices YoY
- -26.9%
- Rents YoY
- 5.4%
- Active inventory
- 462
- Price-to-rent
- 11.5×
Monthly cashflow live
- Estimated rent
- $1,765 high interval (Pro) →
- Mortgage (P&I)
- −$1,279
- Tax est. 1.5%
- −$305 /mo · $3,657/yr
- Insurance
- −$102
- HOA
- −$0
- Vacancy / Maint / Mgmt
- −$371
- Net cashflow
- $-291
Break-even live
Sensitivity live
| Price | -10% $-122 | -5% $-206 | +0% $-291 | +5% $-375 | +10% $-459 |
|---|---|---|---|---|---|
| Rent | -10% $-430 | -5% $-360 | +0% $-291 | +5% $-221 | +10% $-151 |
| Rate | -1.0pp $-168 | -0.5pp $-229 | base $-291 | +0.5pp $-354 | +1.0pp $-418 |
UW: 25.0% down · 7.5% · 30yr · 1.5% tax · 5.0% vac · 8.0% maint · 8.0% mgmt
Financing live
Cash to close
- Down payment
- $60,955
- Closing costs
- $7,315
- Reserves months
- —
- Total cash needed
- —
Loan-product check · same deal, 3 products live
Conventional
25% down · 7.5% · 30yr
- Down + closing
- —
- Monthly P&I
- —
- Monthly cashflow
- —
- DSCR
- —
- Eligible?
- —
Personal DTI + credit; lowest rate.
DSCR
20% down · 8.5% · 30yr
- Down + closing
- —
- Monthly P&I
- —
- Monthly cashflow
- —
- DSCR
- —
- Eligible?
- —
No personal income docs; deal must DSCR.
Hard money
10% down · 12.0% · 12mo
- Down + closing
- —
- Monthly P&I
- —
- Monthly cashflow
- —
- DSCR
- —
- Eligible?
- —
Short-term bridge; refi at stabilization.
Rent comps 10 comps
| Address | Beds | Baths | Sqft | Rent | $/sqft | DOM | Units | Dist |
|---|---|---|---|---|---|---|---|---|
| 9576 Havenridge Loop Tuscaloosa, AL | 3.0 | 2.0 | 1493 | $1,795 | $1.20 | 45d | 1 | 0.13mi |
| 9594 Havenridge Loop Tuscaloosa, AL | 3.0 | 2.0 | 1679 | $1,795 | $1.07 | 45d | 1 | 0.14mi |
| 9295 Havenridge Loop Tuscaloosa, AL | 4.0 | 2.0 | 1583 | $1,745 | $1.10 | 45d | 1 | 0.15mi |
| 9230 Parkway Gardens Loop Tuscaloosa, AL | 4.0 | 2.0 | 1774 | $1,995 | $1.12 | 45d | 1 | 0.19mi |
| 9212 Parkway Gardens Loop Tuscaloosa, AL | 4.0 | 2.0 | 1774 | $1,796 | $1.01 | 45d | 1 | 0.20mi |
| 9332 Parkway Gardens Loop Tuscaloosa, AL | 4.0 | 2.0 | 1497 | $1,706 | $1.14 | 45d | 1 | 0.31mi |
| 1451 Maxwell Cir Tuscaloosa, AL | 4.0 | 2.0 | 1498 | $1,745 | $1.16 | 23d | 1 | 0.81mi |
| 9046 Cotton Field Cir Tuscaloosa, AL | 3.0 | 2.0 | 1478 | $1,645 | $1.11 | 45d | 1 | 0.84mi |
| 146 Wexford Way Tuscaloosa, AL | 4.0 | 2.0 | 1498 | $1,745 | $1.16 | 23d | 1 | 0.93mi |
| 9717 Full Moon Cir Tuscaloosa, AL | 3.0 | 2.0 | 1278 | $1,550 | $1.21 | 15d | 1 | 1.26mi |
Listing history 2 events
-
2026-05-11price $243,820 816-char remark
Show marketing remark (816 chars)
If you're looking for a new home with amazing value, this one checks all the boxes - including BLINDS, REFRIGERATOR, AND WASHER & DRYER already included! Welcome to this stunning 3-bedroom, 2-bath home with a floor plan that stands out. Unlike a typical open concept, this layout provides defined spaces while still offering a natural flow throughout. Each bedroom is generously sized, giving everyone room to relax and unwind. The primary suite includes a large walk-in closet, perfect for staying organized. Step outside to the covered back patio for morning coffee, outdoor dining, or entertaining year-round. With its smart design and beautiful features, this home is one-of-a-kind—you won’t want to miss it! Photos are renderings and stock photos of a completed “Foster" floor plan.
-
2026-04-01$243,020 Active 816-char remark
Show marketing remark (816 chars)
If you're looking for a new home with amazing value, this one checks all the boxes - including BLINDS, REFRIGERATOR, AND WASHER & DRYER already included! Welcome to this stunning 3-bedroom, 2-bath home with a floor plan that stands out. Unlike a typical open concept, this layout provides defined spaces while still offering a natural flow throughout. Each bedroom is generously sized, giving everyone room to relax and unwind. The primary suite includes a large walk-in closet, perfect for staying organized. Step outside to the covered back patio for morning coffee, outdoor dining, or entertaining year-round. With its smart design and beautiful features, this home is one-of-a-kind—you won’t want to miss it! Photos are renderings and stock photos of a completed “Foster" floor plan.
ⓘ Source: listings_history table (triggers on properties + properties_extension) + one-shot
backfill from property_details.listing_events for pre-trigger history.
Climate risk First Street
- Flood 1/10 Low FEMA zone X (unshaded) · 0% chance over 30 yrs
- Wildfire 4/10 Moderate
- Heat 7/10 Severe 7 d/yr ≥108°F today · 19 d/yr by 30 yrs out
- Wind 6/10 Major 55% chance of damaging wind over 30 yrs
- Air quality 2/10 Low 0 unhealthy d/yr today · 1 by 30 yrs out
Nearby sold comps map
Loading sold comps map…
Walkable amenities ~0.75 mi
Loading nearby amenities…
Taxation est. · year 1
- Rental income
- $21,180
- − Mortgage interest
- −$13,658
- − Property taxes
- −$3,657
- − Insurance
- −$1,219
- − Repairs & maintenance
- −$1,694
- − Management
- −$1,694
- − Depreciation
- −$7,093
- Taxable loss
- −$7,836
- Est. tax savings @ 24.0%
- +$1,881
- After-tax cash flow
- $-1,607/yr
For passive investors: Depreciation is non-cash, so a rental often shows a tax loss while cash-flowing — sheltering income. Rental losses are passive: they offset passive income freely, and up to $25,000/yr can offset ordinary (W-2) income if you actively participate and your MAGI is under $100k (phasing out to $0 by $150k); unused losses carry forward. On sale, claimed depreciation is recaptured at up to 25%, and gains may owe capital-gains tax (a 1031 exchange can defer both). Figures are a year-1 estimate at your 24.0% rate — not tax advice; consult a CPA.
Schools (NCES district)
- District
- Tuscaloosa County
- NCES district ID
- 0103390
- Math proficiency
- 21% ▼ -24.00%
- Reading proficiency
- 45% ▲ 2.00%
- Median HH income
- $53,000
- Composite
- 28.88/100
- National rank
- #6641
- State rank
- #47 of 129 in AL
Livability — Tuscaloosa
- Score
- 77/100
- State rank
- #9
- US rank
- #2909
Category grades
Schools grade is shown separately in the Schools card above.
Census & demographics
- County
- Tuscaloosa County · 206,491 people
- City population
- 134,228
- Metro
- Tuscaloosa, AL
- Population (ZIP)
- 49,420
- Household income
- $62,301
- Rent vs Own
- Severe rent burden
- 1963.0
Population outlook (Tuscaloosa County) Hauer SSP2
- Today (2025)
- 228,293 people
- By 2030
- 240,551 · +5.4%
- By 2040
- 263,856 · +15.6%
- By 2050
- 286,491 · +25.5%
- By 2075
- 335,783 · +47.1%
- By 2100
- 370,520 · +62.3%
Race, ethnicity, and origin ACS 2023
- Neighborhood character
- Diverse neighborhood (Simpson 0.56)
- Race & ethnicity
- Black 56% White 35% Hispanic / Latino 5% Two or more races 3% Asian 2%
- Hispanic origin (detail)
- Mexican 2%
- Common ancestry
- Italian 1% Lithuanian 1% Slovak 1%
- Foreign-born
- 5% · Canada, China
- Languages at home
- 94% English-only · Spanish 4% Other Indo-European 1% Chinese 1%
Political lean MEDSL · Tuscaloosa
- 2024 margin
- Strong R (+20.4) · D 39.4% · R 59.8%
- 2008→2024 swing
- -4.4pp toward R · 2008: -16.0pp · 2024: -20.4pp
- All cycles
- 2024: R+20.4 2020: R+14.8 2016: R+19.5 2012: R+17.4 2008: R+16.0
Not yet ingested
- Civics
- —
Market trends
- HPI YoY
- ▼ -71.25%
- Current HPI
- 193.1929
- Rent YoY
- ▲ 5.42%
- Metro
- Tuscaloosa, AL
- State GDP YoY
- ▲ 2.94%
- F500 in state
- 4
Industry mix (Fortune 500 HQ in AL)
| Industry | F500 HQs | Revenue |
|---|---|---|
| Financial Services | 1 | $8B |
|
||
| Healthcare | 1 | $5B |
|
||
Price history
+0.3% since first listed2 events — show timeline
- 2026-05-11 Price Changed $243,820 WAMLS
- 2026-04-01 Listed $243,020 WAMLS
Cash-flow waterfall
monthlySold comps — $/sqft
last 12 mo · ≤1 miLoading sold comps…