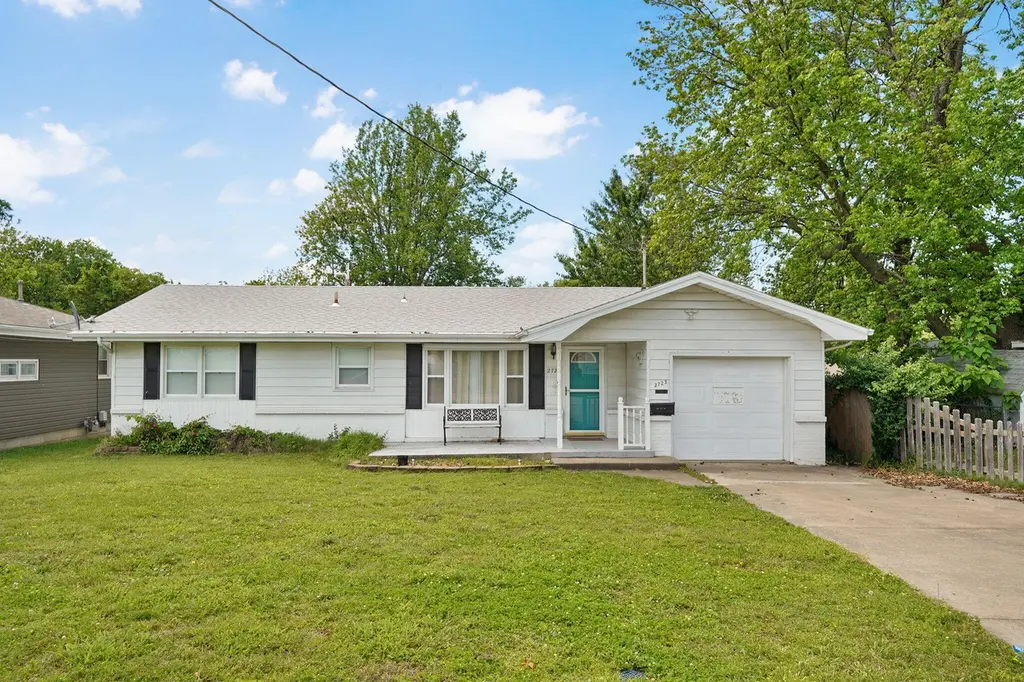
2723 N Missouri Ave · Springfield, MO
Flood risk 1/10 · Minimal
- FEMA flood zone
- X (unshaded)
- Chance of flooding over 30 yrs
- 0.0%
- Est. flood insurance / yr
- $507 – $1,088
Fire risk 2/10 · Minimal
- Est. fire insurance / yr
- $1,054 – $1,958
Heat risk 5/10 · Moderate
- Hot days now (above 105°F)
- 7 days/yr
- Hot days in 30 yrs
- 19 days/yr
Wind risk 2/10 · Minimal
- Chance of severe wind over 30 yrs
- 0.0%
Air-quality risk 2/10 · Minimal
- Unhealthy air days now
- 1 days/yr
- Unhealthy air days in 30 yrs
- 2 days/yr
Risk factors via First Street. Map © Google.
Why this score? — see what drove the F grade
The composite is a weighted blend of 9 inputs, each scored 0–100. Each bar is that input's sub-score; the figure is the points it added to the 100-point composite (weight × sub-score).
- Cash flow +12.0/30.0
- Livability +3.8/5.0
- DSCR +3.6/10.0
- Rent growth +3.6/5.0
- Schools +3.2/10.0
- ARV discount +2.8/15.0
- 1% rule +2.5/10.0
- Condition / age +2.5/5.0
- Appreciation +0.0/10.0
$165,000
🖨 Deal sheet 📄 Offer letter ✓ Due diligence
Listing remarks MLS
Welcome home to 2723 N Missouri Ave! This home is adorable and will make the perfect fit for any type of buyer-- it is built well and has been taken care of immaculately! This seller has lived in this home for the past 25 years! This home would be great for entertaining and relaxation! This 2 living area, 3 bedroom, 1.5 bathroom, 1 car garage, and large backyard home has everything you need! It features real hardwood floors underneath the plush berber carpet, has a large kitchen that has all electric appliances, and a main bathroom with a great big vanity and bathtub/shower combo! You will find that this home has more square footage than most of the similar homes in the neighborhood because of an addition that was completed prior to this seller-- this is a great feature to gain another living space! This home also has a new roof that was installed in December 2022! In the backyard, you will notice a large concrete pad that would be perfect for an above ground pool or an outdoor kitchen - the options are endless! Call today to view this very well maintained home before it's gone at this great price!
Key facts
- 0.25 acre lot
- Garage
- Built 1968
Property features AI
Finance
- Other: Listing broker: Keller Williams
Exterior
- Parking: Driveway; 1-car garage with front-facing garage
- Utilities: Public water; Public sewer
- Home design: Single-family residence; One level
- Construction: Not specified
- Exterior features: Quarter-acre lot; Subdivision: Broadway Acres
Interior
- Kitchen: Electric oven; Free‑standing electric oven; Dishwasher
- Bedrooms: Not specified
- Flooring: Carpet; Tile; Hardwood
- Bathrooms: 1 full bathroom; 1 half bathroom
- Heating & cooling: Natural gas forced-air heating; Central air conditioning; Ceiling fans
- Interior features: Laminate counters
- Laundry & utility: Laundry on main level
Neighborhood map
What this means for you Summary
Snapshot
- This is a 3-bed/1.5-bath single-family listed at $165k.
Deal economics
- At list price, monthly cash flow is $-38 ($-458/yr) — negative.
- To cash-flow at today's rent, offer at most $158k (4.1% below list).
- To meet the 1% rule (rent ≥ 1% of price), the offer needs to be $124k (24.8% below list).
- Recommended offer: $124k (24.8% below list) — sets the bar for 1% rule.
- Cap rate 6.0% vs local median 4.6% in Springfield — top-decile yield for the area; either an underpriced asset or a hidden risk that comps aren't pricing in. Stress-test before assuming the spread holds.
Location & tenants
- Location reads 75/100 on livability (#57 in MO, #4,121 nationally) — a middle-class / working-renter tenant base. Strengths: commute A+, cost of living A+, housing A+; Watch: crime F, employment F.
- Springfield R-XII (urban): math 32% / reading 46% proficiency, ranked #174 of 324 in MO (top 54%) — families likely to look elsewhere, expect single-tenant / working-renter base with shorter leases.
- Zoned schools: Watkins Elem. (math 17% / reading 32%, grade F, #879 of 1,115 statewide, top 81%, 250 students, 82% FRL); Hillcrest High (math 9% / reading 35%, grade F, #462 of 521 statewide, top 90%, 1,017 students, 64% FRL) — zoned schools average 73% FRL vs 46% district-wide (26 pts higher); higher-poverty schools than district average — tighter screening recommended.
- Zoned-school proficiency averages 23% at this address vs 39% district-wide (-16 pts) — the specific schools serving this property underperform the Springfield R-XII average; the district grade overstates school quality for this exact location.
- Market conditions: Rents rising fast (+4.2%/yr); 394 active listings in the ZIP; 15 comparable units currently listed for rent nearby; rentals at typical pace (median 24d on market — plan ~3-4 weeks tenant-placement turnaround); 47% of comp listings sitting > 30 days — soft ceiling on asking rent; 1,302 units permitted in Greene County in 2024 (250 in 5+ unit buildings).
Forward outlook
- Local home prices are declining (-3.0%/yr); year-one equity from $1k of loan paydown is wiped out by about $5k of value loss. Plan a longer hold.
- Greene County population projected at +25% by 2050 — long-run rental-demand tailwind backs the buy-and-hold thesis.
Negotiation context
- Only 3 days on market — expect competitive offers; lowballing is unlikely to land.
- 2 sale attempts since 3y ago with the ask held roughly flat each time — persistent listings suggest the price (not the market) is what's stuck; bring a comps-based counter.
Risks & watch-outs
- Climate carrying-cost: extreme-heat days projected 7→19/yr by 2055 (HVAC capex compounding) — expect insurance premiums to compound above CPI over the hold.
Questions for the listing agent
- What do current leases actually rent for vs. the listed asking? Can we see a recent rent roll and the last 12 months of T-12 income?
- Built in 1968 — when were the roof, HVAC, electrical panel, plumbing, and water heater last replaced?
- Is there a deadline driving the sale (1031 exchange, divorce, estate, relocation)? That informs how much negotiation room exists.
- Crime grade is F in this area — have there been break-ins, vandalism, or insurance claims at this property in the last 3 years? What carrier currently insures it and at what premium?
- The area grade is low — what's the realistic commute time and amenity access for the typical tenant pool here? Any planned neighborhood developments (good or bad) we should know about?
- What's the average days-on-market for RENTAL listings here right now (not sales)? A rising rental-DOM trend means longer vacancies and softer asking-rent achievability than the comps imply.
- What's the recent tenant-quality profile in this submarket — average credit score on applications, eviction rate, late-payment / NSF rate, and stable-employment percentage? A property-management company in the area should have these aggregated.
- How much new for-sale + rental construction is in the pipeline within 1–3 miles? Heavy new supply typically softens prices + rents 12–24 months out; constrained supply supports both.
Investment metrics
- 1% rule
- 0.75% ✗
- Cap rate
- 6.02%
- Cash-on-cash
- -0.99%
- DSCR
- 0.96
- GRM
- 11.1
CMA / ARV
- ARV (on-the-fly)
- $149,424
- Comps found
- 12
Show comp detail 12 sales within ~0.75 mi
| Address | Dist | Beds/Ba | Sqft | Sold | Price | $/sf | Match |
|---|---|---|---|---|---|---|---|
| 919 W Woodridge St | 0.07mi | 3/2.0 | 1,088 (-4%) | 4mo | $149,500 | $137 | 85 |
| 733 W Kerr St | 0.13mi | 3/1.0 | 1,188 (+5%) | 2mo | $185,000 | $156 | 82 |
| 2755 N Campbell Ave | 0.38mi | 3/2.0 | 1,137 (+0%) | 0mo | $172,000 | $151 | 79 |
| 1141 W Talmage St | 0.30mi | 3/1.0 | 1,074 (-5%) | 3mo | $149,900 | $140 | 73 |
| 2525 N Campbell Ave | 0.43mi | 3/1.0 | 1,216 (+7%) | 3mo | $159,000 | $131 | 63 |
| 2324 N Concord Ave | 0.53mi | 3/1.0 | 1,064 (-6%) | 3mo | $90,000 | $85 | 61 |
| 1123 W High St | 0.70mi | 3/1.0 | 1,148 (+1%) | 5mo | $139,500 | $122 | 58 |
| 2736 N Fort Ave | 0.34mi | 3/1.0 | 984 (-13%) | 4mo | $130,000 | $132 | 57 |
| 2323 N Missouri Ave | 0.49mi | 3/1.0 | 1,254 (+11%) | 1mo | $179,900 | $143 | 56 |
| 2427 N Boonville Ave | 0.56mi | 2/1.5 (-1) | 1,188 (+5%) | 8mo | $139,900 | $118 | 54 |
| 2312 N Main Ave | 0.58mi | 3/1.0 | 1,018 (-10%) | 3mo | $130,000 | $128 | 52 |
| 2243 N Franklin Ave | 0.62mi | 2/1.0 (-1) | 1,260 (+11%) | 3mo | $150,000 | $119 | 43 |
Match score weights: distance 35% · size 25% · config 20% · recency 20%. Top-matched comps best support the ARV.
Projected returns pro-forma
-3.0% appreciation · 4.24% rent growth · sell at horizon
- IRR
- -16.7%
- Equity multiple
- 0.40×
- Total profit
- $-27,655
- Equity at exit
- $24,602
- IRR
- -6.7%
- Equity multiple
- 0.55×
- Total profit
- $-20,838
- Equity at exit
- $14,266
Cash invested: $46,200 (down + closing). Projections, not guarantees.
Landlord ↔ Tenant lean methodology
- Overall (STATE)
- 81 Strongly Landlord-Friendly
- State Missouri
- 81 Strongly Landlord-Friendly · R+10
- County
- — inherits STATE
- City
- — inherits STATE
ZIP-level market 65803
- Home prices YoY
- -29.8%
- Rents YoY
- 4.2%
- Active inventory
- 394
- Price-to-rent
- 11.1×
Monthly cashflow live
- Estimated rent
- $1,241 high interval (Pro) →
- Mortgage (P&I)
- −$865
- Tax from tax record
- −$85 /mo · $1,018/yr
- Insurance
- −$69
- HOA
- −$0
- Vacancy / Maint / Mgmt
- −$261
- Net cashflow
- $-38
Break-even live
UW: 25.0% down · 7.5% · 30yr · 1.5% tax · 5.0% vac · 8.0% maint · 8.0% mgmt
Financing live
Cash to close
- Down payment
- $41,250
- Closing costs
- $4,950
- Reserves months
- —
- Total cash needed
- —
Loan-product check · same deal, 3 products live
Conventional
25% down · 7.5% · 30yr
- Down + closing
- —
- Monthly P&I
- —
- Monthly cashflow
- —
- DSCR
- —
- Eligible?
- —
Personal DTI + credit; lowest rate.
DSCR
20% down · 8.5% · 30yr
- Down + closing
- —
- Monthly P&I
- —
- Monthly cashflow
- —
- DSCR
- —
- Eligible?
- —
No personal income docs; deal must DSCR.
Hard money
10% down · 12.0% · 12mo
- Down + closing
- —
- Monthly P&I
- —
- Monthly cashflow
- —
- DSCR
- —
- Eligible?
- —
Short-term bridge; refi at stabilization.
Rent comps 15 comps
| Address | Beds | Baths | Sqft | Rent | $/sqft | DOM | Units | Dist |
|---|---|---|---|---|---|---|---|---|
| 1127 W Talmage St Springfield, MO | 3.0 | 2.0 | 1160 | $1,650 | $1.42 | 43d | 1 | 0.28mi |
| 2230 N Campbell Ave Springfield, MO | 2.0 | 1.0 | 1084 | $1,095 | $1.01 | 43d | 1 | 0.74mi |
| 2120 N Johnston Ave Springfield, MO | 2.0 | 1.0 | 880 | $925 | $1.05 | 43d | 1 | 0.81mi |
| 407 E Dale St Apt B Springfield, MO | 2.0 | 1.0 | 720 | $795 | $1.10 | 13d | 1 | 1.02mi |
| 2126 N Lexington Ave Springfield, MO | 2.0 | 1.0 | 990 | $895 | $0.90 | 13d | 1 | 1.05mi |
| 2117 N Lexington Ave Springfield, MO | 3.0 | 1.0 | 1040 | $1,195 | $1.15 | 43d | 1 | 1.08mi |
| 2034 N Washington Ave Springfield, MO | 2.0 | 1.0 | 800 | $875 | $1.09 | 43d | 1 | 1.20mi |
| 317 E Chase St Springfield, MO | 2.0 | 2.0 | 915 | $1,100 | $1.20 | 43d | 1 | 1.20mi |
| 2940 N East Ave Springfield, MO | 2.0 | 2.0 | 915 | $700 | $0.77 | 13d | 1 | 1.22mi |
| 203 W Commercial St Unit 2F Springfield, MO | 2.0 | 1.0 | 1000 | $1,150 | $1.15 | 21d | 1 | 1.26mi |
| 1034 E McCanse St Springfield, MO | 3.0 | 1.0 | 910 | $1,150 | $1.26 | 23d | 1 | 1.31mi |
| 805 E Garfield St Springfield, MO | 2.0 | 1.0 | 950 | $950 | $1.00 | 13d | 1 | 1.32mi |
| 603 W Division St Springfield, MO | 2.0 | 1.0 | 816 | $995 | $1.22 | 13d | 1 | 1.43mi |
| 2508 N National Ave Springfield, MO | 4.0 | 2.0 | 866 | $1,195 | $1.38 | 13d | 1 | 1.45mi |
| 1530 N Robberson Ave Springfield, MO | 3.0 | 2.0 | 1122 | $1,425 | $1.27 | 43d | 1 | 1.48mi |
Listing history 6 events
-
2026-05-11status Pending
-
2026-05-08$165,000 Active
-
2023-05-03soldstatus
-
2023-04-19soldstatus Closed 1125-char remark
Show marketing remark (1125 chars)
Welcome home to 2723 N Missouri Ave! This home is adorable and will make the perfect fit for any type of buyer-- it is built well and has been taken care of immaculately! This seller has lived in this home for the past 25 years! This home would be great for entertaining and relaxation! This 2 living area, 3 bedroom, 1.5 bathroom, 1 car garage, and large backyard home has everything you need! It features real hardwood floors underneath the plush berber carpet, has a large kitchen that has all electric appliances, and a main bathroom with a great big vanity and bathtub/shower combo! You will find that this home has more square footage than most of the similar homes in the neighborhood because of an addition that was completed prior to this seller-- this is a great feature to gain another living space! This home also has a new roof that was installed in December 2022! In the backyard, you will notice a large concrete pad that would be perfect for an above ground pool or an outdoor kitchen - the options are endless! Call today to view this very well maintained home before it's gone at this great price!
-
2023-03-26status Pending 1125-char remark
Show marketing remark (1125 chars)
Welcome home to 2723 N Missouri Ave! This home is adorable and will make the perfect fit for any type of buyer-- it is built well and has been taken care of immaculately! This seller has lived in this home for the past 25 years! This home would be great for entertaining and relaxation! This 2 living area, 3 bedroom, 1.5 bathroom, 1 car garage, and large backyard home has everything you need! It features real hardwood floors underneath the plush berber carpet, has a large kitchen that has all electric appliances, and a main bathroom with a great big vanity and bathtub/shower combo! You will find that this home has more square footage than most of the similar homes in the neighborhood because of an addition that was completed prior to this seller-- this is a great feature to gain another living space! This home also has a new roof that was installed in December 2022! In the backyard, you will notice a large concrete pad that would be perfect for an above ground pool or an outdoor kitchen - the options are endless! Call today to view this very well maintained home before it's gone at this great price!
-
2023-03-25$147,500 Active 1125-char remark
Show marketing remark (1125 chars)
Welcome home to 2723 N Missouri Ave! This home is adorable and will make the perfect fit for any type of buyer-- it is built well and has been taken care of immaculately! This seller has lived in this home for the past 25 years! This home would be great for entertaining and relaxation! This 2 living area, 3 bedroom, 1.5 bathroom, 1 car garage, and large backyard home has everything you need! It features real hardwood floors underneath the plush berber carpet, has a large kitchen that has all electric appliances, and a main bathroom with a great big vanity and bathtub/shower combo! You will find that this home has more square footage than most of the similar homes in the neighborhood because of an addition that was completed prior to this seller-- this is a great feature to gain another living space! This home also has a new roof that was installed in December 2022! In the backyard, you will notice a large concrete pad that would be perfect for an above ground pool or an outdoor kitchen - the options are endless! Call today to view this very well maintained home before it's gone at this great price!
ⓘ Source: listings_history table (triggers on properties + properties_extension) + one-shot
backfill from property_details.listing_events for pre-trigger history.
Tax reassessment forecast MO · Resets to sale price
- Current annual tax
- $1,018 · $85/mo
- Projected year-2 tax
- $1,600 · $133/mo
- Expected delta
- +$582/yr (+$49/mo · 57.2%)
ⓘ Screening estimate from a state-policy table — verify with the county assessor before closing.
Climate risk First Street
- Flood 1/10 Low FEMA zone X (unshaded) · 0% chance over 30 yrs
- Wildfire 2/10 Low
- Heat 5/10 Major 7 d/yr ≥105°F today · 19 d/yr by 30 yrs out
- Wind 2/10 Low 0% chance of damaging wind over 30 yrs
- Air quality 2/10 Low 1 unhealthy d/yr today · 2 by 30 yrs out
Nearby sold comps map
Loading sold comps map…
Walkable amenities ~0.75 mi
Loading nearby amenities…
Taxation est. · year 1
- Rental income
- $14,897
- − Mortgage interest
- −$9,243
- − Property taxes
- −$1,018
- − Insurance
- −$825
- − Repairs & maintenance
- −$1,192
- − Management
- −$1,192
- − Depreciation
- −$4,800
- Taxable loss
- −$3,372
- Est. tax savings @ 24.0%
- +$809
- After-tax cash flow
- $352/yr
For passive investors: Depreciation is non-cash, so a rental often shows a tax loss while cash-flowing — sheltering income. Rental losses are passive: they offset passive income freely, and up to $25,000/yr can offset ordinary (W-2) income if you actively participate and your MAGI is under $100k (phasing out to $0 by $150k); unused losses carry forward. On sale, claimed depreciation is recaptured at up to 25%, and gains may owe capital-gains tax (a 1031 exchange can defer both). Figures are a year-1 estimate at your 24.0% rate — not tax advice; consult a CPA.
Schools (NCES district)
- District
- Springfield R-XII
- NCES district ID
- 2928860
- Math proficiency
- 32% ▼ -2.00%
- Reading proficiency
- 46% ▼ -3.00%
- Median HH income
- $37,886
- Composite
- 32.45/100
- National rank
- #5717
- State rank
- #174 of 324 in MO
Livability — Springfield
- Score
- 75/100
- State rank
- #57
- US rank
- #4121
Category grades
Schools grade is shown separately in the Schools card above.
Census & demographics
- Census place
- Springfield, MO
- County
- Greene County · 244,327 people
- City population
- 223,044
- Metro
- Springfield, MO
- Population (ZIP)
- 42,882
- Household income
- $50,572
- Rent vs Own
- Severe rent burden
- 1305.0
Population outlook (Greene County) Hauer SSP2
- Today (2025)
- 319,054 people
- By 2030
- 335,135 · +5.0%
- By 2040
- 366,186 · +14.8%
- By 2050
- 397,431 · +24.6%
- By 2075
- 477,035 · +49.5%
- By 2100
- 520,828 · +63.2%
Race, ethnicity, and origin ACS 2023
- Neighborhood character
- Predominantly White (82%)
- Race & ethnicity
- White 82% Two or more races 9% Hispanic / Latino 6% Black 4%
- Hispanic origin (detail)
- Mexican 2% Puerto Rican 2%
- Common ancestry
- Lithuanian 2% Italian 2% Iranian 2%
- Foreign-born
- 3% · Canada
- Languages at home
- 95% English-only · Spanish 3%
Political lean MEDSL · Greene
- 2024 margin
- Strong R (+20.8) · D 38.9% · R 59.7% · Other 1.4%
- 2008→2024 swing
- -5.0pp toward R · 2008: -15.8pp · 2024: -20.8pp
- All cycles
- 2024: R+20.8 2020: R+20.1 2016: R+27.4 2012: R+24.4 2008: R+15.8
Not yet ingested
- Civics
- —
Market trends
- HPI YoY
- ▼ -87.08%
- Current HPI
- 205.0439
- Rent YoY
- ▲ 4.24%
- Metro
- Springfield, MO
- State GDP YoY
- ▲ 1.84%
- F500 in state
- 20
Industry mix (Fortune 500 HQ in MO)
| Industry | F500 HQs | Revenue |
|---|---|---|
| Healthcare | 1 | $163B |
|
||
| Insurance | 1 | $21B |
|
||
| Industrial Technology | 1 | $17B |
|
||
| Retail | 1 | $16B |
|
||
| Industrial Distribution | 1 | $10B |
|
||
| Utilities | 1 | $9B |
|
||
Price history
+11.9% since first listed6 events — show timeline
- 2026-05-11 Pending — SOMO
- 2026-05-08 Listed $165,000 SOMO
- 2023-05-03 Sold (Public Records) — Public Records
- 2023-04-19 Sold (MLS) — SOMO
- 2023-03-26 Pending — SOMO
- 2023-03-25 Listed $147,500 SOMO
Property tax history
+3.2%/yrLatest (2025): $1,018 · +7.8% YoY. Source: county tax records.
Cash-flow waterfall
monthlySold comps — $/sqft
last 12 mo · ≤1 miLoading sold comps…