4940 Landmark Cir #3232 · Egg Harbor, WI
Flood risk 1/10 · Minimal
- FEMA flood zone
- X (unshaded)
- Chance of flooding over 30 yrs
- 0.0%
- Est. flood insurance / yr
- $473 – $860
Fire risk 1/10 · Minimal
- Est. fire insurance / yr
- $636 – $1,182
Heat risk 1/10 · Minimal
- Hot days now (above 89°F)
- 7 days/yr
- Hot days in 30 yrs
- 13 days/yr
Wind risk 1/10 · Minimal
- Chance of severe wind over 30 yrs
- —
Air-quality risk 2/10 · Minimal
- Unhealthy air days now
- 1 days/yr
- Unhealthy air days in 30 yrs
- 1 days/yr
Risk factors via First Street. Map © Google.
Why this score? — see what drove the D+ grade
The composite is a weighted blend of 9 inputs, each scored 0–100. Each bar is that input's sub-score; the figure is the points it added to the 100-point composite (weight × sub-score).
- ARV discount +15.0/15.0
- 1% rule +8.0/10.0
- Appreciation +7.3/10.0
- Cash flow +6.0/30.0
- Schools +4.6/10.0
- Livability +3.3/5.0
- Rent growth +2.5/5.0
- Condition / age +2.2/5.0
- DSCR +0.4/10.0
$118,000
🖨 Deal sheet 📄 Offer letter ✓ Due diligence
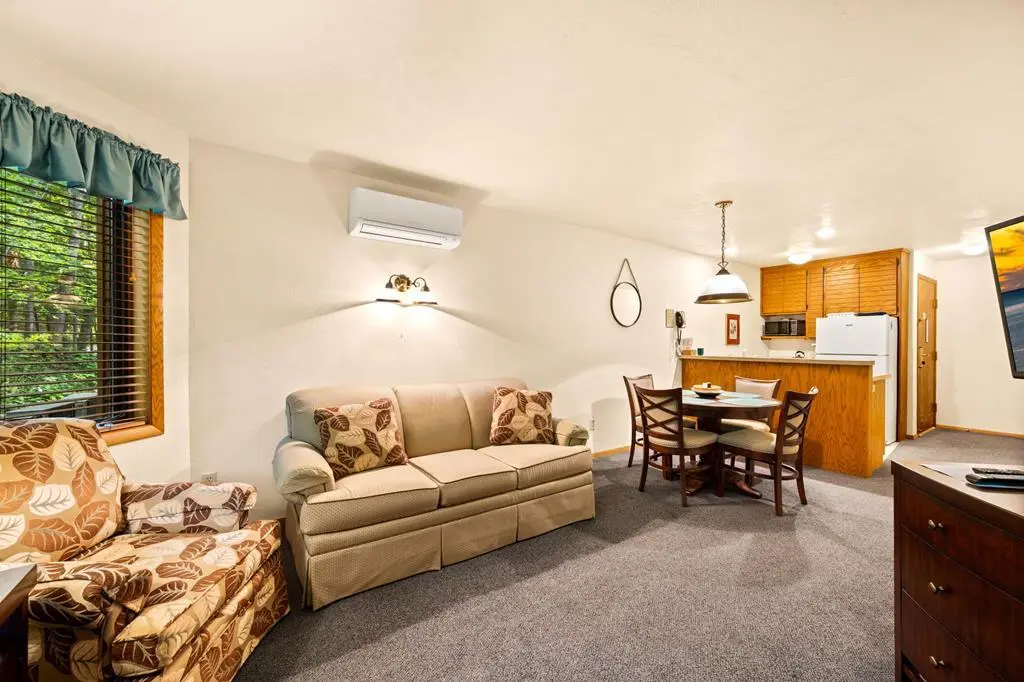
Listing remarks
Discover the charm of Door County's Landmark Resort with this 1-bedroom, 1-bath wood view unit in the desirable Navigator building. While not updated, it offers plenty of potential for customization and personal use. Please note: this unit is not compliant with Landmark's rental program. The resort itself spans 40 acres atop a scenic bluff overlooking Green Bay and features walking trails, indoor and outdoor pools, tennis and pickleball courts, grilling areas, a playground, and an on-site restaurant. With full access to all resort amenities and unrestricted personal use, this property offers an affordable way to enjoy the Landmark lifestyle in Door County.
Key facts
- Grilling areas
- 40 acres
- Scenic bluff
Tags
Property features AI
Finance
- Financial info: Annual tax amount listed
- HOA & community: Has homeowners association; Quarterly association fee of $1,857 (equivalent to $619/month)
Exterior
- Utilities: Mixed Use Commercial (MC) zoning
- Home design: Residential condominium; Located in Landmark Resort
- Exterior features: Asphalt roof
Interior
- Bathrooms: 1 full bathroom
- Heating & cooling: Baseboard heating; Electric heating
- Interior features: Baseboard electric heating
Neighborhood map
What this means for you Summary
Snapshot
- This is a 1-bed/1.0-bath condo listed at $118k. Condition is rated fair.
Deal economics
- At list price, monthly cash flow is $-223 ($-3k/yr) — negative.
- To cash-flow at today's rent, offer at most $86k (27.4% below list).
- Meets the 1% rule at list price ($2k rent vs $118k).
- Recommended offer: $86k (27.4% below list) — sets the bar for cash-flow.
- Cap rate 4.0% vs local median 1.0% in Egg Harbor — top-decile yield for the area; either an underpriced asset or a hidden risk that comps aren't pricing in. Stress-test before assuming the spread holds.
Location & tenants
- Location reads 66/100 on livability (#455 in WI) — a middle-class / working-renter tenant base. Strengths: crime A+, employment A-; Watch: amenities F, commute F, health & safety D-.
- Gibraltar Area School District (rural): math 52% / reading 54% proficiency, ranked #45 of 342 in WI (top 13%) — acceptable for families but not a draw, mixed tenant base, ~2y average lease.
- Market conditions: 103 active listings in the ZIP; 306 units permitted in Door County in 2024 (0 in 5+ unit buildings).
Forward outlook
- In year one you build about $6k of equity ($816 loan paydown + $5k appreciation (4.6% local appreciation)).
- Door County population projected at -15% by 2050 — secular population decline; favor cash flow + early exit over multi-decade hold.
- By year 6, paydown + projected appreciation supports a ~$33k cash-out refi (75% LTV) — recoverable capital for the next deal without selling this one.
Negotiation context
- It's been on market 51 days — a 3% lower offer ($114k) is reasonable based on typical stale-listing flexibility.
- 2 sale attempts with the ask held roughly flat each time — persistent listings suggest the price (not the market) is what's stuck; bring a comps-based counter.
Risks & watch-outs
- Watch-outs: HOA is 40% of rent.
Questions for the listing agent
- What do current leases actually rent for vs. the listed asking? Can we see a recent rent roll and the last 12 months of T-12 income?
- It's been on market 51 days. Have you received any prior offers? Is the seller open to a 27% concession, seller financing, or rate buy-down credit?
- Have any recent inspections been done? Can we get a copy of the seller's disclosures and any deferred-maintenance estimates?
- What does the HOA fee cover, when was the last increase, and are there any pending special assessments or reserve-fund shortfalls?
- Any open or pending special assessments — roof, HVAC, plumbing, elevator, façade? What's the per-unit balance and payoff schedule, and is the seller paying it off at close or rolling it to the buyer?
- Is there a deadline driving the sale (1031 exchange, divorce, estate, relocation)? That informs how much negotiation room exists.
- The area grade is low — what's the realistic commute time and amenity access for the typical tenant pool here? Any planned neighborhood developments (good or bad) we should know about?
- What's the average days-on-market for RENTAL listings here right now (not sales)? A rising rental-DOM trend means longer vacancies and softer asking-rent achievability than the comps imply.
- What's the recent tenant-quality profile in this submarket — average credit score on applications, eviction rate, late-payment / NSF rate, and stable-employment percentage? A property-management company in the area should have these aggregated.
- How much new apartment / multifamily construction is in the pipeline within 1–3 miles? Heavy new supply (>2% of stock underway) typically softens rents 12–24 months out; light construction supports rent growth.
Investment metrics
- 1% rule
- 1.30% ✓
- Cap rate
- 4.02%
- Cash-on-cash
- -8.11%
- DSCR
- 0.64
- GRM
- 6.4
CMA / ARV
- ARV (median comp)
- $155,425
- List price
- $118,000
- Delta
- -24.08%
- Verdict
- UNDERPRICED
- Comps
- 20 within 1.0 mi
Projected returns pro-forma
4.61% appreciation · 3.0% rent growth · sell at horizon
- IRR
- 5.1%
- Equity multiple
- 1.33×
- Total profit
- $10,768
- Equity at exit
- $64,096
- IRR
- 7.9%
- Equity multiple
- 2.42×
- Total profit
- $46,934
- Equity at exit
- $108,393
Cash invested: $33,040 (down + closing). Projections, not guarantees.
Landlord ↔ Tenant lean methodology
- Overall (STATE)
- 73 Landlord-Friendly
- State Wisconsin
- 73 Landlord-Friendly · R+2
- County
- — inherits STATE
- City
- — inherits STATE
ZIP-level market 54209
- Home prices YoY
- 2.0%
- Active inventory
- 103
- Price-to-rent
- 6.4×
Monthly cashflow live
- Estimated rent
- $1,533 medium interval (Pro) →
- Mortgage (P&I)
- −$619
- Tax est. 1.5%
- −$148 /mo · $1,770/yr
- Insurance
- −$49
- HOA
- −$619
- Vacancy / Maint / Mgmt
- −$322
- Net cashflow
- $-223
Break-even live
UW: 25.0% down · 7.5% · 30yr · 1.5% tax · 5.0% vac · 8.0% maint · 8.0% mgmt
Financing live
Cash to close
- Down payment
- $29,500
- Closing costs
- $3,540
- Reserves months
- —
- Total cash needed
- —
Loan-product check · same deal, 3 products live
Conventional
25% down · 7.5% · 30yr
- Down + closing
- —
- Monthly P&I
- —
- Monthly cashflow
- —
- DSCR
- —
- Eligible?
- —
Personal DTI + credit; lowest rate.
DSCR
20% down · 8.5% · 30yr
- Down + closing
- —
- Monthly P&I
- —
- Monthly cashflow
- —
- DSCR
- —
- Eligible?
- —
No personal income docs; deal must DSCR.
Hard money
10% down · 12.0% · 12mo
- Down + closing
- —
- Monthly P&I
- —
- Monthly cashflow
- —
- DSCR
- —
- Eligible?
- —
Short-term bridge; refi at stabilization.
HOA detail condo
- Monthly dues
- $619 · $7,428/yr
- Likely covers
- pool
- Assessments
- None detected in remarks — confirm with the listing agent.
Listing history 17 events
-
2026-06-18days on market $118,000 Active 51 DOM
-
2026-06-17days on market $118,000 Active 50 DOM
-
2026-06-16days on market $118,000 Active 49 DOM
-
2026-06-15days on market $118,000 Active 48 DOM
-
2026-06-15days on market $118,000 Active 47 DOM
-
2026-06-13days on market $118,000 Active 46 DOM
-
2026-06-12days on market $118,000 Active 45 DOM
-
2026-06-09days on market $118,000 Active 42 DOM
-
2026-06-08days on market $118,000 Active 41 DOM
-
2026-06-08days on market $118,000 Active 40 DOM
-
2026-06-07days on market $118,000 Active 39 DOM
-
2026-06-03days on market $118,000 Active 36 DOM
-
2026-06-02days on market $118,000 Active 35 DOM
-
2026-06-01days on market $118,000 Active 34 DOM
-
2026-05-31days on market $118,000 Active 33 DOM
-
2026-04-28$118,000 Active 664-char remark
-
2025-09-23$118,000 Active
ⓘ Source: listings_history table (triggers on properties + properties_extension) + one-shot
backfill from property_details.listing_events for pre-trigger history.
Climate risk First Street
- Flood 1/10 Low FEMA zone X (unshaded) · 0% chance over 30 yrs
- Wildfire 1/10 Low
- Heat 1/10 Low 7 d/yr ≥89°F today · 13 d/yr by 30 yrs out
- Wind 1/10 Low
- Air quality 2/10 Low 1 unhealthy d/yr today · 1 by 30 yrs out
Nearby sold comps map
Loading sold comps map…
Walkable amenities ~0.75 mi
Loading nearby amenities…
Taxation est. · year 1
- Rental income
- $18,397
- − Mortgage interest
- −$6,610
- − Property taxes
- −$1,770
- − Insurance
- −$590
- − Repairs & maintenance
- −$1,472
- − Management
- −$1,472
- − HOA
- −$7,428
- − Depreciation
- −$3,433
- Taxable loss
- −$4,377
- Est. tax savings @ 24.0%
- +$1,051
- After-tax cash flow
- $-1,630/yr
For passive investors: Depreciation is non-cash, so a rental often shows a tax loss while cash-flowing — sheltering income. Rental losses are passive: they offset passive income freely, and up to $25,000/yr can offset ordinary (W-2) income if you actively participate and your MAGI is under $100k (phasing out to $0 by $150k); unused losses carry forward. On sale, claimed depreciation is recaptured at up to 25%, and gains may owe capital-gains tax (a 1031 exchange can defer both). Figures are a year-1 estimate at your 24.0% rate — not tax advice; consult a CPA.
Condition & rehab AI · 12 photos
This 1-bedroom, 1-bath unit at Landmark Resort offers a fair condition with cosmetic updates needed to enhance its resale and rental value.
Repairs flagged
- Major kitchen appliances — Older and outdated
- Major bathroom fixtures — Standard and dated
- Minor flooring — Some wear
Value-add opportunities
- Both Paint interior walls — Enhances curb appeal and interior aesthetics
- Both Replace kitchen appliances — Modernizes the space and improves functionality
- Both Replace bathroom fixtures — Modernizes the space and improves functionality
Renovation cost estimate screening
| Repair item | Severity | Est. cost |
|---|---|---|
| kitchen appliances · Older and outdated | Major | $15,000–50,000 |
| bathroom fixtures · Standard and dated | Major | $15,000–50,000 |
| flooring · Some wear | Minor | $500–3,000 |
| Total estimated repair cost · 3 items | $30,500–103,000 |
Value-add ROI direction
- Both Paint interior walls — Enhances curb appeal and interior aesthetics ↑
- Both Replace kitchen appliances — Modernizes the space and improves functionality ↑
- Both Replace bathroom fixtures — Modernizes the space and improves functionality ↑
ⓘ Cost ranges are severity-bucket heuristics (US national rule-of-thumb). Get contractor quotes + a written scope before underwriting a rehab budget.
Schools (NCES district)
- District
- Gibraltar Area School District
- NCES district ID
- 5505220
- Math proficiency
- 52% ▼ -1.00%
- Reading proficiency
- 54% ▼ -4.00%
- Median HH income
- $53,154
- Composite
- 45.57/100
- National rank
- #2598
- State rank
- #45 of 342 in WI
Livability — Egg Harbor
- Score
- 66/100
- State rank
- #455
- US rank
- #11512
Category grades
Schools grade is shown separately in the Schools card above.
Census & demographics
- Population (ZIP)
- 1,529
Population outlook (Door County) Hauer SSP2
- Today (2025)
- 27,220 people
- By 2030
- 26,785 · -1.6%
- By 2040
- 25,167 · -7.5%
- By 2050
- 23,052 · -15.3%
- By 2075
- 18,981 · -30.3%
- By 2100
- 14,801 · -45.6%
Race, ethnicity, and origin ACS 2023
- Neighborhood character
- Predominantly White (97%)
- Race & ethnicity
- White 97% Two or more races 2% Hispanic / Latino 1% Native American 1%
- Common ancestry
- Portuguese 8% Romanian 8% English 7%
- Foreign-born
- 3% · Canada
- Languages at home
- 96% English-only · Spanish 3% Russian/Polish/Slavic 1%
Political lean MEDSL · Door
- 2024 margin
- Toss-up / Even · D 50.6% · R 48.3% · Other 1.1%
- 2008→2024 swing
- -15.1pp toward R · 2008: 17.3pp · 2024: 2.2pp
- All cycles
- 2024: D+2.2 2020: D+1.4 2016: R+3.2 2012: D+7.0 2008: D+17.3
Not yet ingested
- Civics
- —
Market trends
- HPI YoY
- ▲ 4.61%
- Current HPI
- 235.2831
- Rent YoY
- —
- Metro
- —
- State GDP YoY
- ▲ 2.10%
- F500 in state
- 20
Industry mix (Fortune 500 HQ in WI)
| Industry | F500 HQs | Revenue |
|---|---|---|
| Industrial Machinery | 4 | $23B |
|
||
| Industrial Technology | 2 | $36B |
|
||
| Insurance | 1 | $36B |
|
||
| Professional Services | 1 | $19B |
|
||
| Utilities | 1 | $9B |
|
||
| Consumer Goods | 1 | $3B |
|
||
Price history
+0.0% since first listed2 events — show timeline
- 2026-04-28 Listed $118,000 DCBRMLS
- 2025-09-23 Listed $118,000 DCBRMLS
Cash-flow waterfall
monthlySold comps — $/sqft
last 12 mo · ≤1 miLoading sold comps…