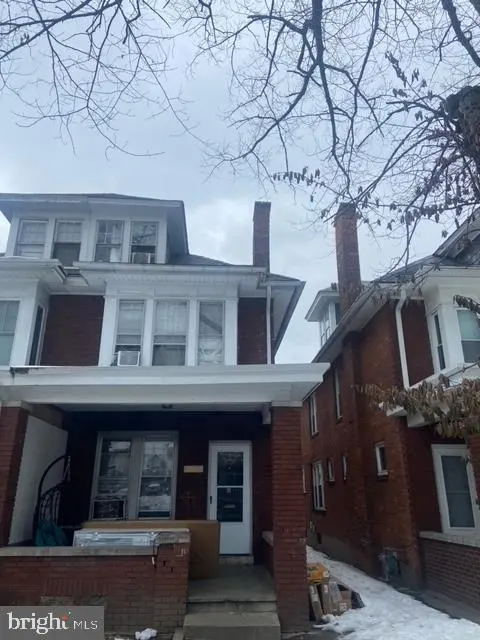
2012 Chestnut St · Harrisburg, PA
Flood risk 1/10 · Minimal
- FEMA flood zone
- X (unshaded)
- Chance of flooding over 30 yrs
- 0.0%
- Est. flood insurance / yr
- $473 – $860
Fire risk 1/10 · Minimal
- Est. fire insurance / yr
- $511 – $949
Heat risk 5/10 · Moderate
- Hot days now (above 100°F)
- 7 days/yr
- Hot days in 30 yrs
- 15 days/yr
Wind risk 3/10 · Minor
- Chance of severe wind over 30 yrs
- 5.0%
Air-quality risk 2/10 · Minimal
- Unhealthy air days now
- 1 days/yr
- Unhealthy air days in 30 yrs
- 3 days/yr
Risk factors via First Street. Map © Google.
Why this score? — see what drove the C grade
The composite is a weighted blend of 9 inputs, each scored 0–100. Each bar is that input's sub-score; the figure is the points it added to the 100-point composite (weight × sub-score).
- Cash flow +27.9/30.0
- DSCR +9.9/10.0
- 1% rule +7.9/10.0
- Livability +4.2/5.0
- Rent growth +3.6/5.0
- Condition / age +2.5/5.0
- Schools +0.8/10.0
- ARV discount +0.0/15.0
- Appreciation +0.0/10.0
$155,000
🖨 Deal sheet (PDF) 📄 Offer letter ✓ Due diligence
Listing remarks MLS
5 BR Semi-detached home with covered front porch. Conveniently located close to highways, public transportation and downtown Harrisburg. Property being sold 'as-is'.
Key facts
- Built 1924
- Listed 20 days
Property features AI
Exterior
- Parking: On-street parking
- Utilities: Public water; Public sewer; 100 amp electric service; Natural gas hot water
- Home design: Semi-detached structure; Built with brick and stick-built construction; Composite roof
- Construction: Brick/mortar foundation
- Exterior features: Level lot; Privacy fencing
Interior
- Kitchen: Refrigerator; Single oven
- Bedrooms: Three bedrooms on the first upper level; Two bedrooms on the second upper level
- Bathrooms: Two full bathrooms (one on an upper level and one on a lower level)
- Heating & cooling: Hot water radiator heating (natural gas); Window air conditioning units (electric)
- Interior features: Full unfinished daylight basement with interior access and rough plumbing for a bathroom; Porches; Living room and dining room
- Laundry & utility: Laundry in the basement
Neighborhood map
What this means for you Summary
Snapshot
- This is a 5-bed/2.0-bath townhouse listed at $155k.
Deal economics
- At list price, monthly cash flow is $479 ($6k/yr) — positive.
- The deal already cash-flows at list — no discount required.
- Meets the 1% rule at list price ($2k rent vs $155k).
- Recommended offer: $153k (1.5% below list) — sets the bar for market timing.
- Cap rate 10.0% vs local median 6.6% in Harrisburg — top-decile yield for the area; either an underpriced asset or a hidden risk that comps aren't pricing in. Stress-test before assuming the spread holds.
Location & tenants
- Location reads 84/100 on livability (#107 in PA, #826 nationally) — a professional / high-income tenant draw. Strengths: amenities A+, commute A+, cost of living A+; Watch: employment D, crime F.
- Harrisburg City SD (urban): math 6% / reading 13% proficiency, ranked #535 of 539 in PA (top 99%) — low school quality limits family demand, transient renter base, plan for 1-2y turnover; 82% free/reduced lunch — lower-income household profile, screen leases tightly.
- Zoned schools: Harrisburg Hs (math 24% / reading 10%, grade F, #399 of 437 statewide, top 92%, 1,230 students, 100% FRL) — zoned schools average 100% FRL vs 82% district-wide (18 pts higher); higher-poverty schools than district average — tighter screening recommended.
- Market conditions: Rents rising fast (+4.4%/yr); 67 active listings in the ZIP; 10 comparable units currently listed for rent nearby; rentals at typical pace (median 24d on market — plan ~3-4 weeks tenant-placement turnaround); 540 units permitted in Dauphin County in 2024 (194 in 5+ unit buildings).
- At $1,992/mo this rent would consume 51% of the median local household income ($47k/yr) (locally 1166% of renters already pay >50% of income on rent) — very limited rent-growth headroom before tenants either downsize or default.
Forward outlook
- Local home prices are declining (-3.0%/yr); year-one equity from $1k of loan paydown is wiped out by about $5k of value loss. Plan a longer hold.
- At projected returns (-3.0% appreciation + 4.4% rent growth), your $43k cash investment doubles in ~8 years — after that, you're playing with house money.
Negotiation context
- It's been on market 20 days — a 2% lower offer ($153k) is reasonable based on typical stale-listing flexibility.
- 3 sale attempts since 14y ago with the ask held roughly flat each time — persistent listings suggest the price (not the market) is what's stuck; bring a comps-based counter.
Risks & watch-outs
- Watch-outs: built in 1924 — expect roof / HVAC / electrical / plumbing capex.
- Climate carrying-cost: extreme-heat days projected 7→15/yr by 2055 (HVAC capex compounding) — expect insurance premiums to compound above CPI over the hold.
Questions for the listing agent
- Built in 1924 — when were the roof, HVAC, electrical panel, plumbing, and water heater last replaced?
- Is there a deadline driving the sale (1031 exchange, divorce, estate, relocation)? That informs how much negotiation room exists.
- Crime grade is F in this area — have there been break-ins, vandalism, or insurance claims at this property in the last 3 years? What carrier currently insures it and at what premium?
- What's the average days-on-market for RENTAL listings here right now (not sales)? A rising rental-DOM trend means longer vacancies and softer asking-rent achievability than the comps imply.
- What's the recent tenant-quality profile in this submarket — average credit score on applications, eviction rate, late-payment / NSF rate, and stable-employment percentage? A property-management company in the area should have these aggregated.
- How much new for-sale + rental construction is in the pipeline within 1–3 miles? Heavy new supply typically softens prices + rents 12–24 months out; constrained supply supports both.
Investment metrics
- 1% rule
- 1.29% ✓
- Cap rate
- 10.00%
- Cash-on-cash
- 13.24%
- DSCR
- 1.59
- GRM
- 6.5
CMA / ARV
- ARV (median comp)
- $128,188
- List price
- $155,000
- Delta
- 20.92%
- Verdict
- OVERPRICED
- Comps
- 20 within 1.0 mi
Show comp detail 12 sales within ~0.75 mi
| Address | Dist | Beds/Ba | Sqft | Sold | Price | $/sf | Match |
|---|---|---|---|---|---|---|---|
| 1937 Zarker St | 0.08mi | 4/1.0 (-1) | 1,568 (+3%) | 2mo | $125,000 | $80 | 81 |
| 1841 Regina St | 0.26mi | 5/1.0 | 1,552 (+2%) | 6mo | $107,000 | $69 | 76 |
| 214 S 20th St | 0.16mi | 5/1.0 | 1,418 (-7%) | 4mo | $165,000 | $116 | 74 |
| 1908 Walnut St | 0.38mi | 4/2.0 (-1) | 1,458 (-4%) | 5mo | $175,000 | $120 | 66 |
| 700 N 18th St | 0.54mi | 5/1.0 | 1,559 (+2%) | 6mo | $85,000 | $55 | 62 |
| 1827 Park St | 0.24mi | 5/1.0 | 1,742 (+14%) | 6mo | $137,000 | $79 | 56 |
| 1815 Holly St | 0.32mi | 4/1.0 (-1) | 1,700 (+12%) | 2mo | $142,000 | $84 | 55 |
| 1625 Park St | 0.40mi | 4/1.0 (-1) | 1,388 (-9%) | 4mo | $63,500 | $46 | 54 |
| 88 N 17th St | 0.44mi | 4/2.0 (-1) | 1,374 (-10%) | 6mo | $115,000 | $84 | 53 |
| 1212 Derry St | 0.74mi | 4/1.5 (-1) | 1,644 (+8%) | 2mo | $175,000 | $106 | 44 |
| 1209 Chestnut St | 0.73mi | 4/1.0 (-1) | 1,620 (+6%) | 4mo | $60,000 | $37 | 44 |
| 1302 Bailey St | 0.62mi | 4/1.5 (-1) | 1,307 (-14%) | 5mo | $150,000 | $115 | 36 |
Match score weights: distance 35% · size 25% · config 20% · recency 20%. Top-matched comps best support the ARV.
Projected returns pro-forma
-3.0% appreciation · 4.43% rent growth · sell at horizon
- IRR
- 4.9%
- Equity multiple
- 1.19×
- Total profit
- $8,327
- Equity at exit
- $23,111
- IRR
- 15.6%
- Equity multiple
- 2.36×
- Total profit
- $58,977
- Equity at exit
- $13,402
Cash invested: $43,400 (down + closing). Projections, not guarantees.
Landlord ↔ Tenant lean methodology
- Overall (STATE)
- 62 Landlord-Friendly
- State Pennsylvania
- 62 Landlord-Friendly · EVEN
- County
- — inherits STATE
- City
- — inherits STATE
ZIP-level market 17104
- Home prices YoY
- -6.3%
- Rents YoY
- 4.4%
- Active inventory
- 67
- Price-to-rent
- 6.5×
Monthly cashflow live
- Estimated rent
- $1,992 high interval (Pro) →
- Mortgage (P&I)
- −$813
- Tax from tax record
- −$217 /mo · $2,610/yr
- Insurance
- −$65
- HOA
- −$0
- Vacancy / Maint / Mgmt
- −$418
- Net cashflow
- $479
Break-even live
Sensitivity live
| Price | -10% $566 | -5% $523 | +0% $479 | +5% $435 | +10% $391 |
|---|---|---|---|---|---|
| Rent | -10% $321 | -5% $400 | +0% $479 | +5% $557 | +10% $636 |
| Rate | -1.0pp $557 | -0.5pp $518 | base $479 | +0.5pp $439 | +1.0pp $398 |
UW: 25.0% down · 7.5% · 30yr · 1.5% tax · 5.0% vac · 8.0% maint · 8.0% mgmt
Financing live
Cash to close
- Down payment
- $38,750
- Closing costs
- $4,650
- Reserves months
- —
- Total cash needed
- —
Loan-product check · same deal, 3 products live
Conventional
25% down · 7.5% · 30yr
- Down + closing
- —
- Monthly P&I
- —
- Monthly cashflow
- —
- DSCR
- —
- Eligible?
- —
Personal DTI + credit; lowest rate.
DSCR
20% down · 8.5% · 30yr
- Down + closing
- —
- Monthly P&I
- —
- Monthly cashflow
- —
- DSCR
- —
- Eligible?
- —
No personal income docs; deal must DSCR.
Hard money
10% down · 12.0% · 12mo
- Down + closing
- —
- Monthly P&I
- —
- Monthly cashflow
- —
- DSCR
- —
- Eligible?
- —
Short-term bridge; refi at stabilization.
Rent comps 10 comps
| Address | Beds | Baths | Sqft | Rent | $/sqft | DOM | Units | Dist |
|---|---|---|---|---|---|---|---|---|
| 14 S 17th St Harrisburg, PA | 5.0 | 2.0 | 2136 | $1,695 | $0.79 | 14d | 1 | 0.37mi |
| 66 N 17th St Harrisburg, PA | 5.0 | 2.0 | 1845 | $2,195 | $1.19 | 44d | 1 | 0.43mi |
| 29 S 15th St Harrisburg, PA | 5.0 | 1.0 | 1285 | $1,895 | $1.47 | 24d | 1 | 0.47mi |
| 111 N 17th St Harrisburg, PA | 5.0 | 1.0 | 1800 | $1,850 | $1.03 | 14d | 1 | 0.47mi |
| 1610 Hunter St Harrisburg, PA | 4.0 | 1.0 | 1776 | $1,450 | $0.82 | 24d | 1 | 0.54mi |
| 1414 Berryhill St Harrisburg, PA | 5.0 | 2.0 | 1786 | $1,700 | $0.95 | 24d | 1 | 0.69mi |
| 1207 Market St Harrisburg, PA | 4.0 | 1.5 | 1423 | $1,995 | $1.40 | 44d | 1 | 0.74mi |
| 2368 Canby St Harrisburg, PA | 6.0 | 2.0 | 2142 | $2,300 | $1.07 | 21d | 1 | 0.80mi |
| 301 Chestnut St Harrisburg, PA | 1.0–4.0 | 1.0–2.5 | 1437 | $2,600 | $1.81 | 44d | 1 | 1.22mi |
| 301 Chestnut St Harrisburg, PA | 4.0 | 1.0–2.5 | 1437 | $3,000 | $2.09 | 14d | 10 | 1.22mi |
Listing history 12 events
-
2026-06-18days on market $155,000 Active 20 DOM
-
2026-06-17days on market $155,000 Active 19 DOM
-
2026-06-16days on market $155,000 Active 18 DOM
-
2026-06-15days on market $155,000 Active 17 DOM
-
2026-06-14days on market $155,000 Active 15 DOM
-
2026-06-13statusdays on market $155,000 Active 14 DOM
-
2026-05-09$155,000 Active 364-char remark
-
2026-05-07historical $155,000 364-char remark
-
2019-10-18soldstatus $328,000
-
2012-08-24soldstatus $31,000 165-char remark
Show marketing remark (165 chars)
5 BR Semi-detached home with covered front porch. Conveniently located close to highways, public transportation and downtown Harrisburg. Property being sold 'as-is'.
-
2012-06-12$34,900 165-char remark
Show marketing remark (165 chars)
5 BR Semi-detached home with covered front porch. Conveniently located close to highways, public transportation and downtown Harrisburg. Property being sold 'as-is'.
-
1996-04-10soldstatus $49,000
ⓘ Source: listings_history table (triggers on properties + properties_extension) + one-shot
backfill from property_details.listing_events for pre-trigger history.
Tax reassessment forecast PA · Partial reset (capped growth)
- Current annual tax
- $2,610 · $217/mo
- Projected year-2 tax
- $2,610 · $217/mo
- Expected delta
- $0/yr ($0/mo · 0.0%)
ⓘ Screening estimate from a state-policy table — verify with the county assessor before closing.
Climate risk First Street
- Flood 1/10 Low FEMA zone X (unshaded) · 0% chance over 30 yrs
- Wildfire 1/10 Low
- Heat 5/10 Major 7 d/yr ≥100°F today · 15 d/yr by 30 yrs out
- Wind 3/10 Moderate 5% chance of damaging wind over 30 yrs
- Air quality 2/10 Low 1 unhealthy d/yr today · 3 by 30 yrs out
Nearby sold comps map
Loading sold comps map…
Walkable amenities ~0.75 mi
Loading nearby amenities…
Taxation est. · year 1
- Rental income
- $23,904
- − Mortgage interest
- −$8,682
- − Property taxes
- −$2,610
- − Insurance
- −$775
- − Repairs & maintenance
- −$1,912
- − Management
- −$1,912
- − Depreciation
- −$4,509
- Taxable income
- $3,503
- Est. tax owed @ 24.0%
- −$841
- After-tax cash flow
- $4,904/yr
For passive investors: Depreciation is non-cash, so a rental often shows a tax loss while cash-flowing — sheltering income. Rental losses are passive: they offset passive income freely, and up to $25,000/yr can offset ordinary (W-2) income if you actively participate and your MAGI is under $100k (phasing out to $0 by $150k); unused losses carry forward. On sale, claimed depreciation is recaptured at up to 25%, and gains may owe capital-gains tax (a 1031 exchange can defer both). Figures are a year-1 estimate at your 24.0% rate — not tax advice; consult a CPA.
Schools (NCES district)
- District
- Harrisburg City SD
- NCES district ID
- 4211580
- Math proficiency
- 6% ▼ -6.00%
- Reading proficiency
- 13% ▼ -10.00%
- Median HH income
- $33,432
- Composite
- 7.6/100
- National rank
- #9945
- State rank
- #535 of 539 in PA
Livability — Harrisburg
- Score
- 84/100
- State rank
- #107
- US rank
- #826
Category grades
Schools grade is shown separately in the Schools card above.
Census & demographics
- Census place
- Harrisburg, PA
- County
- Dauphin County · 247,857 people
- City population
- 184,296
- Metro
- Harrisburg-Carlisle, PA
- Population (ZIP)
- 18,541
- Household income
- $46,510
- Rent vs Own
- Severe rent burden
- 1166.0
Population outlook (Dauphin County) Hauer SSP2
- Today (2025)
- 281,628 people
- By 2030
- 283,549 · +0.7%
- By 2040
- 285,385 · +1.3%
- By 2050
- 286,188 · +1.6%
- By 2075
- 291,053 · +3.3%
- By 2100
- 282,374 · +0.3%
Race, ethnicity, and origin ACS 2023
- Neighborhood character
- Diverse neighborhood (Simpson 0.69)
- Race & ethnicity
- Black 44% Hispanic / Latino 29% White 19% Two or more races 12% Asian 3% Native American 1%
- Hispanic origin (detail)
- Puerto Rican 21% Dominican 6%
- Common ancestry
- Polish 1% Romanian 1% Slovak 1%
- Foreign-born
- 10% · Canada, China, Vietnam
- Languages at home
- 73% English-only · Spanish 21% Other Indo-European 1% Chinese 1%
Political lean MEDSL · Dauphin
- 2024 margin
- Lean D (+5.9) · D 52.4% · R 46.5% · Other 1.1%
- 2008→2024 swing
- -3.1pp toward R · 2008: 9.1pp · 2024: 5.9pp
- All cycles
- 2024: D+5.9 2020: D+8.5 2016: D+2.8 2012: D+6.0 2008: D+9.1
Not yet ingested
- Civics
- —
Market trends
- HPI YoY
- ▼ -22.83%
- Current HPI
- 340.2808
- Rent YoY
- ▲ 4.43%
- Metro
- Harrisburg-Carlisle, PA
- State GDP YoY
- ▲ 1.68%
- F500 in state
- 34
Industry mix (Fortune 500 HQ in PA)
| Industry | F500 HQs | Revenue |
|---|---|---|
| Healthcare | 2 | $309B |
|
||
| Insurance | 2 | $27B |
|
||
| Telecommunications / Media | 1 | $124B |
|
||
| Industrial Distribution | 1 | $22B |
|
||
| Financial Services | 1 | $20B |
|
||
| Chemicals / Materials | 1 | $18B |
|
||
Price history
+216.3% since first listed8 events — show timeline
- 2026-06-10 Relisted — BRIGHT MLS
- 2026-05-20 Contingent — BRIGHT MLS
- 2026-05-09 Listed $155,000 BRIGHT MLS
- 2026-05-07 Coming Soon $155,000 BRIGHT MLS
- 2019-10-18 Sold (Public Records) $328,000 Public Records
- 2012-08-24 Sold (MLS) $31,000 BRIGHT MLS
- 2012-06-12 Listed $34,900 BRIGHT MLS
- 1996-04-10 Sold (Public Records) $49,000 Public Records
Property tax history
+1.0%/yrLatest (2026): $2,610 · +1.7% YoY. Source: county tax records.
Cash-flow waterfall
monthlySold comps — $/sqft
last 12 mo · ≤1 miLoading sold comps…