 6-Plex
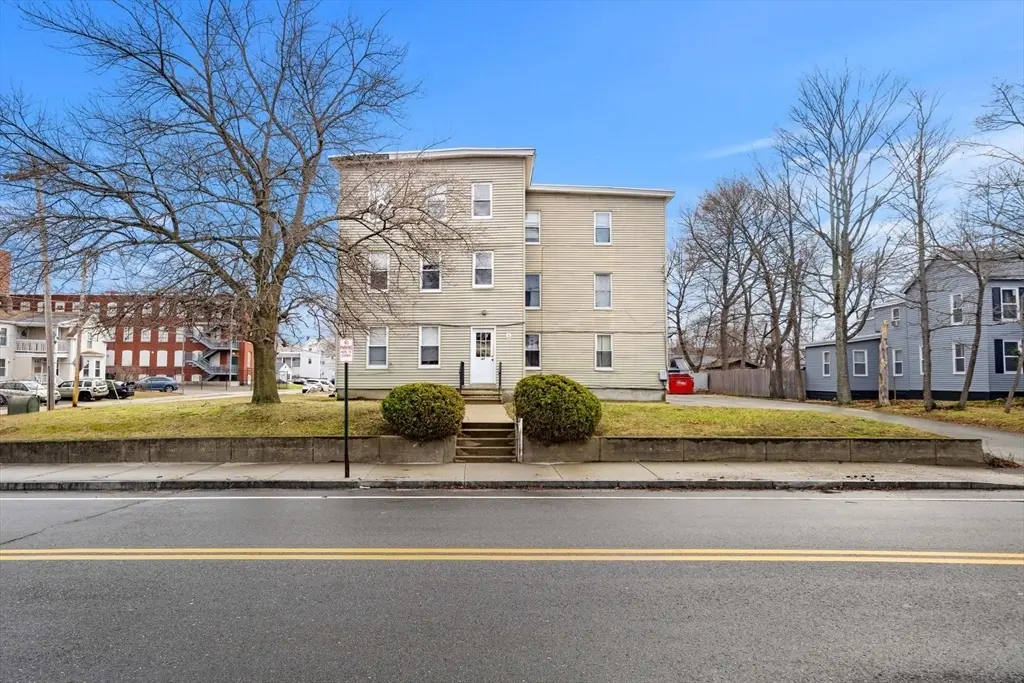
45 Laurel St · Leominster, MA
Flood risk 1/10 · Minimal
- FEMA flood zone
- —
- Chance of flooding over 30 yrs
- 0.0%
- Est. flood insurance / yr
- —
Fire risk 1/10 · Minimal
- Est. fire insurance / yr
- $915 – $1,699
Heat risk 4/10 · Minor
- Hot days now (above 95°F)
- 7 days/yr
- Hot days in 30 yrs
- 17 days/yr
Wind risk 6/10 · Moderate
- Chance of severe wind over 30 yrs
- 27.0%
Air-quality risk 2/10 · Minimal
- Unhealthy air days now
- 1 days/yr
- Unhealthy air days in 30 yrs
- 1 days/yr
Risk factors via First Street. Map © Google.
Why this score? — see what drove the D+ grade
The composite is a weighted blend of 9 inputs, each scored 0–100. Each bar is that input's sub-score; the figure is the points it added to the 100-point composite (weight × sub-score).
- Cash flow +23.8/30.0
- DSCR +7.7/10.0
- 1% rule +5.5/10.0
- Rent growth +3.7/5.0
- Livability +3.5/5.0
- Schools +2.8/10.0
- Condition / age +2.5/5.0
- ARV discount +0.0/15.0
- Appreciation +0.0/10.0
$999,900
🖨 Deal sheet (PDF) 📄 Offer letter ✓ Due diligence
Multi-family units
County records classify this as Multi-Family (5+ Unit). Listing-text estimate: 6 units. confirmed
5+ unit building — per-unit beds/baths from public records are typically unavailable; the breakdown below (if shown) is an estimate from the listing text.
Listing remarks MLS
Well-maintained 6-family property in a great location, offering a strong investment opportunity. The building features a desirable mix of three large 2-bedroom units and three 1-bedroom units, giving it broad rental appeal. Set on a corner lot, there’s plenty of off-street parking along with convenient access to the highway for easy commuting. The property has quiet, long-term tenants in place, providing steady income with room to grow. It’s been well cared for and generates solid cash flow, while still coming with additional upside through future rent increases. Overall, a turnkey investment with a nice balance of stability and value-add potential.
Key facts
- 0.31 acre lot
- 12 parking spots
- Built 1900
Neighborhood map
What this means for you Summary
Snapshot
- This is a 3×2bd/1ba + 3×1bd/1ba units multifamily listed at $1000k.
Deal economics
- At list price, monthly cash flow is $2k ($23k/yr) — positive. Per door: $321/mo.
- The deal already cash-flows at list — no discount required.
- Meets the 1% rule at list price ($11k rent vs $1000k).
- Recommended offer: $940k (6.0% below list) — sets the bar for market timing.
- Cap rate 8.6% vs local median 3.1% in Leominster — top-decile yield for the area; either an underpriced asset or a hidden risk that comps aren't pricing in. Stress-test before assuming the spread holds.
Location & tenants
- Location reads 69/100 on livability (#139 in MA) — a middle-class / working-renter tenant base. Strengths: housing A+, health & safety B+; Watch: schools C-, commute D+, cost of living D+.
- Leominster (suburban): math 25% / reading 38% proficiency, ranked #247 of 302 in MA (top 82%) — families likely to look elsewhere, expect single-tenant / working-renter base with shorter leases.
- Market conditions: Rents rising fast (+4.8%/yr); 68 active listings in the ZIP; solid renter incomes; 2,293 units permitted in Worcester County in 2024 (1,205 in 5+ unit buildings).
- At $10,525/mo this rent would consume 150% of the median local household income ($84k/yr) (locally 1633% of renters already pay >50% of income on rent) — very limited rent-growth headroom before tenants either downsize or default.
Forward outlook
- Local home prices are declining (-3.0%/yr); year-one equity from $7k of loan paydown is wiped out by about $30k of value loss. Plan a longer hold.
- At projected returns (-3.0% appreciation + 4.8% rent growth), your $280k cash investment doubles in ~10 years — after that, you're playing with house money.
Negotiation context
- It's been on market 67 days — a 6% lower offer ($940k) is reasonable based on typical stale-listing flexibility.
- 3 sale attempts since 6y ago with the ask held roughly flat each time — persistent listings suggest the price (not the market) is what's stuck; bring a comps-based counter.
- Current owner paid $635k; list at $1000k implies a 57% gain — meaningful room to come down on a strong offer.
Risks & watch-outs
- Watch-outs: built in 1900 — expect roof / HVAC / electrical / plumbing capex.
- Climate carrying-cost: major wind risk, 27% chance of damaging wind over 30y — expect insurance premiums to compound above CPI over the hold.
Questions for the listing agent
- It's been on market 67 days. Have you received any prior offers? Is the seller open to a 6% concession, seller financing, or rate buy-down credit?
- Can we see the unit-by-unit rent roll, current vacancy, and any below-market leases? What's the average tenancy length?
- What capital expenditures (roof, boiler, parking lot, exteriors) have been made in the last 5 years, and what's planned in the next 2?
- Built in 1900 — when were the roof, HVAC, electrical panel, plumbing, and water heater last replaced?
- Why hasn't it sold? Are there any deal-killer items the seller is aware of (foundation, flood, title, zoning, code violations)?
- Is there a deadline driving the sale (1031 exchange, divorce, estate, relocation)? That informs how much negotiation room exists.
- Crime grade is D in this area — have there been break-ins, vandalism, or insurance claims at this property in the last 3 years? What carrier currently insures it and at what premium?
- The area grade is low — what's the realistic commute time and amenity access for the typical tenant pool here? Any planned neighborhood developments (good or bad) we should know about?
- What's the average days-on-market for RENTAL listings here right now (not sales)? A rising rental-DOM trend means longer vacancies and softer asking-rent achievability than the comps imply.
- What's the recent tenant-quality profile in this submarket — average credit score on applications, eviction rate, late-payment / NSF rate, and stable-employment percentage? A property-management company in the area should have these aggregated.
- How much new apartment / multifamily construction is in the pipeline within 1–3 miles? Heavy new supply (>2% of stock underway) typically softens rents 12–24 months out; light construction supports rent growth.
Investment metrics
- 1% rule
- 1.05% ✓
- Cap rate
- 8.61%
- Cash-on-cash
- 8.27%
- DSCR
- 1.37
- GRM
- 7.9
CMA / ARV
- ARV (median comp)
- $774,175
- List price
- $999,900
- Delta
- 29.16%
- Verdict
- OVERPRICED
- Comps
- 20 within 1.0 mi
Show comp detail 4 sales within ~0.75 mi
| Address | Dist | Beds/Ba | Sqft | Sold | Price | $/sf | Match |
|---|---|---|---|---|---|---|---|
| 17 Laurel St | 0.07mi | 10/3.0 (+1) | 5,021 (-3%) | 9mo | $800,000 | $159 | 68 |
| 187 Mechanic St | 0.19mi | 9/4.0 | 4,680 (-9%) | 20mo | $725,000 | $155 | 51 |
| 200 Main St | 0.51mi | 8/3.0 (-1) | 4,905 (-5%) | 13mo | $635,000 | $129 | 40 |
| 7 Cross St | 0.42mi | 9/3.0 | 4,567 (-12%) | 21mo | $675,000 | $148 | 31 |
Match score weights: distance 35% · size 25% · config 20% · recency 20%. Top-matched comps best support the ARV.
Projected returns pro-forma
-3.0% appreciation · 4.83% rent growth · sell at horizon
- IRR
- -1.8%
- Equity multiple
- 0.93×
- Total profit
- $-19,602
- Equity at exit
- $149,088
- IRR
- 9.6%
- Equity multiple
- 1.80×
- Total profit
- $224,522
- Equity at exit
- $86,453
Cash invested: $279,972 (down + closing). Projections, not guarantees.
Landlord ↔ Tenant lean methodology
- Overall (STATE)
- 20 Strongly Tenant-Friendly
- State Massachusetts
- 20 Strongly Tenant-Friendly · D+15
- County
- — inherits STATE
- City
- — inherits STATE
ZIP-level market 01453
- Rents YoY
- 4.8%
- Active inventory
- 68
- Price-to-rent
- 46.3×
Monthly cashflow live
- Estimated rent
- $10,525 high interval (Pro) →
- Mortgage (P&I)
- −$5,244
- Tax from tax record
- −$726 /mo · $8,707/yr
- Insurance
- −$417
- HOA
- −$0
- Vacancy / Maint / Mgmt
- −$2,210
- Net cashflow
- $1,929
Break-even live
Sensitivity live
| Price | -10% $2,495 | -5% $2,212 | +0% $1,929 | +5% $1,646 | +10% $1,363 |
|---|---|---|---|---|---|
| Rent | -10% $1,097 | -5% $1,513 | +0% $1,929 | +5% $2,345 | +10% $2,760 |
| Rate | -1.0pp $2,433 | -0.5pp $2,183 | base $1,929 | +0.5pp $1,670 | +1.0pp $1,406 |
6-unit breakdown (identical units grouped — click to expand)
| Units | Beds | Baths | Est. rent |
|---|---|---|---|
| 3× units | 2 | 1 | $5,394 |
| #1 | 2 | 1 | $1,798 |
| #2 | 2 | 1 | $1,798 |
| #3 | 2 | 1 | $1,798 |
| 3× units | 1 | 1 | $5,130 |
| #4 | 1 | 1 | $1,710 |
| #5 | 1 | 1 | $1,710 |
| #6 | 1 | 1 | $1,710 |
| Total (6 units) | $10,525 | ||
UW: 25.0% down · 7.5% · 30yr · 1.5% tax · 5.0% vac · 8.0% maint · 8.0% mgmt
Financing live
Cash to close
- Down payment
- $249,975
- Closing costs
- $29,997
- Reserves months
- —
- Total cash needed
- —
Loan-product check · same deal, 3 products live
Conventional
25% down · 7.5% · 30yr
- Down + closing
- —
- Monthly P&I
- —
- Monthly cashflow
- —
- DSCR
- —
- Eligible?
- —
Personal DTI + credit; lowest rate.
DSCR
20% down · 8.5% · 30yr
- Down + closing
- —
- Monthly P&I
- —
- Monthly cashflow
- —
- DSCR
- —
- Eligible?
- —
No personal income docs; deal must DSCR.
Hard money
10% down · 12.0% · 12mo
- Down + closing
- —
- Monthly P&I
- —
- Monthly cashflow
- —
- DSCR
- —
- Eligible?
- —
Short-term bridge; refi at stabilization.
Listing history 23 events
-
2026-06-22days on market $999,900 Active 67 DOM
-
2026-06-18days on market $999,900 Active 64 DOM
-
2026-06-17days on market $999,900 Active 63 DOM
-
2026-06-16days on market $999,900 Active 62 DOM
-
2026-06-15days on market $999,900 Active 61 DOM
-
2026-06-14days on market $999,900 Active 59 DOM
-
2026-06-13days on market $999,900 Active 58 DOM
-
2026-06-10days on market $999,900 Active 56 DOM
-
2026-06-09days on market $999,900 Active 55 DOM
-
2026-06-08days on market $999,900 Active 54 DOM
-
2026-06-07days on market $999,900 Active 53 DOM
-
2026-06-05days on market $999,900 Active 50 DOM
-
2026-06-03days on market $999,900 Active 49 DOM
-
2026-06-02days on market $999,900 Active 48 DOM
-
2026-06-01days on market $999,900 Active 47 DOM
-
2026-05-31days on market $999,900 Active 46 DOM
-
2026-05-31days on market $999,900 Active 45 DOM
-
2026-05-11status Back On Market 669-char remark
Show marketing remark (669 chars)
Well-maintained 6-family property in a great location, offering a strong investment opportunity. The building features a desirable mix of three large 2-bedroom units and three 1-bedroom units, giving it broad rental appeal. Set on a corner lot, there’s plenty of off-street parking along with convenient access to the highway for easy commuting. The property has quiet, long-term tenants in place, providing steady income with room to grow. It’s been well cared for and generates solid cash flow, while still coming with additional upside through future rent increases. Overall, a turnkey investment with a nice balance of stability and value-add potential.
-
2026-04-28historical Contingent 669-char remark
Show marketing remark (669 chars)
Well-maintained 6-family property in a great location, offering a strong investment opportunity. The building features a desirable mix of three large 2-bedroom units and three 1-bedroom units, giving it broad rental appeal. Set on a corner lot, there’s plenty of off-street parking along with convenient access to the highway for easy commuting. The property has quiet, long-term tenants in place, providing steady income with room to grow. It’s been well cared for and generates solid cash flow, while still coming with additional upside through future rent increases. Overall, a turnkey investment with a nice balance of stability and value-add potential.
-
2026-04-15$1,050,000 New 669-char remark
Show marketing remark (669 chars)
Well-maintained 6-family property in a great location, offering a strong investment opportunity. The building features a desirable mix of three large 2-bedroom units and three 1-bedroom units, giving it broad rental appeal. Set on a corner lot, there’s plenty of off-street parking along with convenient access to the highway for easy commuting. The property has quiet, long-term tenants in place, providing steady income with room to grow. It’s been well cared for and generates solid cash flow, while still coming with additional upside through future rent increases. Overall, a turnkey investment with a nice balance of stability and value-add potential.
-
2020-10-02soldstatus $635,000 Sold 522-char remark
Show marketing remark (522 chars)
IMMACULATE 6 FAMILY INVESTMENT PROPERTY. THIS WELL MAINTAINED TURNKEYBUILDING DOESN'T NEED ANYTHING !!! GREAT CAP RATE AT 8%. ALL UTILITIES (even hot water) ARE SEPARATE EXCEPT S&W. GREAT INCOME WITH LOW MAINTENANCE WILL MAKE MONEY RIGHT FROM THE GET GO !!! FILLED WITH VERY GOOD TENANTS ALL UNDER LEASE. LARGE PAVED PARKING LOT, PLENTY FOR ALL UNITS. LEAD COMPLIANCE CERTS FOR 5 OF THE 6 UNITS. OPEN HOUSE ON SATURDAY 8/8/20 TO SEE 2 UNITS (All are in similar condition). OFFERS DUE BY 5PM ON MONDAY 8/10/20.
-
2020-08-13status Under Agreement 522-char remark
Show marketing remark (522 chars)
IMMACULATE 6 FAMILY INVESTMENT PROPERTY. THIS WELL MAINTAINED TURNKEYBUILDING DOESN'T NEED ANYTHING !!! GREAT CAP RATE AT 8%. ALL UTILITIES (even hot water) ARE SEPARATE EXCEPT S&W. GREAT INCOME WITH LOW MAINTENANCE WILL MAKE MONEY RIGHT FROM THE GET GO !!! FILLED WITH VERY GOOD TENANTS ALL UNDER LEASE. LARGE PAVED PARKING LOT, PLENTY FOR ALL UNITS. LEAD COMPLIANCE CERTS FOR 5 OF THE 6 UNITS. OPEN HOUSE ON SATURDAY 8/8/20 TO SEE 2 UNITS (All are in similar condition). OFFERS DUE BY 5PM ON MONDAY 8/10/20.
-
2020-08-04$635,000 New 522-char remark
Show marketing remark (522 chars)
IMMACULATE 6 FAMILY INVESTMENT PROPERTY. THIS WELL MAINTAINED TURNKEYBUILDING DOESN'T NEED ANYTHING !!! GREAT CAP RATE AT 8%. ALL UTILITIES (even hot water) ARE SEPARATE EXCEPT S&W. GREAT INCOME WITH LOW MAINTENANCE WILL MAKE MONEY RIGHT FROM THE GET GO !!! FILLED WITH VERY GOOD TENANTS ALL UNDER LEASE. LARGE PAVED PARKING LOT, PLENTY FOR ALL UNITS. LEAD COMPLIANCE CERTS FOR 5 OF THE 6 UNITS. OPEN HOUSE ON SATURDAY 8/8/20 TO SEE 2 UNITS (All are in similar condition). OFFERS DUE BY 5PM ON MONDAY 8/10/20.
ⓘ Source: listings_history table (triggers on properties + properties_extension) + one-shot
backfill from property_details.listing_events for pre-trigger history.
Tax reassessment forecast MA · Partial reset (capped growth)
- Current annual tax
- $8,707 · $726/mo
- Projected year-2 tax
- $10,503 · $875/mo
- Expected delta
- +$1,796/yr (+$150/mo · 20.6%)
ⓘ Screening estimate from a state-policy table — verify with the county assessor before closing.
Climate risk First Street
- Flood 1/10 Low 0% chance over 30 yrs
- Wildfire 1/10 Low
- Heat 4/10 Moderate 7 d/yr ≥95°F today · 17 d/yr by 30 yrs out
- Wind 6/10 Major 27% chance of damaging wind over 30 yrs
- Air quality 2/10 Low 1 unhealthy d/yr today · 1 by 30 yrs out
Nearby sold comps map
Loading sold comps map…
Walkable amenities ~0.75 mi
Loading nearby amenities…
Taxation est. · year 1
- Rental income
- $126,300
- − Mortgage interest
- −$56,010
- − Property taxes
- −$8,707
- − Insurance
- −$5,000
- − Repairs & maintenance
- −$10,104
- − Management
- −$10,104
- − Depreciation
- −$29,088
- Taxable income
- $7,288
- Est. tax owed @ 24.0%
- −$1,749
- After-tax cash flow
- $21,398/yr
For passive investors: Depreciation is non-cash, so a rental often shows a tax loss while cash-flowing — sheltering income. Rental losses are passive: they offset passive income freely, and up to $25,000/yr can offset ordinary (W-2) income if you actively participate and your MAGI is under $100k (phasing out to $0 by $150k); unused losses carry forward. On sale, claimed depreciation is recaptured at up to 25%, and gains may owe capital-gains tax (a 1031 exchange can defer both). Figures are a year-1 estimate at your 24.0% rate — not tax advice; consult a CPA.
Schools (NCES district)
- District
- Leominster
- NCES district ID
- 2506780
- Math proficiency
- 25% ▼ -23.00%
- Reading proficiency
- 38% ▼ -6.00%
- Median HH income
- $57,041
- Composite
- 28.07/100
- National rank
- #6836
- State rank
- #247 of 302 in MA
Livability — Leominster
- Score
- 69/100
- State rank
- #139
- US rank
- #8562
Category grades
Schools grade is shown separately in the Schools card above.
Census & demographics
- Census place
- Leominster, MA
- County
- Worcester County · 487,911 people
- City population
- 43,851
- Metro
- Worcester, MA-CT
- Population (ZIP)
- 43,851
- Household income
- $84,296
- Rent vs Own
- Severe rent burden
- 1633.0
Population outlook (Worcester County) Hauer SSP2
- Today (2025)
- 850,858 people
- By 2030
- 860,403 · +1.1%
- By 2040
- 869,902 · +2.2%
- By 2050
- 869,110 · +2.1%
- By 2075
- 870,120 · +2.3%
- By 2100
- 829,703 · -2.5%
Race, ethnicity, and origin ACS 2023
- Neighborhood character
- Predominantly White (68%)
- Race & ethnicity
- White 68% Hispanic / Latino 17% Two or more races 12% Black 5% Asian 3%
- Hispanic origin (detail)
- Mexican 2% Puerto Rican 8% Dominican 1%
- Common ancestry
- Lithuanian 9% Estonian 2% Romanian 2%
- Foreign-born
- 15% · Canada, South Korea, Jamaica
- Languages at home
- 76% English-only · Spanish 13% Other Indo-European 5% French/Haitian/Cajun 1%
Political lean MEDSL · Worcester
- 2024 margin
- D (+10.0) · D 53.9% · R 43.9% · Other 2.2%
- 2008→2024 swing
- -3.8pp toward R · 2008: 13.8pp · 2024: 10.0pp
- All cycles
- 2024: D+10.0 2020: D+17.8 2016: D+10.5 2012: D+9.2 2008: D+13.8
Not yet ingested
- Civics
- —
Market trends
- HPI YoY
- ▼ -621.70%
- Current HPI
- 296.2863
- Rent YoY
- ▲ 4.83%
- Metro
- Worcester, MA-CT
- State GDP YoY
- ▲ 2.28%
- F500 in state
- 38
Industry mix (Fortune 500 HQ in MA)
| Industry | F500 HQs | Revenue |
|---|---|---|
| Technology | 3 | $17B |
|
||
| Insurance | 2 | $84B |
|
||
| Retail | 2 | $76B |
|
||
| Life Sciences | 1 | $43B |
|
||
| Energy Technology | 1 | $31B |
|
||
| Aerospace / Defense | 1 | $18B |
|
||
Price history
+65.4% since first listed6 events — show timeline
- 2026-05-11 Relisted — MLS PIN
- 2026-04-28 Contingent — MLS PIN
- 2026-04-15 Listed $1,050,000 MLS PIN
- 2020-10-02 Sold (MLS) $635,000 MLS PIN
- 2020-08-13 Pending — MLS PIN
- 2020-08-04 Listed $635,000 MLS PIN
Property tax history
+6.1%/yrLatest (2023): $8,707 · +5.9% YoY. Source: county tax records.
Cash-flow waterfall
monthlySold comps — $/sqft
last 12 mo · ≤1 miLoading sold comps…