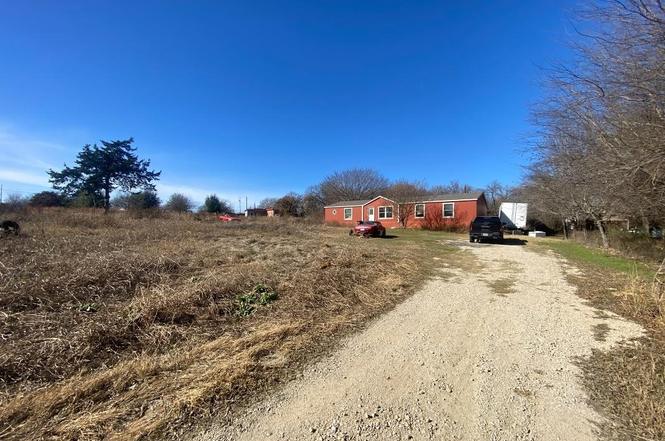
7712 Greenfield Dr · Alvarado, TX
Flood risk 1/10 · Minimal
- FEMA flood zone
- X (unshaded)
- Chance of flooding over 30 yrs
- 0.0%
- Est. flood insurance / yr
- $507 – $1,088
Fire risk 4/10 · Minor
- Est. fire insurance / yr
- $1,222 – $2,270
Heat risk 6/10 · Moderate
- Hot days now (above 110°F)
- 7 days/yr
- Hot days in 30 yrs
- 22 days/yr
Wind risk 6/10 · Moderate
- Chance of severe wind over 30 yrs
- 27.0%
Air-quality risk 2/10 · Minimal
- Unhealthy air days now
- 1 days/yr
- Unhealthy air days in 30 yrs
- 2 days/yr
Risk factors via First Street. Map © Google.
Why this score? — see what drove the D grade
The composite is a weighted blend of 9 inputs, each scored 0–100. Each bar is that input's sub-score; the figure is the points it added to the 100-point composite (weight × sub-score).
- Cash flow +12.4/30.0
- ARV discount +9.3/15.0
- DSCR +3.7/10.0
- Livability +3.7/5.0
- 1% rule +3.5/10.0
- Schools +3.4/10.0
- Rent growth +2.5/5.0
- Condition / age +2.5/5.0
- Appreciation +0.0/10.0
$265,000
🖨 Deal sheet (PDF) 📄 Offer letter ✓ Due diligence
Listing remarks
2022 Legacy manufactured home in the Alvarado ISD! This home features five bedrooms, three baths, two living areas, 2108 sqft, AC vents in ceiling, thermopane windows, sliding glass door, kitchen island, separate tub & shower, dual vanity and big walk-in closets. CURRENTLY UNDER REMODEL SO NEW PICS COMING SOON!
Key facts
- 1 acre lot
- Built 2022
- Listed 82 days
Neighborhood map
What this means for you Summary
Snapshot
- This is a 5-bed/3.0-bath manufactured listed at $265k.
Deal economics
- At list price, monthly cash flow is $-46 ($-550/yr) — negative.
- To cash-flow at today's rent, offer at most $257k (3.1% below list).
- To meet the 1% rule (rent ≥ 1% of price), the offer needs to be $225k (15.2% below list).
- Recommended offer: $225k (15.2% below list) — sets the bar for 1% rule.
- Cap rate 6.1% vs local median 3.9% in Alvarado — top-decile yield for the area; either an underpriced asset or a hidden risk that comps aren't pricing in. Stress-test before assuming the spread holds.
Location & tenants
- Location reads 73/100 on livability (#228 in TX) — a middle-class / working-renter tenant base. Strengths: cost of living A+, housing A+, health & safety A+; Watch: amenities F, commute F.
- Alvarado ISD (rural): math 41% / reading 37% proficiency, ranked #416 of 826 in TX (top 50%) — families likely to look elsewhere, expect single-tenant / working-renter base with shorter leases.
- Zoned schools: Alvarado J H (math 35% / reading 33%, grade F, #892 of 1,662 statewide, top 55%, 845 students, 67% FRL).
- Market conditions: 360 active listings in the ZIP; solid renter incomes; 2,152 units permitted in Johnson County in 2024 (76 in 5+ unit buildings).
- This rent runs 34% of the median local income ($80k/yr) — at the standard rent-burdened threshold; future hikes will face affordability resistance.
Forward outlook
- Local home prices are declining (-3.0%/yr); year-one equity from $2k of loan paydown is wiped out by about $8k of value loss. Plan a longer hold.
- Johnson County population projected at +24% by 2050 — long-run rental-demand tailwind backs the buy-and-hold thesis.
Negotiation context
- It's been on market 82 days — a 6% lower offer ($249k) is reasonable based on typical stale-listing flexibility.
- Current owner paid $65k; list at $265k implies a 308% gain — meaningful room to come down on a strong offer.
Risks & watch-outs
- Climate carrying-cost: major wind risk, 27% chance of damaging wind over 30y; extreme-heat days projected 7→22/yr by 2055 (HVAC capex compounding) — expect insurance premiums to compound above CPI over the hold.
Questions for the listing agent
- What do current leases actually rent for vs. the listed asking? Can we see a recent rent roll and the last 12 months of T-12 income?
- It's been on market 82 days. Have you received any prior offers? Is the seller open to a 15% concession, seller financing, or rate buy-down credit?
- Why hasn't it sold? Are there any deal-killer items the seller is aware of (foundation, flood, title, zoning, code violations)?
- Is there a deadline driving the sale (1031 exchange, divorce, estate, relocation)? That informs how much negotiation room exists.
- Schools are D-rated, which usually means shorter tenancies and higher turnover. Who's the typical renter profile here, and what's been the actual vacancy rate?
- The area grade is low — what's the realistic commute time and amenity access for the typical tenant pool here? Any planned neighborhood developments (good or bad) we should know about?
- What's the average days-on-market for RENTAL listings here right now (not sales)? A rising rental-DOM trend means longer vacancies and softer asking-rent achievability than the comps imply.
- What's the recent tenant-quality profile in this submarket — average credit score on applications, eviction rate, late-payment / NSF rate, and stable-employment percentage? A property-management company in the area should have these aggregated.
- How much new for-sale + rental construction is in the pipeline within 1–3 miles? Heavy new supply typically softens prices + rents 12–24 months out; constrained supply supports both.
Investment metrics
- 1% rule
- 0.85% ✗
- Cap rate
- 6.09%
- Cash-on-cash
- -0.74%
- DSCR
- 0.97
- GRM
- 9.8
CMA / ARV
- ARV (on-the-fly)
- $276,352
- Comps found
- 2
Show comp detail 2 sales within ~0.75 mi
| Address | Dist | Beds/Ba | Sqft | Sold | Price | $/sf | Match |
|---|---|---|---|---|---|---|---|
| 7417 Greenfield Dr | 0.23mi | 4/2.0 (-1) | 2,128 (-2%) | 4mo | $230,000 | $108 | 73 |
| 7410 Greenfield Dr | 0.28mi | 4/2.0 (-1) | 2,128 (-2%) | 23mo | $269,900 | $127 | 55 |
Match score weights: distance 35% · size 25% · config 20% · recency 20%. Top-matched comps best support the ARV.
Projected returns pro-forma
-3.0% appreciation · 3.0% rent growth · sell at horizon
- IRR
- -17.5%
- Equity multiple
- 0.38×
- Total profit
- $-45,834
- Equity at exit
- $39,512
- IRR
- -9.5%
- Equity multiple
- 0.41×
- Total profit
- $-43,558
- Equity at exit
- $22,912
Cash invested: $74,200 (down + closing). Projections, not guarantees.
Landlord ↔ Tenant lean methodology
- Overall (STATE)
- 87 Strongly Landlord-Friendly
- State Texas
- 87 Strongly Landlord-Friendly · R+5
- County
- — inherits STATE
- City
- — inherits STATE
ZIP-level market 76009
- Home prices YoY
- -25.7%
- Active inventory
- 360
- Price-to-rent
- 9.8×
Monthly cashflow live
- Estimated rent
- $2,247 medium interval (Pro) →
- Mortgage (P&I)
- −$1,390
- Tax from tax record
- −$321 /mo · $3,855/yr
- Insurance
- −$110
- HOA
- −$0
- Vacancy / Maint / Mgmt
- −$472
- Net cashflow
- $-46
Break-even live
Sensitivity live
| Price | -10% $104 | -5% $29 | +0% $-46 | +5% $-121 | +10% $-196 |
|---|---|---|---|---|---|
| Rent | -10% $-223 | -5% $-135 | +0% $-46 | +5% $43 | +10% $132 |
| Rate | -1.0pp $88 | -0.5pp $22 | base $-46 | +0.5pp $-115 | +1.0pp $-184 |
UW: 25.0% down · 7.5% · 30yr · 1.5% tax · 5.0% vac · 8.0% maint · 8.0% mgmt
Financing live
Cash to close
- Down payment
- $66,250
- Closing costs
- $7,950
- Reserves months
- —
- Total cash needed
- —
Loan-product check · same deal, 3 products live
Conventional
25% down · 7.5% · 30yr
- Down + closing
- —
- Monthly P&I
- —
- Monthly cashflow
- —
- DSCR
- —
- Eligible?
- —
Personal DTI + credit; lowest rate.
DSCR
20% down · 8.5% · 30yr
- Down + closing
- —
- Monthly P&I
- —
- Monthly cashflow
- —
- DSCR
- —
- Eligible?
- —
No personal income docs; deal must DSCR.
Hard money
10% down · 12.0% · 12mo
- Down + closing
- —
- Monthly P&I
- —
- Monthly cashflow
- —
- DSCR
- —
- Eligible?
- —
Short-term bridge; refi at stabilization.
Listing history 7 events
-
2026-04-22status Pending
-
2026-01-28$265,000 Active
-
2022-02-21soldstatus
-
2021-07-28soldstatus
-
2021-06-02soldstatus
-
2019-11-15soldstatus
-
2009-04-20soldstatus $65,000
ⓘ Source: listings_history table (triggers on properties + properties_extension) + one-shot
backfill from property_details.listing_events for pre-trigger history.
Tax reassessment forecast TX · Resets to sale price
- Current annual tax
- $3,855 · $321/mo
- Projected year-2 tax
- $4,850 · $404/mo
- Expected delta
- +$995/yr (+$83/mo · 25.8%)
ⓘ Screening estimate from a state-policy table — verify with the county assessor before closing.
Climate risk First Street
- Flood 1/10 Low FEMA zone X (unshaded) · 0% chance over 30 yrs
- Wildfire 4/10 Moderate
- Heat 6/10 Major 7 d/yr ≥110°F today · 22 d/yr by 30 yrs out
- Wind 6/10 Major 27% chance of damaging wind over 30 yrs
- Air quality 2/10 Low 1 unhealthy d/yr today · 2 by 30 yrs out
Nearby sold comps map
Loading sold comps map…
Walkable amenities ~0.75 mi
Loading nearby amenities…
Taxation est. · year 1
- Rental income
- $26,970
- − Mortgage interest
- −$14,844
- − Property taxes
- −$3,855
- − Insurance
- −$1,325
- − Repairs & maintenance
- −$2,158
- − Management
- −$2,158
- − Depreciation
- −$7,709
- Taxable loss
- −$5,079
- Est. tax savings @ 24.0%
- +$1,219
- After-tax cash flow
- $669/yr
For passive investors: Depreciation is non-cash, so a rental often shows a tax loss while cash-flowing — sheltering income. Rental losses are passive: they offset passive income freely, and up to $25,000/yr can offset ordinary (W-2) income if you actively participate and your MAGI is under $100k (phasing out to $0 by $150k); unused losses carry forward. On sale, claimed depreciation is recaptured at up to 25%, and gains may owe capital-gains tax (a 1031 exchange can defer both). Figures are a year-1 estimate at your 24.0% rate — not tax advice; consult a CPA.
Schools (NCES district)
- District
- Alvarado ISD
- NCES district ID
- 4800011
- Math proficiency
- 41% ▲ 4.00%
- Reading proficiency
- 37% ▼ -2.00%
- Median HH income
- $53,485
- Composite
- 34.02/100
- National rank
- #5312
- State rank
- #416 of 826 in TX
Livability — Alvarado
- Score
- 73/100
- State rank
- #228
- US rank
- #5544
Category grades
Schools grade is shown separately in the Schools card above.
Census & demographics
- County
- Johnson County · 147,987 people
- City population
- 22,803
- Metro
- Dallas-Fort Worth-Arlington, TX
- Population (ZIP)
- 22,803
- Household income
- $79,755
- Rent vs Own
- Severe rent burden
- 298.0
Population outlook (Johnson County) Hauer SSP2
- Today (2025)
- 179,678 people
- By 2030
- 189,208 · +5.3%
- By 2040
- 207,261 · +15.4%
- By 2050
- 223,064 · +24.1%
- By 2075
- 259,979 · +44.7%
- By 2100
- 275,395 · +53.3%
Race, ethnicity, and origin ACS 2023
- Neighborhood character
- Majority White (56%)
- Race & ethnicity
- White 56% Hispanic / Latino 39% Two or more races 17% Black 3%
- Hispanic origin (detail)
- Mexican 37%
- Common ancestry
- Serbian 1% Romanian 1% Italian 1%
- Foreign-born
- 10% · Canada
- Languages at home
- 73% English-only · Spanish 27%
Political lean MEDSL · Johnson
- 2024 margin
- Solid R (+51.4) · D 23.9% · R 75.3%
- 2008→2024 swing
- -3.9pp toward R · 2008: -47.5pp · 2024: -51.4pp
- All cycles
- 2024: R+51.4 2020: R+53.0 2016: R+58.3 2012: R+55.6 2008: R+47.5
Not yet ingested
- Civics
- —
Market trends
- HPI YoY
- ▼ -86.74%
- Current HPI
- 251.2624
- Rent YoY
- —
- Metro
- Dallas-Fort Worth-Arlington, TX
- State GDP YoY
- ▲ 3.95%
- F500 in state
- 110
Industry mix (Fortune 500 HQ in TX)
| Industry | F500 HQs | Revenue |
|---|---|---|
| Energy | 16 | $1,198B |
|
||
| Technology | 5 | $198B |
|
||
| Engineering / Construction | 4 | $72B |
|
||
| Energy Services | 3 | $60B |
|
||
| Utilities | 3 | $41B |
|
||
| Healthcare | 2 | $330B |
|
||
Price history
+307.7% since first listed7 events — show timeline
- 2026-04-22 Pending — LAAR
- 2026-01-28 Listed $265,000 LAAR
- 2022-02-21 Sold (Public Records) — Public Records
- 2021-07-28 Sold (Public Records) — Public Records
- 2021-06-02 Sold (Public Records) — Public Records
- 2019-11-15 Sold (Public Records) — Public Records
- 2009-04-20 Sold (Public Records) $65,000 Public Records
Property tax history
+16.4%/yrLatest (2025): $3,855 · -6.2% YoY. Source: county tax records.
Cash-flow waterfall
monthlySold comps — $/sqft
last 12 mo · ≤1 miLoading sold comps…