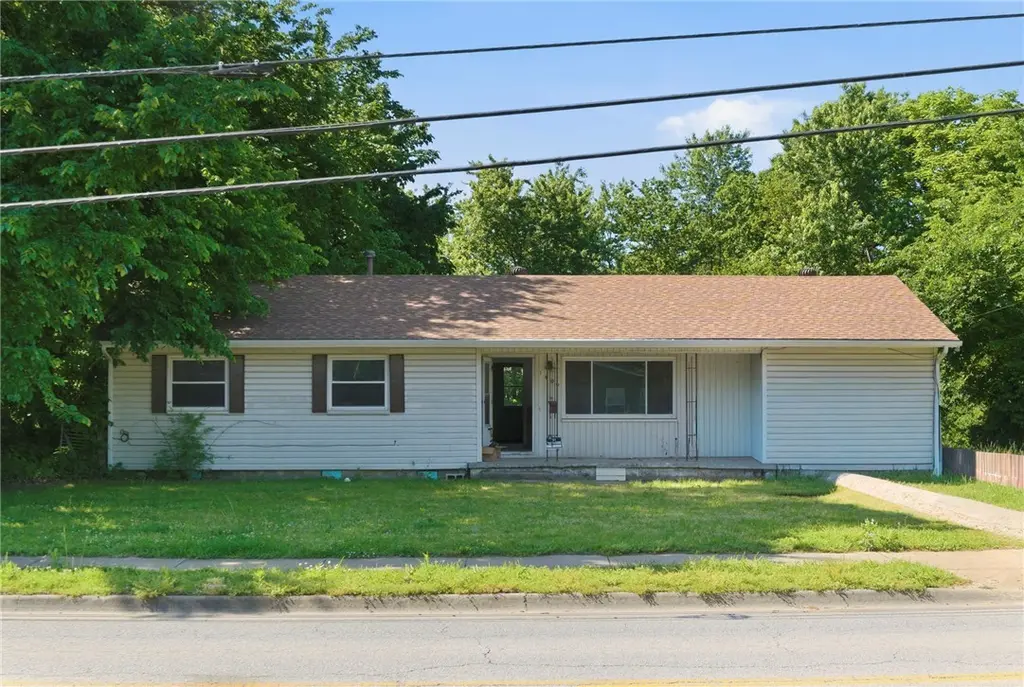
1409 Backus Ave · Springdale, AR
Flood risk 1/10 · Minimal
- FEMA flood zone
- X (unshaded)
- Chance of flooding over 30 yrs
- 0.0%
- Est. flood insurance / yr
- $507 – $1,088
Fire risk 4/10 · Minor
- Est. fire insurance / yr
- $1,499 – $2,785
Heat risk 5/10 · Moderate
- Hot days now (above 104°F)
- 7 days/yr
- Hot days in 30 yrs
- 20 days/yr
Wind risk 2/10 · Minimal
- Chance of severe wind over 30 yrs
- 2.0%
Air-quality risk 2/10 · Minimal
- Unhealthy air days now
- 1 days/yr
- Unhealthy air days in 30 yrs
- 1 days/yr
Risk factors via First Street. Map © Google.
Why this score? — see what drove the C+ grade
The composite is a weighted blend of 9 inputs, each scored 0–100. Each bar is that input's sub-score; the figure is the points it added to the 100-point composite (weight × sub-score).
- Cash flow +23.3/30.0
- ARV discount +15.0/15.0
- DSCR +7.5/10.0
- 1% rule +4.9/10.0
- Livability +3.5/5.0
- Rent growth +3.2/5.0
- Schools +3.1/10.0
- Condition / age +2.5/5.0
- Appreciation +0.0/10.0
$180,000
🖨 Deal sheet (PDF) 📄 Offer letter ✓ Due diligence
Listing remarks
Attention investors and handy buyers — this is the opportunity you've been waiting for. Located in the heart of Springdale, just minutes from downtown and JB Hunt Park, this 3-bedroom, 1-bath home has solid bones and is ready for the right buyer to bring it back to life. The big-ticket mechanicals are already done: HVAC replaced in 2019, newer architectural shingle roof, and new double-pane vinyl windows on the front of the home. Inside, you'll find laminate and wood flooring, an eat-in kitchen, ceiling fans, washer/dryer connections, and an unfinished bonus room full of potential. Outside features a covered patio, a 160 sq ft storage building, and 3-sided fencing. Sold As-Is —
Key facts
- Covered patio
- Eat-in kitchen
- 0.45 acre lot
Tags
Property features AI
Finance
- HOA & community: Monthly association fee; Community near schools and a park
Exterior
- Parking: Driveway parking (concrete and gravel)
- Security: Smoke detector(s)
- Utilities: Electricity available; Natural gas available; Public water; Public sewer
- Home design: Single-story; North-facing; Crawlspace foundation; Residential property
- Construction: Vinyl siding; Architectural shingle roof
- Exterior features: Concrete driveway; Gravel driveway; Covered patio; Storage structure; Partially fenced with chain link and wire; City lot near a park in a subdivision; Public road frontage
Interior
- Kitchen: Eat-in kitchen
- Flooring: Laminate flooring; Wood flooring
- Bathrooms: 1 full bathroom
- Heating & cooling: Central heating (gas); Central electric air conditioning
- Interior features: Ceiling fan(s); Eat-in kitchen; Programmable thermostat; Double pane, single pane, vinyl and metal window options
- Laundry & utility: Washer hookup; Dryer hookup; Gas water heater
Neighborhood map
What this means for you Summary
Snapshot
- This is a 3-bed/1.0-bath single-family listed at $180k.
Deal economics
- At list price, monthly cash flow is $331 ($4k/yr) — positive.
- The deal already cash-flows at list — no discount required.
- To meet the 1% rule (rent ≥ 1% of price), the offer needs to be $178k (0.9% below list).
- Recommended offer: $178k (0.9% below list) — sets the bar for 1% rule.
- Cap rate 8.5% vs local median 3.3% in Springdale — top-decile yield for the area; either an underpriced asset or a hidden risk that comps aren't pricing in. Stress-test before assuming the spread holds.
Location & tenants
- Location reads 70/100 on livability (#48 in AR) — a middle-class / working-renter tenant base. Strengths: cost of living A+, housing A+, health & safety A+; Watch: schools D+, commute D+, employment D+.
- Springdale School District (urban): math 38% / reading 35% proficiency, ranked #100 of 238 in AR (top 42%) — families likely to look elsewhere, expect single-tenant / working-renter base with shorter leases.
- Market conditions: Rents rising (+2.9%/yr); 369 active listings in the ZIP; 10 comparable units currently listed for rent nearby; rentals at typical pace (median 24d on market — plan ~3-4 weeks tenant-placement turnaround); 3,494 units permitted in Washington County in 2024 (1,497 in 5+ unit buildings).
- This rent runs 32% of the median local income ($66k/yr) — at the standard rent-burdened threshold; future hikes will face affordability resistance.
Forward outlook
- Local home prices are declining (-3.0%/yr); year-one equity from $1k of loan paydown is wiped out by about $5k of value loss. Plan a longer hold.
- Washington County population projected at +47% by 2050 — long-run rental-demand tailwind backs the buy-and-hold thesis.
Negotiation context
- Only 3 days on market — expect competitive offers; lowballing is unlikely to land.
- Current owner paid $51k; list at $180k implies a 253% gain — meaningful room to come down on a strong offer.
Risks & watch-outs
- Climate carrying-cost: extreme-heat days projected 7→20/yr by 2055 (HVAC capex compounding) — expect insurance premiums to compound above CPI over the hold.
Questions for the listing agent
- Built in 1970 — when were the roof, HVAC, electrical panel, plumbing, and water heater last replaced?
- Is there a deadline driving the sale (1031 exchange, divorce, estate, relocation)? That informs how much negotiation room exists.
- Schools are D-rated, which usually means shorter tenancies and higher turnover. Who's the typical renter profile here, and what's been the actual vacancy rate?
- Crime grade is D in this area — have there been break-ins, vandalism, or insurance claims at this property in the last 3 years? What carrier currently insures it and at what premium?
- What's the average days-on-market for RENTAL listings here right now (not sales)? A rising rental-DOM trend means longer vacancies and softer asking-rent achievability than the comps imply.
- What's the recent tenant-quality profile in this submarket — average credit score on applications, eviction rate, late-payment / NSF rate, and stable-employment percentage? A property-management company in the area should have these aggregated.
- How much new for-sale + rental construction is in the pipeline within 1–3 miles? Heavy new supply typically softens prices + rents 12–24 months out; constrained supply supports both.
Investment metrics
- 1% rule
- 0.99% ✗
- Cap rate
- 8.50%
- Cash-on-cash
- 7.88%
- DSCR
- 1.35
- GRM
- 8.4
CMA / ARV
- ARV (on-the-fly)
- $290,500
- Comps found
- 12
Show comp detail 12 sales within ~0.75 mi
| Address | Dist | Beds/Ba | Sqft | Sold | Price | $/sf | Match |
|---|---|---|---|---|---|---|---|
| 1409 Backus Ave | 0.00mi | 3/1.0 | 1,660 (0%) | 1mo | $175,000 | $105 | 99 |
| 1706 Lawrence Ave | 0.39mi | 3/2.0 | 1,587 (-4%) | 0mo | $286,000 | $180 | 70 |
| 1713 Shelby Ave | 0.46mi | 3/1.0 | 1,511 (-9%) | 2mo | $245,000 | $162 | 62 |
| 1708 Theodore Dr | 0.64mi | 3/2.0 | 1,661 (+0%) | 8mo | $239,000 | $144 | 60 |
| 500 N West End St | 0.32mi | 2/1.0 (-1) | 1,465 (-12%) | 1mo | $290,000 | $198 | 60 |
| 1403 Wilshire Dr | 0.66mi | 3/2.0 | 1,631 (-2%) | 8mo | $270,000 | $166 | 56 |
| 1418 Buena Vista Cir | 0.61mi | 3/2.0 | 1,819 (+10%) | 1mo | $340,000 | $187 | 51 |
| 599 Lawndale Dr | 0.40mi | 4/2.0 (+1) | 1,458 (-12%) | 3mo | $300,000 | $206 | 49 |
| 1809 Taylor Ave | 0.57mi | 3/1.5 | 1,428 (-14%) | 6mo | $245,000 | $172 | 43 |
| 1503 Ridgeview Dr | 0.56mi | 4/2.0 (+1) | 1,859 (+12%) | 9mo | $324,945 | $175 | 38 |
| 1712 Theodore Dr | 0.65mi | 3/2.0 | 1,422 (-14%) | 9mo | $272,000 | $191 | 34 |
| 1487 Ridgeview Dr | 0.56mi | 4/2.0 (+1) | 1,892 (+14%) | 9mo | $331,470 | $175 | 34 |
Match score weights: distance 35% · size 25% · config 20% · recency 20%. Top-matched comps best support the ARV.
Projected returns pro-forma
-3.0% appreciation · 2.87% rent growth · sell at horizon
- IRR
- -4.5%
- Equity multiple
- 0.83×
- Total profit
- $-8,397
- Equity at exit
- $26,839
- IRR
- 5.0%
- Equity multiple
- 1.37×
- Total profit
- $18,571
- Equity at exit
- $15,563
Cash invested: $50,400 (down + closing). Projections, not guarantees.
Landlord ↔ Tenant lean methodology
- Overall (STATE)
- 92 Strongly Landlord-Friendly
- State Arkansas
- 92 Strongly Landlord-Friendly · R+14
- County
- — inherits STATE
- City
- — inherits STATE
ZIP-level market 72764
- Rents YoY
- 2.9%
- Active inventory
- 369
- Price-to-rent
- 8.4×
Monthly cashflow live
- Estimated rent
- $1,784 high interval (Pro) →
- Mortgage (P&I)
- −$944
- Tax from tax record
- −$59 /mo · $709/yr
- Insurance
- −$75
- HOA
- −$0
- Vacancy / Maint / Mgmt
- −$375
- Net cashflow
- $331
Break-even live
Sensitivity live
| Price | -10% $433 | -5% $382 | +0% $331 | +5% $280 | +10% $229 |
|---|---|---|---|---|---|
| Rent | -10% $190 | -5% $261 | +0% $331 | +5% $401 | +10% $472 |
| Rate | -1.0pp $422 | -0.5pp $377 | base $331 | +0.5pp $284 | +1.0pp $237 |
UW: 25.0% down · 7.5% · 30yr · 1.5% tax · 5.0% vac · 8.0% maint · 8.0% mgmt
Financing live
Cash to close
- Down payment
- $45,000
- Closing costs
- $5,400
- Reserves months
- —
- Total cash needed
- —
Loan-product check · same deal, 3 products live
Conventional
25% down · 7.5% · 30yr
- Down + closing
- —
- Monthly P&I
- —
- Monthly cashflow
- —
- DSCR
- —
- Eligible?
- —
Personal DTI + credit; lowest rate.
DSCR
20% down · 8.5% · 30yr
- Down + closing
- —
- Monthly P&I
- —
- Monthly cashflow
- —
- DSCR
- —
- Eligible?
- —
No personal income docs; deal must DSCR.
Hard money
10% down · 12.0% · 12mo
- Down + closing
- —
- Monthly P&I
- —
- Monthly cashflow
- —
- DSCR
- —
- Eligible?
- —
Short-term bridge; refi at stabilization.
Rent comps 10 comps
| Address | Beds | Baths | Sqft | Rent | $/sqft | DOM | Units | Dist |
|---|---|---|---|---|---|---|---|---|
| 1707 Phillips Dr Springdale, AR | 3.0 | 2.0 | 1519 | $1,745 | $1.15 | 24d | 1 | 0.45mi |
| 303 Harve St Springdale, AR | 3.0 | 1.0 | 1312 | $1,550 | $1.18 | 24d | 1 | 0.92mi |
| 303 Grove Ave Unit 1221802P Springdale, AR | 3.0 | 2.0 | 1614 | $4,225 | $2.62 | 22d | 1 | 1.10mi |
| 1489 Bridgeboro Ave Springdale, AR | 4.0 | 2.0 | 1738 | $2,150 | $1.24 | 44d | 1 | 1.14mi |
| 3006 Scott Ln Springdale, AR | 3.0 | 2.0 | 1736 | $2,100 | $1.21 | 24d | 1 | 1.22mi |
| 1216 Highland Ave Unit B Springdale, AR | 2.0 | 1.0 | 1100 | $1,200 | $1.09 | 15d | 1 | 1.32mi |
| 505 E Emma Ave Springdale, AR | 2.0 | 1.0–2.0 | 885 | $2,261 | $2.55 | 14d | 127 | 1.32mi |
| 574 Westford St Springdale, AR | 3.0 | 2.0 | 1656 | $1,850 | $1.12 | 44d | 1 | 1.44mi |
| 257 Arborside Rd Springdale, AR | 1.0–2.0 | 1.0–2.5 | 1022 | $1,575 | $1.54 | 14d | 10 | 1.45mi |
| 303 Park St Apt A Springdale, AR | 2.0 | 2.5 | 1300 | $1,750 | $1.35 | 44d | 1 | 1.46mi |
Listing history 4 events
-
2026-05-11status Pending
-
2026-05-08$180,000 Active
-
2000-03-02soldstatus $51,000
-
1986-03-11soldstatus $39,000
ⓘ Source: listings_history table (triggers on properties + properties_extension) + one-shot
backfill from property_details.listing_events for pre-trigger history.
Tax reassessment forecast AR · Resets to sale price
- Current annual tax
- $709 · $59/mo
- Projected year-2 tax
- $1,152 · $96/mo
- Expected delta
- +$443/yr (+$37/mo · 62.4%)
ⓘ Screening estimate from a state-policy table — verify with the county assessor before closing.
Climate risk First Street
- Flood 1/10 Low FEMA zone X (unshaded) · 0% chance over 30 yrs
- Wildfire 4/10 Moderate
- Heat 5/10 Major 7 d/yr ≥104°F today · 20 d/yr by 30 yrs out
- Wind 2/10 Low 2% chance of damaging wind over 30 yrs
- Air quality 2/10 Low 1 unhealthy d/yr today · 1 by 30 yrs out
Nearby sold comps map
Loading sold comps map…
Walkable amenities ~0.75 mi
Loading nearby amenities…
Taxation est. · year 1
- Rental income
- $21,403
- − Mortgage interest
- −$10,083
- − Property taxes
- −$709
- − Insurance
- −$900
- − Repairs & maintenance
- −$1,712
- − Management
- −$1,712
- − Depreciation
- −$5,236
- Taxable income
- $1,050
- Est. tax owed @ 24.0%
- −$252
- After-tax cash flow
- $3,720/yr
For passive investors: Depreciation is non-cash, so a rental often shows a tax loss while cash-flowing — sheltering income. Rental losses are passive: they offset passive income freely, and up to $25,000/yr can offset ordinary (W-2) income if you actively participate and your MAGI is under $100k (phasing out to $0 by $150k); unused losses carry forward. On sale, claimed depreciation is recaptured at up to 25%, and gains may owe capital-gains tax (a 1031 exchange can defer both). Figures are a year-1 estimate at your 24.0% rate — not tax advice; consult a CPA.
Schools (NCES district)
- District
- Springdale School District
- NCES district ID
- 0512660
- Math proficiency
- 38% ▼ -11.00%
- Reading proficiency
- 35% ▼ -6.00%
- Median HH income
- $45,469
- Composite
- 31.18/100
- National rank
- #6046
- State rank
- #100 of 238 in AR
Livability — Springdale
- Score
- 70/100
- State rank
- #48
- US rank
- #7326
Category grades
Schools grade is shown separately in the Schools card above.
Census & demographics
- Census place
- Springdale, AR
- County
- Washington County · 252,056 people
- City population
- 104,811
- Metro
- Fayetteville-Springdale-Rogers, AR
- Population (ZIP)
- 58,719
- Household income
- $65,898
- Rent vs Own
- Severe rent burden
- 1352.0
Population outlook (Washington County) Hauer SSP2
- Today (2025)
- 271,748 people
- By 2030
- 296,414 · +9.1%
- By 2040
- 346,874 · +27.6%
- By 2050
- 398,552 · +46.7%
- By 2075
- 523,309 · +92.6%
- By 2100
- 615,280 · +126.4%
Race, ethnicity, and origin ACS 2023
- Neighborhood character
- Diverse neighborhood (Simpson 0.70)
- Race & ethnicity
- Hispanic / Latino 44% White 33% Two or more races 28% Pacific Islander 11% Black 3% Asian 2% Native American 2%
- Hispanic origin (detail)
- Mexican 32% Puerto Rican 1%
- Common ancestry
- Romanian 1% Slovak 1% Italian 1%
- Foreign-born
- 28% · Canada
- Languages at home
- 58% English-only · Spanish 32% Other Asian/Pacific 9% Russian/Polish/Slavic 1%
Political lean MEDSL · Washington
- 2024 margin
- Lean R (+6.7) · D 45.1% · R 51.7% · Other 3.2%
- 2008→2024 swing
- +6.4pp toward D · 2008: -13.1pp · 2024: -6.7pp
- All cycles
- 2024: R+6.7 2020: R+3.9 2016: R+10.4 2012: R+16.3 2008: R+13.1
Not yet ingested
- Civics
- —
Market trends
- HPI YoY
- ▼ -269.05%
- Current HPI
- 297.924
- Rent YoY
- ▲ 2.87%
- Metro
- Fayetteville-Springdale-Rogers, AR
- State GDP YoY
- ▲ 3.80%
- F500 in state
- 10
Industry mix (Fortune 500 HQ in AR)
| Industry | F500 HQs | Revenue |
|---|---|---|
| Retail | 1 | $681B |
|
||
| Food / Agriculture | 1 | $53B |
|
||
| Retail / Energy | 1 | $22B |
|
||
| Transportation / Logistics | 1 | $12B |
|
||
| Energy | 1 | $4B |
|
||
Price history
+361.5% since first listed4 events — show timeline
- 2026-05-11 Pending — NWARMLS
- 2026-05-08 Listed $180,000 NWARMLS
- 2000-03-02 Sold (Public Records) $51,000 Public Records
- 1986-03-11 Sold (Public Records) $39,000 Public Records
Property tax history
-0.7%/yrLatest (2025): $709 · -5.4% YoY. Source: county tax records.
Cash-flow waterfall
monthlySold comps — $/sqft
last 12 mo · ≤1 miLoading sold comps…