 🌊 Lakefront
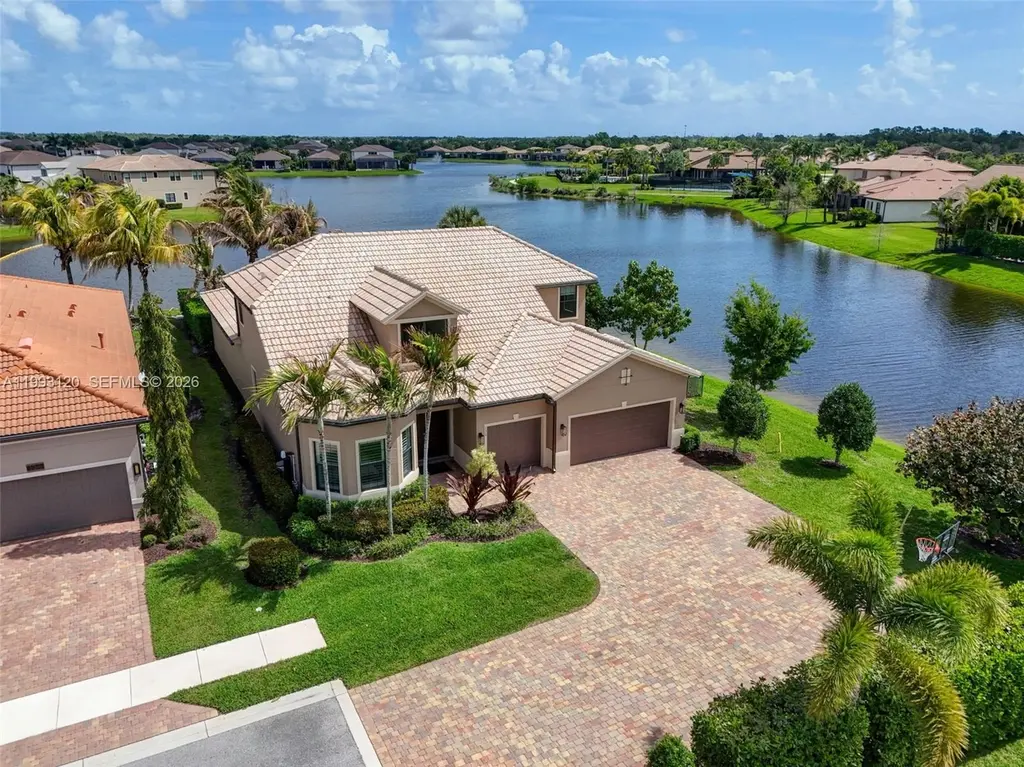
130 Blanca Isles Ln · Jupiter, FL
Flood risk 1/10 · Minimal
- FEMA flood zone
- X (unshaded)
- Chance of flooding over 30 yrs
- 0.0%
- Est. flood insurance / yr
- $507 – $1,088
Fire risk 3/10 · Minor
- Est. fire insurance / yr
- $947 – $1,759
Heat risk 9/10 · Severe
- Hot days now (above 106°F)
- 5 days/yr
- Hot days in 30 yrs
- 17 days/yr
Wind risk 10/10 · Severe
- Chance of severe wind over 30 yrs
- 99.0%
Air-quality risk 1/10 · Minimal
- Unhealthy air days now
- 0 days/yr
- Unhealthy air days in 30 yrs
- 0 days/yr
Risk factors via First Street. Map © Google.
Why this score? — see what drove the C+ grade
The composite is a weighted blend of 9 inputs, each scored 0–100. Each bar is that input's sub-score; the figure is the points it added to the 100-point composite (weight × sub-score).
- Cash flow +27.2/30.0
- DSCR +9.5/10.0
- ARV discount +7.5/15.0
- 1% rule +7.1/10.0
- Schools +4.3/10.0
- Livability +3.5/5.0
- Rent growth +2.5/5.0
- Condition / age +2.5/5.0
- Appreciation +0.0/10.0
$1,825,000
🖨 Deal sheet 📄 Offer letter ✓ Due diligence
Listing remarks
Experience breathtaking wraparound lakefront views from this exceptional 4 bedroom plus flex space, 4 bath Stonewater model home, ideally located on a quiet cul-de-sac within the highly sought after, gated community of Sonoma Isles. An extra long multi car driveway enhances curb appeal and provides ample parking for family and guests. Designed with elegance and functionality in mind, the home features a bright, open floorplan centered around a beautifully upgraded kitchen with espresso cabinetry, quartz countertops, oversized island, gas range, pot filler, wall oven, & walk in pantry—perfect for entertaining and everyday living. The primary suite offers a peaceful retreat with tr
Key facts
- Upgraded kitchen
- Walk in pantry
- 0.36 acre lot
Tags
Property features AI
Finance
- Other: Community pool and spa (community amenities); Frontage length 252 feet
- Financial info: No pet restrictions (pets allowed); Pet comments: None
- HOA & community: Homeowners association (monthly fee); Monthly association fee of $655; Association covers common area maintenance, grounds maintenance, and recreation facilities; Community clubhouse, fitness center, game room, pool, tennis courts, pickleball courts; Gated, maintained community with on-site property manager, street lights and sidewalks
Exterior
- Parking: Attached 3-car garage; Driveway; Paver block; Garage door opener
- Security: Gated community; Smoke detectors; Security/high impact doors
- Utilities: Public water; Public sewer; Cable available; Underground utilities; Gas water heater
- Home design: Two-story residence; Stonewater two-story model; Spanish tile roof; Block construction
- Construction: Block construction; Spanish tile roof
- Exterior features: Enclosed porch; Fence; Patio; Room for pool; Screened porch; Sprinklers (automatic); Security/high impact doors; Is waterfront (lake front); Has view; South-facing
Interior
- Kitchen: Built-in oven; Gas range; Dishwasher; Disposal; Microwave; Refrigerator; Wine cooler; Kitchen island; Pantry; Breakfast bar/area
- Bedrooms: Primary suite on main level; Bedroom on main level
- Flooring: Carpet; Tile
- Bathrooms: 4 full bathrooms; Dual sinks in bath(s)
- Heating & cooling: Central heating; Central air; Ceiling fans
- Interior features: Impact glass windows; Breakfast bar; Built-in features; Breakfast area; Closet cabinetry; Dual sinks; First floor entry; Kitchen island; Living/dining room; Pantry; Walk-in closets; Attic; Loft; Unfurnished
- Laundry & utility: Washer; Dryer; Laundry tub; Utility room; Generator
Neighborhood map
What this means for you Summary
Snapshot
- This is a 4-bed/4.0-bath single-family listed at $1.82M.
Deal economics
- At list price, monthly cash flow is $5k ($63k/yr) — positive.
- The deal already cash-flows at list — no discount required.
- Meets the 1% rule at list price ($22k rent vs $1.82M).
- Recommended offer: $1.72M (6.0% below list) — sets the bar for market timing.
- Cap rate 9.7% vs local median 2.6% in Jupiter — top-decile yield for the area; either an underpriced asset or a hidden risk that comps aren't pricing in. Stress-test before assuming the spread holds.
Location & tenants
- Location reads 70/100 on livability (#415 in FL) — a middle-class / working-renter tenant base. Strengths: crime A+, employment A+, housing A+; Watch: amenities F, commute F, cost of living F.
- Palm Beach (suburban): math 46% / reading 53% proficiency, ranked #34 of 73 in FL (top 47%) — families likely to look elsewhere, expect single-tenant / working-renter base with shorter leases.
- Market conditions: 126 active listings in the ZIP; 6 comparable units currently listed for rent nearby; rentals at typical pace (median 24d on market — plan ~3-4 weeks tenant-placement turnaround); 3,974 units permitted in Palm Beach County in 2024 (1,012 in 5+ unit buildings).
Forward outlook
- Local home prices are declining (-3.0%/yr); year-one equity from $13k of loan paydown is wiped out by about $55k of value loss. Plan a longer hold.
- Palm Beach County population projected at +30% by 2050 — long-run rental-demand tailwind backs the buy-and-hold thesis.
- At projected returns (-3.0% appreciation + 3.0% rent growth), your $511k cash investment doubles in ~10 years — after that, you're playing with house money.
Negotiation context
- It's been on market 76 days — a 6% lower offer ($1.72M) is reasonable based on typical stale-listing flexibility.
Risks & watch-outs
- Climate carrying-cost: severe wind risk, 99% chance of damaging wind over 30y; extreme-heat days projected 5→17/yr by 2055 (HVAC capex compounding) — expect insurance premiums to compound above CPI over the hold.
Questions for the listing agent
- It's been on market 76 days. Have you received any prior offers? Is the seller open to a 6% concession, seller financing, or rate buy-down credit?
- What does the HOA fee cover, when was the last increase, and are there any pending special assessments or reserve-fund shortfalls?
- Why hasn't it sold? Are there any deal-killer items the seller is aware of (foundation, flood, title, zoning, code violations)?
- Is there a deadline driving the sale (1031 exchange, divorce, estate, relocation)? That informs how much negotiation room exists.
- Schools are A-rated — typically a magnet for longer-tenancy family renters. What's the average tenant stay here, and is there a school-zone premium baked into asking?
- This sits on a lake — are riparian / water-frontage rights deeded with the parcel? Any dock permits, shoreline easements, or HOA water-use restrictions?
- What's the documented flood / surge / shoreline-erosion history here (FEMA AND non-FEMA — e.g., storm surge, creek backup, septic-field saturation)?
- Any water-quality or seasonal algae-bloom issues that affect tenant satisfaction or short-term-rental demand?
- What's the average days-on-market for RENTAL listings here right now (not sales)? A rising rental-DOM trend means longer vacancies and softer asking-rent achievability than the comps imply.
- What's the recent tenant-quality profile in this submarket — average credit score on applications, eviction rate, late-payment / NSF rate, and stable-employment percentage? A property-management company in the area should have these aggregated.
- How much new for-sale + rental construction is in the pipeline within 1–3 miles? Heavy new supply typically softens prices + rents 12–24 months out; constrained supply supports both.
Investment metrics
- 1% rule
- 1.21% ✓
- Cap rate
- 9.73%
- Cash-on-cash
- 12.28%
- DSCR
- 1.55
- GRM
- 6.9
CMA / ARV
No comps found within radius.
Projected returns pro-forma
-3.0% appreciation · 3.0% rent growth · sell at horizon
- IRR
- 1.9%
- Equity multiple
- 1.07×
- Total profit
- $37,505
- Equity at exit
- $272,113
- IRR
- 11.5%
- Equity multiple
- 1.90×
- Total profit
- $462,118
- Equity at exit
- $157,793
Cash invested: $511,000 (down + closing). Projections, not guarantees.
Landlord ↔ Tenant lean methodology
- Overall (STATE)
- 87 Strongly Landlord-Friendly
- State Florida
- 87 Strongly Landlord-Friendly · R+3
- County
- — inherits STATE
- City
- — inherits STATE
ZIP-level market 33478
- Active inventory
- 126
- Price-to-rent
- 6.9×
Monthly cashflow live
- Estimated rent
- $22,169 high interval (Pro) →
- Mortgage (P&I)
- −$9,570
- Tax from tax record
- −$1,298 /mo · $15,573/yr
- Insurance
- −$760
- HOA
- −$655
- Vacancy / Maint / Mgmt
- −$4,656
- Net cashflow
- $5,230
Break-even live
UW: 25.0% down · 7.5% · 30yr · 1.5% tax · 5.0% vac · 8.0% maint · 8.0% mgmt
Financing live
Cash to close
- Down payment
- $456,250
- Closing costs
- $54,750
- Reserves months
- —
- Total cash needed
- —
Loan-product check · same deal, 3 products live
Conventional
25% down · 7.5% · 30yr
- Down + closing
- —
- Monthly P&I
- —
- Monthly cashflow
- —
- DSCR
- —
- Eligible?
- —
Personal DTI + credit; lowest rate.
DSCR
20% down · 8.5% · 30yr
- Down + closing
- —
- Monthly P&I
- —
- Monthly cashflow
- —
- DSCR
- —
- Eligible?
- —
No personal income docs; deal must DSCR.
Hard money
10% down · 12.0% · 12mo
- Down + closing
- —
- Monthly P&I
- —
- Monthly cashflow
- —
- DSCR
- —
- Eligible?
- —
Short-term bridge; refi at stabilization.
Rent comps 6 comps
| Address | Beds | Baths | Sqft | Rent | $/sqft | DOM | Units | Dist |
|---|---|---|---|---|---|---|---|---|
| 141 Cinder Dunes Pt Jupiter, FL | 4.0 | 4.0 | 3856 | $20,000 | $5.19 | 24d | 1 | 0.24mi |
| 182 Rosalia Ct Jupiter, FL | 4.0 | 4.5 | 4000 | $25,000 | $6.25 | 24d | 1 | 0.65mi |
| 179 Carmela Ct Jupiter, FL | 3.0 | 4.5 | 3930 | $30,000 | $7.63 | 18d | 1 | 0.82mi |
| 131 Carmela Ct Jupiter, FL | 5.0 | 5.5 | 4463 | $22,000 | $4.93 | 20d | 1 | 0.82mi |
| 18363 Island Oak Ave Jupiter, FL | 5.0 | 4.0 | 3833 | $18,000 | $4.70 | 24d | 1 | 0.94mi |
| 183 Rudder Cay Way Jupiter, FL | 5.0 | 3.0 | 2972 | $6,000 | $2.02 | 5d | 1 | 0.96mi |
HOA detail
- Monthly dues
- $655 · $7,860/yr
- Likely covers
- watergassecurity
Listing history 14 events
-
2026-06-18days on market $1,825,000 Active 76 DOM
-
2026-06-17days on market $1,825,000 Active 75 DOM
-
2026-06-16days on market $1,825,000 Active 74 DOM
-
2026-06-15pricedays on market $1,825,000 Active 73 DOM
-
2026-06-13days on market $1,890,000 Active 71 DOM
-
2026-06-09days on market $1,890,000 Active 67 DOM
-
2026-06-08days on market $1,890,000 Active 66 DOM
-
2026-06-07days on market $1,890,000 Active 65 DOM
-
2026-06-04days on market $1,890,000 Active 62 DOM
-
2026-06-03days on market $1,890,000 Active 61 DOM
-
2026-06-02days on market $1,890,000 Active 60 DOM
-
2026-06-01days on market $1,890,000 Active 59 DOM
-
2026-05-31days on market $1,890,000 Active 58 DOM
-
2026-04-02$1,945,000 Active
ⓘ Source: listings_history table (triggers on properties + properties_extension) + one-shot
backfill from property_details.listing_events for pre-trigger history.
Tax reassessment forecast FL · Resets to sale price
- Current annual tax
- $15,573 · $1,298/mo
- Projected year-2 tax
- $15,573 · $1,298/mo
- Expected delta
- $0/yr ($0/mo · 0.0%)
ⓘ Screening estimate from a state-policy table — verify with the county assessor before closing.
Climate risk First Street
- Flood 1/10 Low FEMA zone X (unshaded) · 0% chance over 30 yrs
- Wildfire 3/10 Moderate
- Heat 9/10 Extreme 5 d/yr ≥106°F today · 17 d/yr by 30 yrs out
- Wind 10/10 Extreme 99% chance of damaging wind over 30 yrs
- Air quality 1/10 Low 0 unhealthy d/yr today · 0 by 30 yrs out
Nearby sold comps map
Loading sold comps map…
Walkable amenities ~0.75 mi
Loading nearby amenities…
Taxation est. · year 1
- Rental income
- $266,030
- − Mortgage interest
- −$102,228
- − Property taxes
- −$15,573
- − Insurance
- −$9,125
- − Repairs & maintenance
- −$21,282
- − Management
- −$21,282
- − HOA
- −$7,860
- − Depreciation
- −$53,091
- Taxable income
- $35,588
- Est. tax owed @ 24.0%
- −$8,541
- After-tax cash flow
- $54,219/yr
For passive investors: Depreciation is non-cash, so a rental often shows a tax loss while cash-flowing — sheltering income. Rental losses are passive: they offset passive income freely, and up to $25,000/yr can offset ordinary (W-2) income if you actively participate and your MAGI is under $100k (phasing out to $0 by $150k); unused losses carry forward. On sale, claimed depreciation is recaptured at up to 25%, and gains may owe capital-gains tax (a 1031 exchange can defer both). Figures are a year-1 estimate at your 24.0% rate — not tax advice; consult a CPA.
Schools (NCES district)
- District
- Palm Beach
- NCES district ID
- 1201500
- Math proficiency
- 46% ▼ -16.00%
- Reading proficiency
- 53% ▼ -4.00%
- Median HH income
- $53,943
- Composite
- 42.72/100
- National rank
- #3160
- State rank
- #34 of 73 in FL
Livability — Jupiter
- Score
- 70/100
- State rank
- #415
- US rank
- #7386
Category grades
Schools grade is shown separately in the Schools card above.
Census & demographics
- Census place
- Jupiter, FL
- City population
- 68,420
- Population (ZIP)
- 15,205
Population outlook (Palm Beach County) Hauer SSP2
- Today (2025)
- 1,637,487 people
- By 2030
- 1,743,255 · +6.5%
- By 2040
- 1,948,712 · +19.0%
- By 2050
- 2,132,979 · +30.3%
- By 2075
- 2,530,027 · +54.5%
- By 2100
- 2,706,979 · +65.3%
Race, ethnicity, and origin ACS 2023
- Neighborhood character
- Predominantly White (80%)
- Race & ethnicity
- White 80% Two or more races 14% Hispanic / Latino 8% Asian 3%
- Hispanic origin (detail)
- Puerto Rican 1% Cuban 1%
- Common ancestry
- Slovak 4% Romanian 4% Italian 3%
- Foreign-born
- 10% · Canada, China, Vietnam
- Languages at home
- 86% English-only · Spanish 5% Other Indo-European 4% Russian/Polish/Slavic 1%
Political lean MEDSL · Palm Beach
- 2024 margin
- Toss-up / Even · D 50.0% · R 49.2%
- 2008→2024 swing
- -22.1pp toward R · 2008: 22.9pp · 2024: 0.8pp
- All cycles
- 2024: D+0.8 2020: D+12.8 2016: D+15.3 2012: D+17.0 2008: D+22.9
Not yet ingested
- Civics
- —
Market trends
- HPI YoY
- ▼ -306.11%
- Current HPI
- 427.5178
- Rent YoY
- —
- Metro
- —
- State GDP YoY
- ▲ 3.28%
- F500 in state
- 36
Industry mix (Fortune 500 HQ in FL)
| Industry | F500 HQs | Revenue |
|---|---|---|
| Industrial Technology | 2 | $29B |
|
||
| Insurance | 2 | $17B |
|
||
| Retail | 1 | $60B |
|
||
| Technology Distribution | 1 | $58B |
|
||
| Homebuilding | 1 | $35B |
|
||
| Technology Manufacturing | 1 | $35B |
|
||
Price history
1 event — show timeline
- 2026-04-02 Listed $1,945,000 MARMLS
Property tax history
+22.1%/yrLatest (2025): $15,573 · +3.0% YoY. Source: county tax records.
Cash-flow waterfall
monthlySold comps — $/sqft
last 12 mo · ≤1 miLoading sold comps…