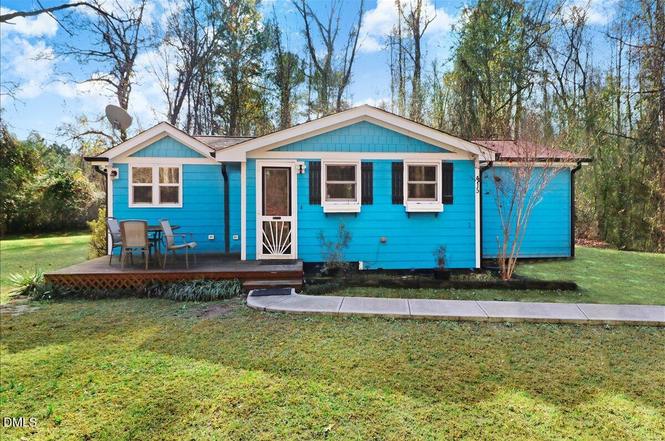
415 Barbour Rd · Smithfield, NC
Flood risk 1/10 · Minimal
- FEMA flood zone
- X (unshaded)
- Chance of flooding over 30 yrs
- 0.0%
- Est. flood insurance / yr
- $507 – $1,088
Fire risk 4/10 · Minor
- Est. fire insurance / yr
- $906 – $1,684
Heat risk 6/10 · Moderate
- Hot days now (above 105°F)
- 7 days/yr
- Hot days in 30 yrs
- 17 days/yr
Wind risk 6/10 · Moderate
- Chance of severe wind over 30 yrs
- 76.0%
Air-quality risk 2/10 · Minimal
- Unhealthy air days now
- 1 days/yr
- Unhealthy air days in 30 yrs
- 1 days/yr
Risk factors via First Street. Map © Google.
Why this score? — see what drove the F grade
The composite is a weighted blend of 9 inputs, each scored 0–100. Each bar is that input's sub-score; the figure is the points it added to the 100-point composite (weight × sub-score).
- Cash flow +7.9/30.0
- ARV discount +4.2/15.0
- Schools +3.5/10.0
- Livability +3.3/5.0
- Condition / age +2.5/5.0
- Rent growth +2.2/5.0
- DSCR +1.9/10.0
- 1% rule +1.6/10.0
- Appreciation +0.0/10.0
$225,000
🖨 Deal sheet (PDF) 📄 Offer letter ✓ Due diligence
Listing remarks MLS
Great country setting! 1 acre lot with this well maintained singlewide. Great condition, convenient location and just perfect for enjoying the country life. 31'x31' detach garage/workshop with bathroom.
Key facts
- Convenient location
- Carport added
- Connected to sewer
Tags
Neighborhood map
What this means for you Summary
Snapshot
- This is a 2-bed/1.0-bath single-family listed at $225k.
Deal economics
- At list price, monthly cash flow is $-244 ($-3k/yr) — negative.
- To cash-flow at today's rent, offer at most $182k (19.1% below list).
- To meet the 1% rule (rent ≥ 1% of price), the offer needs to be $149k (33.9% below list).
- Recommended offer: $149k (33.9% below list) — sets the bar for 1% rule.
- Cap rate 5.0% vs local median 3.8% in Smithfield — top-decile yield for the area; either an underpriced asset or a hidden risk that comps aren't pricing in. Stress-test before assuming the spread holds.
Location & tenants
- Location reads 66/100 on livability (#259 in NC) — a middle-class / working-renter tenant base. Strengths: cost of living A+, health & safety A+, housing B+; Watch: crime F, amenities F, commute F.
- Johnston County Public Schools (rural): math 39% / reading 42% proficiency, ranked #105 of 178 in NC (top 59%) — families likely to look elsewhere, expect single-tenant / working-renter base with shorter leases.
- Zoned schools: Wilson'S Mills Elementary (math 22% / reading 23%, grade F, #1,175 of 1,410 statewide, top 84%, 503 students, 82% FRL); Smithfield Middle (math 20% / reading 32%, grade F, #385 of 475 statewide, top 81%, 501 students, 99% FRL); Smithfield-Selma High (math 25% / reading 37%, grade F, #454 of 535 statewide, top 85%, 1,503 students, 69% FRL) — zoned schools average 84% FRL vs 41% district-wide (43 pts higher); higher-poverty schools than district average — tighter screening recommended.
- Zoned-school proficiency averages 26% at this address vs 40% district-wide (-14 pts) — the specific schools serving this property underperform the Johnston County Public Schools average; the district grade overstates school quality for this exact location.
- Market conditions: Rents soft (-1.1%/yr); 407 active listings in the ZIP; 1 comparable units currently listed for rent nearby; 2,783 units permitted in Johnston County in 2024 (6 in 5+ unit buildings).
Forward outlook
- Local home prices are declining (-3.0%/yr); year-one equity from $2k of loan paydown is wiped out by about $7k of value loss. Plan a longer hold.
- Johnston County population projected at +37% by 2050 — long-run rental-demand tailwind backs the buy-and-hold thesis.
Negotiation context
- It's been on market 139 days — a 12% lower offer ($198k) is reasonable based on typical stale-listing flexibility.
- 12 sale attempts since 19y ago; this cycle's ask has dropped $20k (8%) from the opening price — seller is motivated, your offer sets the floor, not the list.
- Current owner paid $125k; list at $225k implies a 80% gain — meaningful room to come down on a strong offer.
Risks & watch-outs
- Watch-outs: built in 1959 — expect roof / HVAC / electrical / plumbing capex.
- Climate carrying-cost: major wind risk, 76% chance of damaging wind over 30y; extreme-heat days projected 7→17/yr by 2055 (HVAC capex compounding) — expect insurance premiums to compound above CPI over the hold.
Questions for the listing agent
- What do current leases actually rent for vs. the listed asking? Can we see a recent rent roll and the last 12 months of T-12 income?
- It's been on market 139 days. Have you received any prior offers? Is the seller open to a 34% concession, seller financing, or rate buy-down credit?
- Built in 1959 — when were the roof, HVAC, electrical panel, plumbing, and water heater last replaced?
- Why hasn't it sold? Are there any deal-killer items the seller is aware of (foundation, flood, title, zoning, code violations)?
- Is there a deadline driving the sale (1031 exchange, divorce, estate, relocation)? That informs how much negotiation room exists.
- Schools are F-rated, which usually means shorter tenancies and higher turnover. Who's the typical renter profile here, and what's been the actual vacancy rate?
- Crime grade is F in this area — have there been break-ins, vandalism, or insurance claims at this property in the last 3 years? What carrier currently insures it and at what premium?
- The area grade is low — what's the realistic commute time and amenity access for the typical tenant pool here? Any planned neighborhood developments (good or bad) we should know about?
- What's the average days-on-market for RENTAL listings here right now (not sales)? A rising rental-DOM trend means longer vacancies and softer asking-rent achievability than the comps imply.
- What's the recent tenant-quality profile in this submarket — average credit score on applications, eviction rate, late-payment / NSF rate, and stable-employment percentage? A property-management company in the area should have these aggregated.
- How much new for-sale + rental construction is in the pipeline within 1–3 miles? Heavy new supply typically softens prices + rents 12–24 months out; constrained supply supports both.
Investment metrics
- 1% rule
- 0.66% ✗
- Cap rate
- 4.99%
- Cash-on-cash
- -4.64%
- DSCR
- 0.79
- GRM
- 12.6
CMA / ARV
- ARV (on-the-fly)
- $209,760
- Comps found
- 8
Show comp detail 8 sales within ~0.75 mi
| Address | Dist | Beds/Ba | Sqft | Sold | Price | $/sf | Match |
|---|---|---|---|---|---|---|---|
| 414 Laurel Dr | 0.25mi | 2/1.5 | 950 (+4%) | 9mo | $150,000 | $158 | 72 |
| 103 Phillips St | 0.49mi | 2/1.0 | 983 (+8%) | 5mo | $190,000 | $193 | 60 |
| 322 Pace St | 0.63mi | 2/1.0 | 986 (+8%) | 9mo | $226,450 | $230 | 50 |
| 303 Stancil St | 0.56mi | 3/1.0 (+1) | 1,017 (+12%) | 1mo | $208,000 | $205 | 49 |
| 201 Barbour Rd | 0.23mi | 3/2.0 (+1) | 1,013 (+11%) | 16mo | $250,000 | $247 | 49 |
| 320 Pace St | 0.62mi | 3/1.0 (+1) | 988 (+8%) | 6mo | $230,000 | $233 | 47 |
| 509 Powell St | 0.51mi | 3/1.0 (+1) | 990 (+9%) | 15mo | $236,000 | $238 | 44 |
| 200 Pace St | 0.59mi | 3/1.0 (+1) | 1,008 (+10%) | 12mo | $230,000 | $228 | 40 |
Match score weights: distance 35% · size 25% · config 20% · recency 20%. Top-matched comps best support the ARV.
Projected returns pro-forma
-3.0% appreciation · 0.0% rent growth · sell at horizon
- IRR
- -27.2%
- Equity multiple
- 0.10×
- Total profit
- $-56,403
- Equity at exit
- $33,548
- IRR
- -38.6%
- Equity multiple
- -0.37×
- Total profit
- $-86,202
- Equity at exit
- $19,454
Cash invested: $63,000 (down + closing). Projections, not guarantees.
Landlord ↔ Tenant lean methodology
- Overall (STATE)
- 85 Strongly Landlord-Friendly
- State North Carolina
- 85 Strongly Landlord-Friendly · R+3
- County
- — inherits STATE
- City
- — inherits STATE
ZIP-level market 27577
- Home prices YoY
- -23.7%
- Rents YoY
- -1.1%
- Active inventory
- 407
- Price-to-rent
- 12.6×
Monthly cashflow live
- Estimated rent
- $1,488 medium interval (Pro) →
- Mortgage (P&I)
- −$1,180
- Tax from tax record
- −$146 /mo · $1,746/yr
- Insurance
- −$94
- HOA
- −$0
- Vacancy / Maint / Mgmt
- −$312
- Net cashflow
- $-244
Break-even live
Sensitivity live
| Price | -10% $-116 | -5% $-180 | +0% $-244 | +5% $-307 | +10% $-371 |
|---|---|---|---|---|---|
| Rent | -10% $-361 | -5% $-302 | +0% $-244 | +5% $-185 | +10% $-126 |
| Rate | -1.0pp $-130 | -0.5pp $-186 | base $-244 | +0.5pp $-302 | +1.0pp $-361 |
UW: 25.0% down · 7.5% · 30yr · 1.5% tax · 5.0% vac · 8.0% maint · 8.0% mgmt
Financing live
Cash to close
- Down payment
- $56,250
- Closing costs
- $6,750
- Reserves months
- —
- Total cash needed
- —
Loan-product check · same deal, 3 products live
Conventional
25% down · 7.5% · 30yr
- Down + closing
- —
- Monthly P&I
- —
- Monthly cashflow
- —
- DSCR
- —
- Eligible?
- —
Personal DTI + credit; lowest rate.
DSCR
20% down · 8.5% · 30yr
- Down + closing
- —
- Monthly P&I
- —
- Monthly cashflow
- —
- DSCR
- —
- Eligible?
- —
No personal income docs; deal must DSCR.
Hard money
10% down · 12.0% · 12mo
- Down + closing
- —
- Monthly P&I
- —
- Monthly cashflow
- —
- DSCR
- —
- Eligible?
- —
Short-term bridge; refi at stabilization.
Rent comps 1 comps
| Address | Beds | Baths | Sqft | Rent | $/sqft | DOM | Units | Dist |
|---|---|---|---|---|---|---|---|---|
| 206 Britt St Smithfield, NC | 3.0 | 1.0 | 1118 | $1,650 | $1.48 | 25d | 1 | 0.83mi |
Listing history 38 events
-
2026-04-27status Pending
-
2026-04-22status Active
-
2026-04-17status Pending
-
2026-03-28price $225,000
-
2025-12-04$245,000 Active
-
2022-04-22soldstatus $125,000 Closed 202-char remark
Show marketing remark (202 chars)
Great country setting! 1 acre lot with this well maintained singlewide. Great condition, convenient location and just perfect for enjoying the country life. 31'x31' detach garage/workshop with bathroom.
-
2022-03-07status Pending 202-char remark
Show marketing remark (202 chars)
Great country setting! 1 acre lot with this well maintained singlewide. Great condition, convenient location and just perfect for enjoying the country life. 31'x31' detach garage/workshop with bathroom.
-
2022-03-02$139,900 Active 202-char remark
Show marketing remark (202 chars)
Great country setting! 1 acre lot with this well maintained singlewide. Great condition, convenient location and just perfect for enjoying the country life. 31'x31' detach garage/workshop with bathroom.
-
2021-09-28historical
-
2021-09-09price $139,900
-
2021-08-29price $149,900
-
2021-08-16$155,900 Active
-
2019-05-10soldstatus $135,000
-
2019-05-10soldstatus $135,000 Closed
-
2019-05-10soldstatus $135,000
-
2019-04-13status Pending
-
2019-03-22historical Contingent
-
2019-03-20$129,900
-
2019-03-19$129,900 Active
-
2016-07-06soldstatus $71,900 Closed
-
2016-05-11historical Contingent
-
2016-03-24$74,700 Active
-
2013-09-30soldstatus $69,000
-
2013-09-27soldstatus $69,000 Closed
-
2013-07-15historical Contingent
-
2013-06-27$69,000 Active
-
2009-05-14soldstatus $23,000
-
2009-05-14soldstatus $23,000
-
2009-04-18historical
-
2009-04-09soldstatus $23,000
-
2008-09-11$27,000
-
2008-09-11$27,000
-
2007-05-30soldstatus $28,000
-
2007-05-30soldstatus $28,000
-
2007-04-10$29,900
-
2007-04-10$29,900
-
1999-12-01soldstatus $29,000
-
1999-10-01soldstatus $15,000
ⓘ Source: listings_history table (triggers on properties + properties_extension) + one-shot
backfill from property_details.listing_events for pre-trigger history.
Tax reassessment forecast NC · Resets to sale price
- Current annual tax
- $1,746 · $146/mo
- Projected year-2 tax
- $1,845 · $154/mo
- Expected delta
- +$99/yr (+$8/mo · 5.7%)
ⓘ Screening estimate from a state-policy table — verify with the county assessor before closing.
Climate risk First Street
- Flood 1/10 Low FEMA zone X (unshaded) · 0% chance over 30 yrs
- Wildfire 4/10 Moderate
- Heat 6/10 Major 7 d/yr ≥105°F today · 17 d/yr by 30 yrs out
- Wind 6/10 Major 76% chance of damaging wind over 30 yrs
- Air quality 2/10 Low 1 unhealthy d/yr today · 1 by 30 yrs out
Nearby sold comps map
Loading sold comps map…
Walkable amenities ~0.75 mi
Loading nearby amenities…
Taxation est. · year 1
- Rental income
- $17,855
- − Mortgage interest
- −$12,603
- − Property taxes
- −$1,746
- − Insurance
- −$1,125
- − Repairs & maintenance
- −$1,428
- − Management
- −$1,428
- − Depreciation
- −$6,545
- Taxable loss
- −$7,022
- Est. tax savings @ 24.0%
- +$1,685
- After-tax cash flow
- $-1,239/yr
For passive investors: Depreciation is non-cash, so a rental often shows a tax loss while cash-flowing — sheltering income. Rental losses are passive: they offset passive income freely, and up to $25,000/yr can offset ordinary (W-2) income if you actively participate and your MAGI is under $100k (phasing out to $0 by $150k); unused losses carry forward. On sale, claimed depreciation is recaptured at up to 25%, and gains may owe capital-gains tax (a 1031 exchange can defer both). Figures are a year-1 estimate at your 24.0% rate — not tax advice; consult a CPA.
Schools (NCES district)
- District
- Johnston County Public Schools
- NCES district ID
- 3702370
- Math proficiency
- 39% ▲ 4.00%
- Reading proficiency
- 42% ▲ 2.00%
- Median HH income
- $50,912
- Composite
- 34.99/100
- National rank
- #5052
- State rank
- #105 of 178 in NC
Livability — Smithfield
- Score
- 66/100
- State rank
- #259
- US rank
- #11380
Category grades
Schools grade is shown separately in the Schools card above.
Census & demographics
- Census place
- Smithfield, NC
- County
- Johnston County · 175,441 people
- City population
- 28,354
- Metro
- Raleigh-Cary, NC
- Population (ZIP)
- 28,354
- Household income
- $62,758
- Rent vs Own
- Severe rent burden
- 919.0
Population outlook (Johnston County) Hauer SSP2
- Today (2025)
- 222,440 people
- By 2030
- 240,227 · +8.0%
- By 2040
- 274,616 · +23.5%
- By 2050
- 304,915 · +37.1%
- By 2075
- 369,507 · +66.1%
- By 2100
- 406,280 · +82.6%
Race, ethnicity, and origin ACS 2023
- Neighborhood character
- Diverse neighborhood (Simpson 0.60)
- Race & ethnicity
- White 57% Hispanic / Latino 21% Black 19% Two or more races 7% Asian 1%
- Hispanic origin (detail)
- Mexican 13% Puerto Rican 2% Dominican 1%
- Common ancestry
- Lithuanian 2% Serbian 2% Slovak 1%
- Foreign-born
- 12% · Canada, Jamaica, South Korea
- Languages at home
- 80% English-only · Spanish 19%
Political lean MEDSL · Johnston
- 2024 margin
- Strong R (+21.5) · D 38.7% · R 60.2% · Other 1.1%
- 2008→2024 swing
- +2.2pp toward D · 2008: -23.7pp · 2024: -21.5pp
- All cycles
- 2024: R+21.5 2020: R+24.3 2016: R+30.7 2012: R+27.8 2008: R+23.7
Not yet ingested
- Civics
- —
Market trends
- HPI YoY
- ▼ -72.11%
- Current HPI
- 232.1552
- Rent YoY
- ▼ -1.05%
- Metro
- Raleigh-Cary, NC
- State GDP YoY
- ▲ 3.28%
- F500 in state
- 26
Industry mix (Fortune 500 HQ in NC)
| Industry | F500 HQs | Revenue |
|---|---|---|
| Financial Services | 2 | $213B |
|
||
| Retail | 2 | $95B |
|
||
| Industrial Conglomerate | 1 | $38B |
|
||
| Metals / Steel | 1 | $35B |
|
||
| Utilities | 1 | $30B |
|
||
| Industrial Machinery | 1 | $19B |
|
||
Price history
+1400.0% since first listed38 events — show timeline
- 2026-04-27 Pending — TMLS
- 2026-04-22 Relisted — TMLS
- 2026-04-17 Pending — TMLS
- 2026-03-28 Price Changed $225,000 TMLS
- 2025-12-04 Listed $245,000 TMLS
- 2022-04-22 Sold (MLS) $125,000 TMLS
- 2022-03-07 Pending — TMLS
- 2022-03-02 Listed $139,900 TMLS
- 2021-09-28 Listing Removed — TMLS
- 2021-09-09 Price Changed $139,900 TMLS
- 2021-08-29 Price Changed $149,900 TMLS
- 2021-08-16 Listed $155,900 TMLS
- 2019-05-10 Sold (Public Records) $135,000 Public Records
- 2019-05-10 Sold (MLS) $135,000 TMLS
- 2019-05-10 Sold (MLS) $135,000 Hive MLS
- 2019-04-13 Pending — TMLS
- 2019-03-22 Contingent — TMLS
- 2019-03-20 Listed $129,900 Hive MLS
- 2019-03-19 Listed $129,900 TMLS
- 2016-07-06 Sold (MLS) $71,900 TMLS
- 2016-05-11 Contingent — TMLS
- 2016-03-24 Listed $74,700 TMLS
- 2013-09-30 Sold (Public Records) $69,000 Public Records
- 2013-09-27 Sold (MLS) $69,000 TMLS
- 2013-07-15 Contingent — TMLS
- 2013-06-27 Listed $69,000 TMLS
- 2009-05-14 Sold (MLS) $23,000 AMLSNC
- 2009-05-14 Sold (MLS) $23,000 TMLS
- 2009-04-18 Listing Removed — TMLS
- 2009-04-09 Sold (Public Records) $23,000 Public Records
- 2008-09-11 Listed $27,000 AMLSNC
- 2008-09-11 Listed $27,000 TMLS
- 2007-05-30 Sold (MLS) $28,000 AMLSNC
- 2007-05-30 Sold (MLS) $28,000 TMLS
- 2007-04-10 Listed $29,900 AMLSNC
- 2007-04-10 Listed $29,900 TMLS
- 1999-12-01 Sold (Public Records) $29,000 Public Records
- 1999-10-01 Sold (Public Records) $15,000 Public Records
Property tax history
+13.4%/yrLatest (2025): $1,746 · +73.9% YoY. Source: county tax records.
Cash-flow waterfall
monthlySold comps — $/sqft
last 12 mo · ≤1 miLoading sold comps…