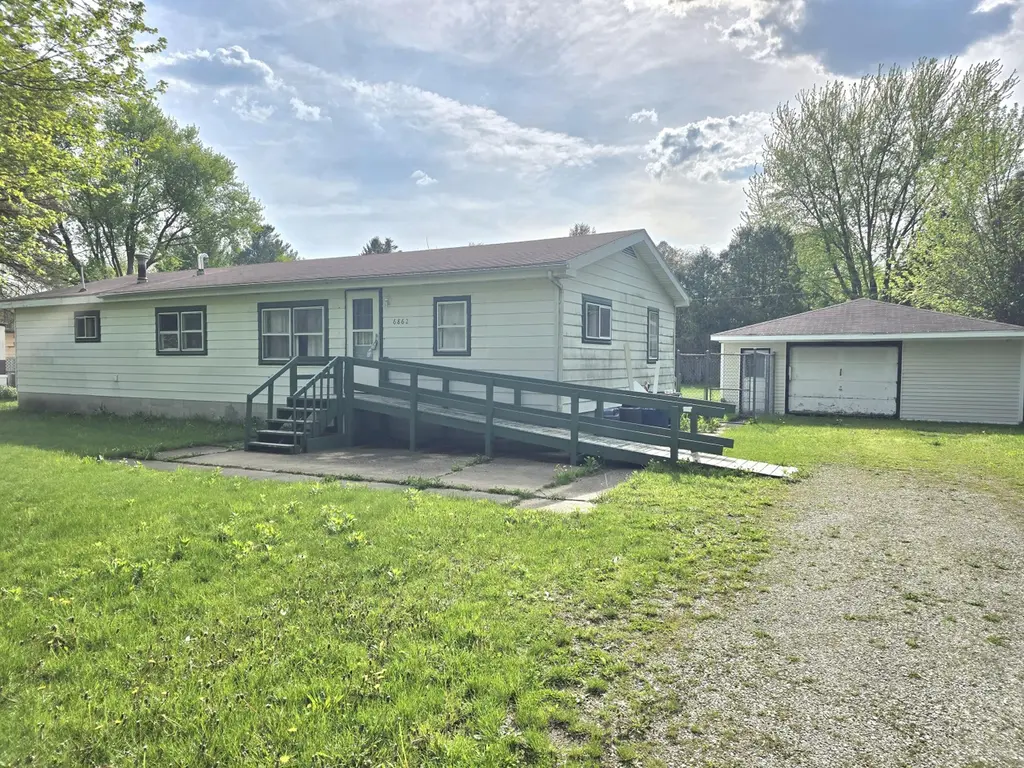
6862 NE Suburban Dr · Michigan City, IN
Flood risk 1/10 · Minimal
- FEMA flood zone
- X (unshaded)
- Chance of flooding over 30 yrs
- 0.0%
- Est. flood insurance / yr
- $507 – $1,088
Fire risk 3/10 · Minor
- Est. fire insurance / yr
- $717 – $1,331
Heat risk 2/10 · Minimal
- Hot days now (above 100°F)
- 7 days/yr
- Hot days in 30 yrs
- 15 days/yr
Wind risk 2/10 · Minimal
- Chance of severe wind over 30 yrs
- —
Air-quality risk 3/10 · Minor
- Unhealthy air days now
- 2 days/yr
- Unhealthy air days in 30 yrs
- 3 days/yr
Risk factors via First Street. Map © Google.
Why this score? — see what drove the B grade
The composite is a weighted blend of 9 inputs, each scored 0–100. Each bar is that input's sub-score; the figure is the points it added to the 100-point composite (weight × sub-score).
- Cash flow +30.0/30.0
- DSCR +10.0/10.0
- 1% rule +9.1/10.0
- ARV discount +7.5/15.0
- Rent growth +4.9/5.0
- Livability +4.0/5.0
- Condition / age +2.5/5.0
- Schools +2.2/10.0
- Appreciation +0.0/10.0
$104,000
🖨 Deal sheet 📄 Offer letter ✓ Due diligence
Listing remarks MLS
Cash buyers only! Spacious 3 bedroom, 1 bath manufactured home. Over sized garage with large fenced in yard in back of home. Nice size rooms, Home has a spacious bathroom. Additional bathroom was converted to a laundry room but could be changed back to a 2nd bathroom. Minor fixer upper.
Key facts
- 0.42 acre lot
- Garage
- Built 1983
Neighborhood map
What this means for you Summary
Snapshot
- This is a 3-bed/2.0-bath manufactured listed at $104k.
Deal economics
- At list price, monthly cash flow is $501 ($6k/yr) — positive.
- The deal already cash-flows at list — no discount required.
- Meets the 1% rule at list price ($1k rent vs $104k).
- Recommended offer: $102k (1.5% below list) — sets the bar for market timing.
- Cap rate 12.1% vs local median 2.7% in Michigan City — top-decile yield for the area; either an underpriced asset or a hidden risk that comps aren't pricing in. Stress-test before assuming the spread holds.
Location & tenants
- Location reads 81/100 on livability (#15 in IN, #1,317 nationally) — a professional / high-income tenant draw. Strengths: commute A+, cost of living A+, housing A+; Watch: employment D, schools D-, amenities D-.
- Michigan City Area Schools (urban): math 23% / reading 28% proficiency, ranked #262 of 301 in IN (top 87%) — low school quality limits family demand, transient renter base, plan for 1-2y turnover; 68% free/reduced lunch — lower-income household profile, screen leases tightly.
- Market conditions: Rents rising fast (+9.7%/yr); 371 active listings in the ZIP; 216 units permitted in LaPorte County in 2024 (75 in 5+ unit buildings).
Forward outlook
- Local home prices are declining (-3.0%/yr); year-one equity from $719 of loan paydown is wiped out by about $3k of value loss. Plan a longer hold.
- LaPorte County population projected to shrink 7% by 2050 — rents likely to lag national; underwrite the cash flow, not the appreciation.
- At projected returns (-3.0% appreciation + 8.0% rent growth), your $29k cash investment doubles in ~5 years — after that, you're playing with house money.
Negotiation context
- It's been on market 18 days — a 2% lower offer ($102k) is reasonable based on typical stale-listing flexibility.
- 3 sale attempts since 20y ago; this cycle's ask is 5% above the opening price — seller raised mid-cycle; expect resistance to lowballs.
Questions for the listing agent
- Is there a deadline driving the sale (1031 exchange, divorce, estate, relocation)? That informs how much negotiation room exists.
- Schools are D-rated, which usually means shorter tenancies and higher turnover. Who's the typical renter profile here, and what's been the actual vacancy rate?
- What's the average days-on-market for RENTAL listings here right now (not sales)? A rising rental-DOM trend means longer vacancies and softer asking-rent achievability than the comps imply.
- What's the recent tenant-quality profile in this submarket — average credit score on applications, eviction rate, late-payment / NSF rate, and stable-employment percentage? A property-management company in the area should have these aggregated.
- How much new for-sale + rental construction is in the pipeline within 1–3 miles? Heavy new supply typically softens prices + rents 12–24 months out; constrained supply supports both.
Investment metrics
- 1% rule
- 1.41% ✓
- Cap rate
- 12.07%
- Cash-on-cash
- 20.64%
- DSCR
- 1.92
- GRM
- 5.9
CMA / ARV
- ARV (median comp)
- $34,736
- List price
- $104,000
- Delta
- 216.67%
- Verdict
- OVERPRICED
- Comps
- 3 within 1.0 mi
Projected returns pro-forma
-3.0% appreciation · 8.0% rent growth · sell at horizon
- IRR
- 18.2%
- Equity multiple
- 1.78×
- Total profit
- $22,770
- Equity at exit
- $15,507
- IRR
- 29.8%
- Equity multiple
- 4.30×
- Total profit
- $96,077
- Equity at exit
- $8,992
Cash invested: $29,120 (down + closing). Projections, not guarantees.
Landlord ↔ Tenant lean methodology
- Overall (STATE)
- 90 Strongly Landlord-Friendly
- State Indiana
- 90 Strongly Landlord-Friendly · R+11
- County
- — inherits STATE
- City
- — inherits STATE
ZIP-level market 46360
- Rents YoY
- 9.7%
- Active inventory
- 371
- Price-to-rent
- 5.9×
Monthly cashflow live
- Estimated rent
- $1,465 medium interval (Pro) →
- Mortgage (P&I)
- −$545
- Tax from tax record
- −$68 /mo · $816/yr
- Insurance
- −$43
- HOA
- −$0
- Vacancy / Maint / Mgmt
- −$308
- Net cashflow
- $501
Break-even live
UW: 25.0% down · 7.5% · 30yr · 1.5% tax · 5.0% vac · 8.0% maint · 8.0% mgmt
Financing live
Cash to close
- Down payment
- $26,000
- Closing costs
- $3,120
- Reserves months
- —
- Total cash needed
- —
Loan-product check · same deal, 3 products live
Conventional
25% down · 7.5% · 30yr
- Down + closing
- —
- Monthly P&I
- —
- Monthly cashflow
- —
- DSCR
- —
- Eligible?
- —
Personal DTI + credit; lowest rate.
DSCR
20% down · 8.5% · 30yr
- Down + closing
- —
- Monthly P&I
- —
- Monthly cashflow
- —
- DSCR
- —
- Eligible?
- —
No personal income docs; deal must DSCR.
Hard money
10% down · 12.0% · 12mo
- Down + closing
- —
- Monthly P&I
- —
- Monthly cashflow
- —
- DSCR
- —
- Eligible?
- —
Short-term bridge; refi at stabilization.
Listing history 22 events
-
2026-06-19days on market $104,000 Active 18 DOM
-
2026-06-18days on market $104,000 Active 17 DOM
-
2026-06-17days on market $104,000 Active 16 DOM
-
2026-06-16days on market $104,000 Active 15 DOM
-
2026-06-15days on market $104,000 Active 14 DOM
-
2026-06-14days on market $104,000 Active 12 DOM
-
2026-06-13days on market $104,000 Active 11 DOM
-
2026-06-10days on market $104,000 Active 9 DOM
-
2026-06-09days on market $104,000 Active 8 DOM
-
2026-06-08days on market $104,000 Active 7 DOM
-
2026-06-07days on market $104,000 Active 6 DOM
-
2026-06-03days on market $104,000 Active 2 DOM
-
2026-06-03price $104,000 Active 1 DOM
-
2026-06-02days on market $110,000 Active 1 DOM
-
2026-05-31days on market $110,000 Active 54 DOM
-
2026-05-30days on market $110,000 Active 53 DOM
-
2026-04-21price $110,000 288-char remark
Show marketing remark (288 chars)
Cash buyers only! Spacious 3 bedroom, 1 bath manufactured home. Over sized garage with large fenced in yard in back of home. Nice size rooms, Home has a spacious bathroom. Additional bathroom was converted to a laundry room but could be changed back to a 2nd bathroom. Minor fixer upper.
-
2026-04-16status Active 288-char remark
Show marketing remark (288 chars)
Cash buyers only! Spacious 3 bedroom, 1 bath manufactured home. Over sized garage with large fenced in yard in back of home. Nice size rooms, Home has a spacious bathroom. Additional bathroom was converted to a laundry room but could be changed back to a 2nd bathroom. Minor fixer upper.
-
2025-11-19status Pending 288-char remark
Show marketing remark (288 chars)
Cash buyers only! Spacious 3 bedroom, 1 bath manufactured home. Over sized garage with large fenced in yard in back of home. Nice size rooms, Home has a spacious bathroom. Additional bathroom was converted to a laundry room but could be changed back to a 2nd bathroom. Minor fixer upper.
-
2025-11-10$99,000 Active 288-char remark
Show marketing remark (288 chars)
Cash buyers only! Spacious 3 bedroom, 1 bath manufactured home. Over sized garage with large fenced in yard in back of home. Nice size rooms, Home has a spacious bathroom. Additional bathroom was converted to a laundry room but could be changed back to a 2nd bathroom. Minor fixer upper.
-
2006-07-22historical
-
2006-01-21$49,900
ⓘ Source: listings_history table (triggers on properties + properties_extension) + one-shot
backfill from property_details.listing_events for pre-trigger history.
Tax reassessment forecast IN · Partial reset (capped growth)
- Current annual tax
- $816 · $68/mo
- Projected year-2 tax
- $850 · $71/mo
- Expected delta
- +$34/yr (+$3/mo · 4.1%)
ⓘ Screening estimate from a state-policy table — verify with the county assessor before closing.
Climate risk First Street
- Flood 1/10 Low FEMA zone X (unshaded) · 0% chance over 30 yrs
- Wildfire 3/10 Moderate
- Heat 2/10 Low 7 d/yr ≥100°F today · 15 d/yr by 30 yrs out
- Wind 2/10 Low
- Air quality 3/10 Moderate 2 unhealthy d/yr today · 3 by 30 yrs out
Nearby sold comps map
Loading sold comps map…
Walkable amenities ~0.75 mi
Loading nearby amenities…
Taxation est. · year 1
- Rental income
- $17,583
- − Mortgage interest
- −$5,826
- − Property taxes
- −$816
- − Insurance
- −$520
- − Repairs & maintenance
- −$1,407
- − Management
- −$1,407
- − Depreciation
- −$3,025
- Taxable income
- $4,582
- Est. tax owed @ 24.0%
- −$1,100
- After-tax cash flow
- $4,910/yr
For passive investors: Depreciation is non-cash, so a rental often shows a tax loss while cash-flowing — sheltering income. Rental losses are passive: they offset passive income freely, and up to $25,000/yr can offset ordinary (W-2) income if you actively participate and your MAGI is under $100k (phasing out to $0 by $150k); unused losses carry forward. On sale, claimed depreciation is recaptured at up to 25%, and gains may owe capital-gains tax (a 1031 exchange can defer both). Figures are a year-1 estimate at your 24.0% rate — not tax advice; consult a CPA.
Schools (NCES district)
- District
- Michigan City Area Schools
- NCES district ID
- 1806570
- Math proficiency
- 23% ▼ -16.00%
- Reading proficiency
- 28% ▼ -10.00%
- Median HH income
- $42,629
- Composite
- 21.76/100
- National rank
- #8257
- State rank
- #262 of 301 in IN
Livability — Michigan City
- Score
- 81/100
- State rank
- #15
- US rank
- #1317
Category grades
Schools grade is shown separately in the Schools card above.
Census & demographics
- County
- La Porte County · 88,580 people
- City population
- 43,817
- Metro
- Michigan City-La Porte, IN
- Population (ZIP)
- 43,817
- Household income
- $59,266
- Rent vs Own
- Severe rent burden
- 1152.0
Population outlook (LaPorte County) Hauer SSP2
- Today (2025)
- 109,757 people
- By 2030
- 108,288 · -1.3%
- By 2040
- 105,070 · -4.3%
- By 2050
- 102,330 · -6.8%
- By 2075
- 97,009 · -11.6%
- By 2100
- 86,459 · -21.2%
Race, ethnicity, and origin ACS 2023
- Neighborhood character
- Predominantly White (67%)
- Race & ethnicity
- White 67% Black 20% Hispanic / Latino 8% Two or more races 7%
- Hispanic origin (detail)
- Mexican 5%
- Common ancestry
- Romanian 11% Lithuanian 2% Iranian 1%
- Foreign-born
- 3% · Canada
- Languages at home
- 95% English-only · Spanish 3%
Political lean MEDSL · LaPorte
- 2024 margin
- R (+14.1) · D 42.1% · R 56.2% · Other 1.7%
- 2008→2024 swing
- -19.1pp toward R · 2008: 5.0pp · 2024: -14.1pp
- All cycles
- 2024: R+14.1 2020: R+7.2 2016: R+6.4 2012: D+12.6 2008: D+5.0
Not yet ingested
- Civics
- —
Market trends
- HPI YoY
- ▼ -210.27%
- Current HPI
- 206.0882
- Rent YoY
- ▲ 9.72%
- Metro
- Michigan City-La Porte, IN
- State GDP YoY
- ▲ 2.90%
- F500 in state
- 18
Industry mix (Fortune 500 HQ in IN)
| Industry | F500 HQs | Revenue |
|---|---|---|
| Industrial Machinery | 2 | $37B |
|
||
| Healthcare | 1 | $177B |
|
||
| Pharmaceuticals | 1 | $45B |
|
||
| Metals / Steel | 1 | $18B |
|
||
| Agriculture | 1 | $17B |
|
||
| Packaging | 1 | $12B |
|
||
Price history
+120.4% since first listed6 events — show timeline
- 2026-04-21 Price Changed $110,000 NIRA MLS as Distributed by MLS Grid
- 2026-04-16 Relisted — NIRA MLS as Distributed by MLS Grid
- 2025-11-19 Pending — NIRA MLS as Distributed by MLS Grid
- 2025-11-10 Listed $99,000 NIRA MLS as Distributed by MLS Grid
- 2006-07-22 Listing Removed — NIRA MLS as Distributed by MLS Grid
- 2006-01-21 Listed $49,900 NIRA MLS as Distributed by MLS Grid
Property tax history
+12.8%/yrLatest (2024): $816 · -2.9% YoY. Source: county tax records.
Cash-flow waterfall
monthlySold comps — $/sqft
last 12 mo · ≤1 miLoading sold comps…