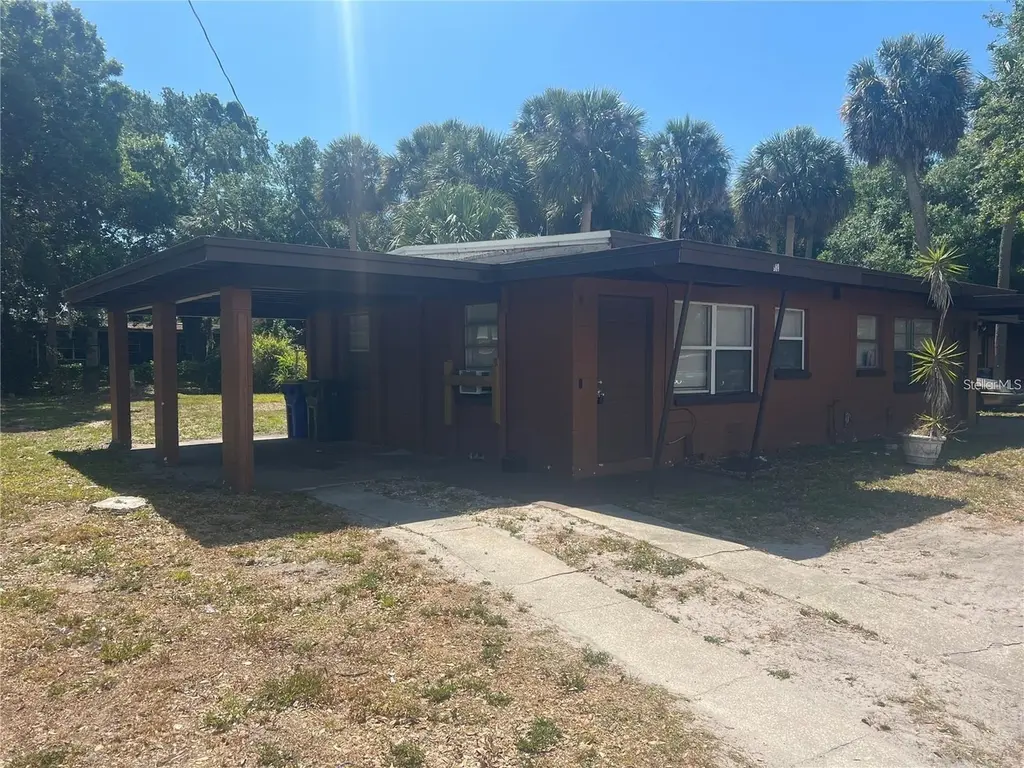
 Duplex
989 & 991 S Fiske Blvd · Rockledge, FL
Flood risk 1/10 · Minimal
- FEMA flood zone
- X (unshaded)
- Chance of flooding over 30 yrs
- 0.0%
- Est. flood insurance / yr
- $507 – $1,088
Fire risk 4/10 · Minor
- Est. fire insurance / yr
- $947 – $1,759
Heat risk 9/10 · Severe
- Hot days now (above 106°F)
- 6 days/yr
- Hot days in 30 yrs
- 19 days/yr
Wind risk 10/10 · Severe
- Chance of severe wind over 30 yrs
- 99.0%
Air-quality risk 1/10 · Minimal
- Unhealthy air days now
- 0 days/yr
- Unhealthy air days in 30 yrs
- 0 days/yr
Risk factors via First Street. Map © Google.
Why this score? — see what drove the B grade
The composite is a weighted blend of 9 inputs, each scored 0–100. Each bar is that input's sub-score; the figure is the points it added to the 100-point composite (weight × sub-score).
- Cash flow +30.0/30.0
- 1% rule +10.0/10.0
- DSCR +10.0/10.0
- ARV discount +7.5/15.0
- Schools +4.7/10.0
- Livability +4.0/5.0
- Rent growth +2.5/5.0
- Condition / age +2.5/5.0
- Appreciation +0.0/10.0
$214,000
🖨 Deal sheet (PDF) 📄 Offer letter ✓ Due diligence
Multi-family units
County records classify this as Multi-Family (2-4 Unit). Listing-text estimate: 2 units. confirmed
Listing remarks MLS
One of Three duplexes for sale located on Fiske Blvd. Good Cash flow, 10+% CAP per owner stated income/expenses. Units are 2 bedrooms. The 2 other duplexes are contiguous at addresses 985 and 993. Please have buyer review the attached APOD before setting up a showing. Need 24 hour notice and proof of funds or qualification to show.
Key facts
- Spacious backyard
- Oversized lot
- Steady rental income
Tags
Property features AI
Finance
- Other: Property type: Residential Income; Property sub type: Duplex; Zoning: RES; Total acreage: less than 1/4 acre (approx. 0.22 acres)
- Financial info: Annual net income reported: $22,000; Pro forma income for unit type: $2,200; Listed unit rent noted as $1,100 per unit
- HOA & community: No HOA indicated; Pets are allowed
Exterior
- Parking: Has a 1-space carport
- Utilities: Public water; Public sewer; Electricity connected; Water connected
- Home design: Duplex (residential income property); One story
- Construction: Stucco exterior; Built-up roof; Slab foundation; Two total buildings on the parcel
- Exterior features: Asphalt road access; No waterfront or water access
Interior
- Kitchen: Range; Refrigerator
- Bedrooms: Two total bedrooms; Each unit is a 1-bedroom (both units occupied)
- Bathrooms: Each unit has 1 bathroom
- Heating & cooling: Ductless heating; Wall or window cooling units
- Interior features: Range, Refrigerator
- Laundry & utility: No laundry features (none listed)
Neighborhood map
What this means for you Summary
Snapshot
- This is a 2 × 2-bed/2.0-bath units multifamily listed at $214k.
Deal economics
- At list price, monthly cash flow is $1k ($18k/yr) — positive. Per door: $735/mo.
- The deal already cash-flows at list — no discount required.
- Meets the 1% rule at list price ($4k rent vs $214k).
- Recommended offer: $211k (1.5% below list) — sets the bar for market timing.
Location & tenants
- Location reads 81/100 on livability (#81 in FL, #1,315 nationally) — a professional / high-income tenant draw. Strengths: housing A+, health & safety A, commute A-; Watch: amenities F.
- Brevard (suburban): math 53% / reading 57% proficiency, ranked #19 of 73 in FL (top 26%) — acceptable for families but not a draw, mixed tenant base, ~2y average lease.
- Zoned schools: Endeavour Elementary School (math 15% / reading 20%, grade F, #2,117 of 2,144 statewide, top 99%, 717 students, 72% FRL); Ronald Mcnair Magnet Middle School (math 58% / reading 50%, grade B-, #196 of 571 statewide, top 36%, 364 students, 58% FRL); Rockledge Senior High School (math 27% / reading 49%, grade F, #328 of 667 statewide, top 50%, 1,558 students, 50% FRL) — zoned schools average 60% FRL vs 43% district-wide (17 pts higher); higher-poverty schools than district average — tighter screening recommended.
- Zoned-school proficiency averages 36% at this address vs 55% district-wide (-18 pts) — the specific schools serving this property underperform the Brevard average; the district grade overstates school quality for this exact location.
- Market conditions: Rents flat; 321 active listings in the ZIP; 9 comparable units currently listed for rent nearby; rentals at typical pace (median 26d on market — plan ~3-4 weeks tenant-placement turnaround); solid renter incomes; 4,602 units permitted in Brevard County in 2024 (702 in 5+ unit buildings).
Forward outlook
- Local home prices are declining (-3.0%/yr); year-one equity from $1k of loan paydown is wiped out by about $6k of value loss. Plan a longer hold.
- Brevard County population projected at +15% by 2050 — modest demand growth; plan on rents tracking national, not racing it.
- At projected returns (-3.0% appreciation + 0.1% rent growth), your $60k cash investment doubles in ~5 years — after that, you're playing with house money.
Negotiation context
- It's been on market 19 days — a 2% lower offer ($211k) is reasonable based on typical stale-listing flexibility.
- 5 sale attempts since 11y ago with the ask held roughly flat each time — persistent listings suggest the price (not the market) is what's stuck; bring a comps-based counter.
- Current owner paid $100k; list at $214k implies a 114% gain — meaningful room to come down on a strong offer.
Risks & watch-outs
- Watch-outs: built in 1957 — expect roof / HVAC / electrical / plumbing capex.
- Climate carrying-cost: severe wind risk, 99% chance of damaging wind over 30y; extreme-heat days projected 6→19/yr by 2055 (HVAC capex compounding) — expect insurance premiums to compound above CPI over the hold.
Questions for the listing agent
- Can we see the unit-by-unit rent roll, current vacancy, and any below-market leases? What's the average tenancy length?
- What capital expenditures (roof, boiler, parking lot, exteriors) have been made in the last 5 years, and what's planned in the next 2?
- Built in 1957 — when were the roof, HVAC, electrical panel, plumbing, and water heater last replaced?
- Is there a deadline driving the sale (1031 exchange, divorce, estate, relocation)? That informs how much negotiation room exists.
- Schools are B-rated — typically a magnet for longer-tenancy family renters. What's the average tenant stay here, and is there a school-zone premium baked into asking?
- What's the average days-on-market for RENTAL listings here right now (not sales)? A rising rental-DOM trend means longer vacancies and softer asking-rent achievability than the comps imply.
- What's the recent tenant-quality profile in this submarket — average credit score on applications, eviction rate, late-payment / NSF rate, and stable-employment percentage? A property-management company in the area should have these aggregated.
- How much new apartment / multifamily construction is in the pipeline within 1–3 miles? Heavy new supply (>2% of stock underway) typically softens rents 12–24 months out; light construction supports rent growth.
Investment metrics
- 1% rule
- 1.69% ✓
- Cap rate
- 14.53%
- Cash-on-cash
- 29.43%
- DSCR
- 2.31
- GRM
- 4.9
CMA / ARV
No comps found within radius.
Projected returns pro-forma
-3.0% appreciation · 0.12% rent growth · sell at horizon
- IRR
- 20.7%
- Equity multiple
- 1.81×
- Total profit
- $48,715
- Equity at exit
- $31,908
- IRR
- 26.9%
- Equity multiple
- 3.06×
- Total profit
- $123,433
- Equity at exit
- $18,503
Cash invested: $59,920 (down + closing). Projections, not guarantees.
Landlord ↔ Tenant lean methodology
- Overall (STATE)
- 87 Strongly Landlord-Friendly
- State Florida
- 87 Strongly Landlord-Friendly · R+3
- County
- — inherits STATE
- City
- — inherits STATE
ZIP-level market 32955
- Home prices YoY
- -20.7%
- Rents YoY
- 0.1%
- Active inventory
- 321
- Price-to-rent
- 9.9×
Monthly cashflow live
- Estimated rent
- $3,620 medium interval (Pro) →
- Mortgage (P&I)
- −$1,122
- Tax from tax record
- −$179 /mo · $2,148/yr
- Insurance
- −$89
- HOA
- −$0
- Vacancy / Maint / Mgmt
- −$760
- Net cashflow
- $1,469
Break-even live
Sensitivity live
| Price | -10% $1,591 | -5% $1,530 | +0% $1,469 | +5% $1,409 | +10% $1,348 |
|---|---|---|---|---|---|
| Rent | -10% $1,183 | -5% $1,326 | +0% $1,469 | +5% $1,612 | +10% $1,755 |
| Rate | -1.0pp $1,577 | -0.5pp $1,524 | base $1,469 | +0.5pp $1,414 | +1.0pp $1,358 |
2-unit breakdown (identical units grouped — click to expand)
| Units | Beds | Baths | Est. rent |
|---|---|---|---|
| 2× units | 2 | 2 | $3,620 |
| #1 | 2 | 2 | $1,810 |
| #2 | 2 | 2 | $1,810 |
| Total (2 units) | $3,620 | ||
UW: 25.0% down · 7.5% · 30yr · 1.5% tax · 5.0% vac · 8.0% maint · 8.0% mgmt
Financing live
Cash to close
- Down payment
- $53,500
- Closing costs
- $6,420
- Reserves months
- —
- Total cash needed
- —
Loan-product check · same deal, 3 products live
Conventional
25% down · 7.5% · 30yr
- Down + closing
- —
- Monthly P&I
- —
- Monthly cashflow
- —
- DSCR
- —
- Eligible?
- —
Personal DTI + credit; lowest rate.
DSCR
20% down · 8.5% · 30yr
- Down + closing
- —
- Monthly P&I
- —
- Monthly cashflow
- —
- DSCR
- —
- Eligible?
- —
No personal income docs; deal must DSCR.
Hard money
10% down · 12.0% · 12mo
- Down + closing
- —
- Monthly P&I
- —
- Monthly cashflow
- —
- DSCR
- —
- Eligible?
- —
Short-term bridge; refi at stabilization.
Rent comps 9 comps
| Address | Beds | Baths | Sqft | Rent | $/sqft | DOM | Units | Dist |
|---|---|---|---|---|---|---|---|---|
| 1105 Santa Rosa Dr Rockledge, FL | 3.0 | 2.0 | 1096 | $2,000 | $1.82 | 25d | 1 | 0.04mi |
| 616 S Kentucky Ave Cocoa, FL | 3.0 | 1.0 | 960 | $1,600 | $1.67 | 21d | 1 | 0.32mi |
| 801 Washington St Unit A Cocoa, FL | 3.0 | 1.5 | 1000 | $1,760 | $1.76 | 25d | 1 | 0.52mi |
| 295 Royal Tern CIR Rockledge, FL | 1.0–3.0 | 1.0–2.0 | 1020 | $2,467 | $2.42 | 16d | 33 | 0.84mi |
| 1515 Peachtree St Cocoa, FL | 3.0 | 2.0 | 1056 | $1,475 | $1.40 | 25d | 1 | 1.00mi |
| 27 Seminole Dr Rockledge, FL | 3.0 | 1.0 | 714 | $1,750 | $2.45 | 25d | 1 | 1.34mi |
| 256 Barton Blvd Rockledge, FL | 3.0 | 1.0–2.0 | 1012 | $2,115 | $2.09 | 16d | 23 | 1.38mi |
| 1616 Terrace St Cocoa, FL | 3.0 | 2.0 | 850 | $1,600 | $1.88 | 25d | 1 | 1.44mi |
| 412 Clarence Rowe Ave Rockledge, FL | 3.0 | 1.0 | 960 | $1,600 | $1.67 | 25d | 1 | 1.46mi |
Listing history 14 events
-
2026-05-13status Pending
-
2026-04-24$214,000 Active
-
2026-02-16status Pending
-
2026-02-15historical
-
2026-02-11$214,000 Active
-
2025-07-24historical $1,100
-
2025-06-18$1,100
-
2024-05-30historical $1,100
-
2024-04-23$1,100
-
2017-11-07historical 333-char remark
Show marketing remark (333 chars)
One of Three duplexes for sale located on Fiske Blvd. Good Cash flow, 10+% CAP per owner stated income/expenses. Units are 2 bedrooms. The 2 other duplexes are contiguous at addresses 985 and 993. Please have buyer review the attached APOD before setting up a showing. Need 24 hour notice and proof of funds or qualification to show.
-
2015-02-17$73,900 333-char remark
Show marketing remark (333 chars)
One of Three duplexes for sale located on Fiske Blvd. Good Cash flow, 10+% CAP per owner stated income/expenses. Units are 2 bedrooms. The 2 other duplexes are contiguous at addresses 985 and 993. Please have buyer review the attached APOD before setting up a showing. Need 24 hour notice and proof of funds or qualification to show.
-
2003-12-16soldstatus $100,000
-
1995-10-03soldstatus $18,000
-
1982-02-01soldstatus $65,500
ⓘ Source: listings_history table (triggers on properties + properties_extension) + one-shot
backfill from property_details.listing_events for pre-trigger history.
Tax reassessment forecast FL · Resets to sale price
- Current annual tax
- $2,148 · $179/mo
- Projected year-2 tax
- $2,148 · $179/mo
- Expected delta
- $0/yr ($0/mo · 0.0%)
ⓘ Screening estimate from a state-policy table — verify with the county assessor before closing.
Climate risk First Street
- Flood 1/10 Low FEMA zone X (unshaded) · 0% chance over 30 yrs
- Wildfire 4/10 Moderate
- Heat 9/10 Extreme 6 d/yr ≥106°F today · 19 d/yr by 30 yrs out
- Wind 10/10 Extreme 99% chance of damaging wind over 30 yrs
- Air quality 1/10 Low 0 unhealthy d/yr today · 0 by 30 yrs out
Nearby sold comps map
Loading sold comps map…
Walkable amenities ~0.75 mi
Loading nearby amenities…
Taxation est. · year 1
- Rental income
- $43,440
- − Mortgage interest
- −$11,987
- − Property taxes
- −$2,148
- − Insurance
- −$1,070
- − Repairs & maintenance
- −$3,475
- − Management
- −$3,475
- − Depreciation
- −$6,225
- Taxable income
- $15,059
- Est. tax owed @ 24.0%
- −$3,614
- After-tax cash flow
- $14,019/yr
For passive investors: Depreciation is non-cash, so a rental often shows a tax loss while cash-flowing — sheltering income. Rental losses are passive: they offset passive income freely, and up to $25,000/yr can offset ordinary (W-2) income if you actively participate and your MAGI is under $100k (phasing out to $0 by $150k); unused losses carry forward. On sale, claimed depreciation is recaptured at up to 25%, and gains may owe capital-gains tax (a 1031 exchange can defer both). Figures are a year-1 estimate at your 24.0% rate — not tax advice; consult a CPA.
Schools (NCES district)
- District
- Brevard
- NCES district ID
- 1200150
- Math proficiency
- 53% ▼ -9.00%
- Reading proficiency
- 57% ▼ -4.00%
- Median HH income
- $49,426
- Composite
- 46.86/100
- National rank
- #2370
- State rank
- #19 of 73 in FL
Livability — Rockledge
- Score
- 81/100
- State rank
- #81
- US rank
- #1315
Category grades
Schools grade is shown separately in the Schools card above.
Census & demographics
- Census place
- Rockledge, FL
- County
- Brevard County · 602,871 people
- City population
- 41,008
- Metro
- Palm Bay-Melbourne-Titusville, FL
- Population (ZIP)
- 41,008
- Household income
- $86,457
- Rent vs Own
- Severe rent burden
- 1273.0
Population outlook (Brevard County) Hauer SSP2
- Today (2025)
- 623,254 people
- By 2030
- 648,420 · +4.0%
- By 2040
- 690,009 · +10.7%
- By 2050
- 715,669 · +14.8%
- By 2075
- 775,744 · +24.5%
- By 2100
- 776,687 · +24.6%
Race, ethnicity, and origin ACS 2023
- Neighborhood character
- Predominantly White (69%)
- Race & ethnicity
- White 69% Black 14% Hispanic / Latino 9% Two or more races 8% Asian 2%
- Hispanic origin (detail)
- Mexican 1% Puerto Rican 3%
- Common ancestry
- Slovak 3% Romanian 2% Serbian 2%
- Foreign-born
- 7% · Canada, Jamaica, Mexico
- Languages at home
- 91% English-only · Spanish 5% Other Indo-European 2%
Political lean MEDSL · Brevard
- 2024 margin
- Strong R (+20.8) · D 39.1% · R 59.9% · Other 1.0%
- 2008→2024 swing
- -10.4pp toward R · 2008: -10.4pp · 2024: -20.8pp
- All cycles
- 2024: R+20.8 2020: R+16.4 2016: R+19.8 2012: R+12.7 2008: R+10.4
Not yet ingested
- Civics
- —
Market trends
- HPI YoY
- ▼ -81.70%
- Current HPI
- 312.7435
- Rent YoY
- ▲ 0.12%
- Metro
- Palm Bay-Melbourne-Titusville, FL
- State GDP YoY
- ▲ 3.28%
- F500 in state
- 36
Industry mix (Fortune 500 HQ in FL)
| Industry | F500 HQs | Revenue |
|---|---|---|
| Industrial Technology | 2 | $29B |
|
||
| Insurance | 2 | $17B |
|
||
| Retail | 1 | $60B |
|
||
| Technology Distribution | 1 | $58B |
|
||
| Homebuilding | 1 | $35B |
|
||
| Technology Manufacturing | 1 | $35B |
|
||
Price history
+226.7% since first listed14 events — show timeline
- 2026-05-13 Pending — Stellar MLS as Distributed by MLS Grid
- 2026-04-24 Listed $214,000 Stellar MLS as Distributed by MLS Grid
- 2026-02-16 Pending — Stellar MLS as Distributed by MLS Grid
- 2026-02-15 Listing Removed — Stellar MLS as Distributed by MLS Grid
- 2026-02-11 Listed $214,000 Stellar MLS as Distributed by MLS Grid
- 2025-07-24 Rental Removed $1,100 STELLARMLS
- 2025-06-18 Listed for Rent $1,100 STELLARMLS
- 2024-05-30 Rental Removed $1,100 STELLARMLS
- 2024-04-23 Listed for Rent $1,100 STELLARMLS
- 2017-11-07 Listing Removed — SCMLS
- 2015-02-17 Listed $73,900 SCMLS
- 2003-12-16 Sold (Public Records) $100,000 Public Records
- 1995-10-03 Sold (Public Records) $18,000 Public Records
- 1982-02-01 Sold (Public Records) $65,500 Public Records
Property tax history
+10.4%/yrLatest (2025): $2,148 · +4.9% YoY. Source: county tax records.
Cash-flow waterfall
monthlySold comps — $/sqft
last 12 mo · ≤1 miLoading sold comps…