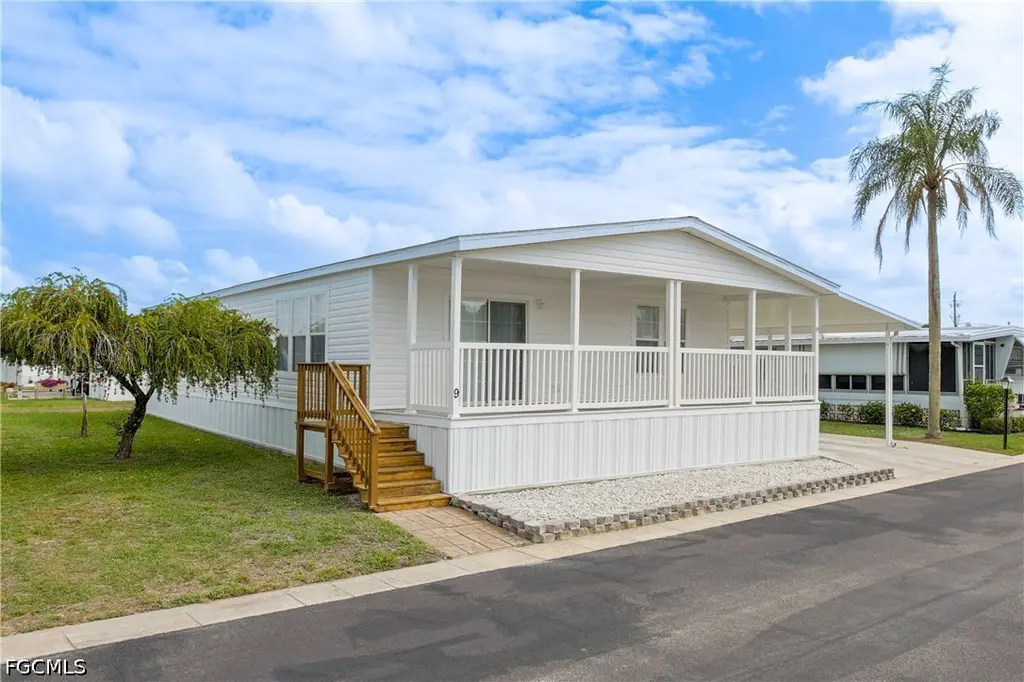
9 Dill St · Alva, FL
Flood risk 4/10 · Minor
- FEMA flood zone
- AE
- Chance of flooding over 30 yrs
- 0.24%
- Est. flood insurance / yr
- $1,737 – $8,500
Fire risk 6/10 · Moderate
- Est. fire insurance / yr
- $947 – $1,759
Heat risk 9/10 · Severe
- Hot days now (above 108°F)
- 7 days/yr
- Hot days in 30 yrs
- 26 days/yr
Wind risk 10/10 · Severe
- Chance of severe wind over 30 yrs
- 99.0%
Air-quality risk 2/10 · Minimal
- Unhealthy air days now
- 2 days/yr
- Unhealthy air days in 30 yrs
- 2 days/yr
Risk factors via First Street. Map © Google.
Why this score? — see what drove the C- grade
The composite is a weighted blend of 9 inputs, each scored 0–100. Each bar is that input's sub-score; the figure is the points it added to the 100-point composite (weight × sub-score).
- Cash flow +18.9/30.0
- ARV discount +7.5/15.0
- DSCR +5.9/10.0
- 1% rule +5.8/10.0
- Schools +4.1/10.0
- Livability +3.4/5.0
- Rent growth +2.5/5.0
- Condition / age +2.5/5.0
- Appreciation +0.0/10.0
$249,990
🖨 Deal sheet (PDF) 📄 Offer letter ✓ Due diligence
Listing remarks
Welcome to Oak Park Village—a highly desirable, resident-owned 55+ riverfront community tucked away in the heart of Alva along the peaceful Caloosahatchee River, offering convenient access to the Gulf. Ideal for those seeking a relaxed, boating lifestyle, this vibrant community features exceptional amenities and a welcoming atmosphere. Residents enjoy low monthly HOA fees that cover essential services including lawn care, water, sewer, and access to a community pool, fitness center, clubhouse, library, and boat launch. Oak Park Village strikes the perfect balance between tranquility and an active social lifestyle. If you're ready to embrace the beauty of riverfront living, this beauti
Key facts
- Fitness center
- Clubhouse
- Community pool
Tags
Property features AI
Finance
- Financial info: Pets allowed conditionally (call); maximum pet weight 25 lbs
- HOA & community: Homeowners association with monthly fee of $309; Association covers management, legal/accounting, grounds maintenance, reserve fund, sewer and water; Community amenities include clubhouse, fitness center, pool, marina, boat dock/boat ramp, pier, billiards, library, laundry, storage, RV/boat storage, bocce and shuffleboard courts, picnic/barbecue areas, trails, vehicle wash area, and on-site management; Senior community; 199 units in the community
Exterior
- Parking: Attached carport; Carport for 2 vehicles; Assigned parking; Covered parking (2 spaces); Driveway parking; Paved parking; RV access/parking; Golf cart garage
- Security: Smoke detector(s)
- Utilities: Public water (assessment paid); Public sewer; Cable available; High-speed internet available; Underground utilities
- Home design: Manufactured home; Single-story; Entry level: 1; Faces south
- Construction: Vinyl siding; Shingle roof; Manufactured construction
- Exterior features: Deck; Open porch; Porch; Storage; Community pool
Interior
- Kitchen: Dishwasher; Self-cleaning oven; Microwave; Refrigerator; Freezer
- Flooring: Laminate flooring
- Bathrooms: 2 full bathrooms
- Heating & cooling: Central heating (electric); Central air conditioning (electric); Ceiling fan(s)
- Interior features: Furnished; Breakfast bar; Kitchen island; Living/dining room; Pantry; Walk-in pantry; Bathtub; Separate shower; Dual sinks; Window coverings; Single-hung windows; Window treatments
- Laundry & utility: Washer; Dryer; Laundry in garage; Common area laundry
Neighborhood map
What this means for you Summary
Snapshot
- This is a 2-bed/2.0-bath condo listed at $250k.
Deal economics
- At list price, monthly cash flow is $-171 ($-2k/yr) — negative.
- To cash-flow at today's rent, offer at most $220k (12.1% below list).
- Meets the 1% rule at list price ($3k rent vs $250k).
- Recommended offer: $220k (12.1% below list) — sets the bar for cash-flow.
Location & tenants
- Location reads 68/100 on livability (#514 in FL) — a middle-class / working-renter tenant base. Strengths: crime A+, employment A+, housing A+; Watch: amenities F, commute F, health & safety D-.
- Lee (suburban): math 47% / reading 50% proficiency, ranked #42 of 73 in FL (top 58%) — families likely to look elsewhere, expect single-tenant / working-renter base with shorter leases.
- Zoned schools: Veterans Park Academy For The Arts (math 41% / reading 45%, grade F, #1,366 of 2,144 statewide, top 64%, 2,133 students, 36% FRL); Oak Hammock Middle School (math 43% / reading 41%, grade D-, #340 of 571 statewide, top 61%, 1,563 students, 56% FRL); Lehigh Senior High School (math 23% / reading 45%, grade F, #394 of 667 statewide, top 60%, 2,476 students, 57% FRL).
- Market conditions: 460 active listings in the ZIP; 2 comparable units currently listed for rent nearby; 15,411 units permitted in Lee County in 2024 (4,686 in 5+ unit buildings).
Forward outlook
- Local home prices are declining (-3.0%/yr); year-one equity from $2k of loan paydown is wiped out by about $8k of value loss. Plan a longer hold.
- Lee County population projected at +44% by 2050 — long-run rental-demand tailwind backs the buy-and-hold thesis.
Negotiation context
- It's been on market 75 days — a 6% lower offer ($235k) is reasonable based on typical stale-listing flexibility.
- 2 sale attempts with the ask held roughly flat each time — persistent listings suggest the price (not the market) is what's stuck; bring a comps-based counter.
Risks & watch-outs
- Watch-outs: flood insurance adds $427/mo.
- Climate carrying-cost: in FEMA flood zone AE (mandatory federal flood insurance); severe wind risk, 99% chance of damaging wind over 30y; major wildfire risk; extreme-heat days projected 7→26/yr by 2055 (HVAC capex compounding) — expect insurance premiums to compound above CPI over the hold.
Questions for the listing agent
- What do current leases actually rent for vs. the listed asking? Can we see a recent rent roll and the last 12 months of T-12 income?
- It's been on market 75 days. Have you received any prior offers? Is the seller open to a 12% concession, seller financing, or rate buy-down credit?
- What's the actual annual flood-insurance premium (NFIP or private), and is the property in a SFHA with mandatory coverage?
- What does the HOA fee cover, when was the last increase, and are there any pending special assessments or reserve-fund shortfalls?
- Any open or pending special assessments — roof, HVAC, plumbing, elevator, façade? What's the per-unit balance and payoff schedule, and is the seller paying it off at close or rolling it to the buyer?
- Why hasn't it sold? Are there any deal-killer items the seller is aware of (foundation, flood, title, zoning, code violations)?
- Is there a deadline driving the sale (1031 exchange, divorce, estate, relocation)? That informs how much negotiation room exists.
- What's the average days-on-market for RENTAL listings here right now (not sales)? A rising rental-DOM trend means longer vacancies and softer asking-rent achievability than the comps imply.
- What's the recent tenant-quality profile in this submarket — average credit score on applications, eviction rate, late-payment / NSF rate, and stable-employment percentage? A property-management company in the area should have these aggregated.
- How much new apartment / multifamily construction is in the pipeline within 1–3 miles? Heavy new supply (>2% of stock underway) typically softens rents 12–24 months out; light construction supports rent growth.
Investment metrics
- 1% rule
- 1.08% ✓
- Cap rate
- 7.52%
- Cash-on-cash
- 4.38%
- DSCR
- 1.19
- GRM
- 7.7
CMA / ARV
No comps found within radius.
Projected returns pro-forma
-3.0% appreciation · 3.0% rent growth · sell at horizon
- IRR
- -21.0%
- Equity multiple
- 0.27×
- Total profit
- $-51,005
- Equity at exit
- $37,274
- IRR
- -13.9%
- Equity multiple
- 0.19×
- Total profit
- $-56,834
- Equity at exit
- $21,615
Cash invested: $69,997 (down + closing). Projections, not guarantees.
Landlord ↔ Tenant lean methodology
- Overall (STATE)
- 87 Strongly Landlord-Friendly
- State Florida
- 87 Strongly Landlord-Friendly · R+3
- County
- — inherits STATE
- City
- — inherits STATE
ZIP-level market 33920
- Home prices YoY
- -11.8%
- Active inventory
- 460
- Price-to-rent
- 7.7×
Monthly cashflow live
- Estimated rent
- $2,700 medium interval (Pro) →
- Mortgage (P&I)
- −$1,311
- Tax from tax record
- −$153 /mo · $1,840/yr
- Insurance
- −$104
- Flood insurance flood zone
- −$427 /mo · $5,118/yr
- HOA
- −$309
- Vacancy / Maint / Mgmt
- −$567
- Net cashflow
- $-171
Break-even live
Sensitivity live
| Price | -10% $-29 | -5% $-100 | +0% $-171 | +5% $-242 | +10% $-313 |
|---|---|---|---|---|---|
| Rent | -10% $-384 | -5% $-278 | +0% $-171 | +5% $-64 | +10% $42 |
| Rate | -1.0pp $-45 | -0.5pp $-107 | base $-171 | +0.5pp $-236 | +1.0pp $-302 |
UW: 25.0% down · 7.5% · 30yr · 1.5% tax · 5.0% vac · 8.0% maint · 8.0% mgmt
Financing live
Cash to close
- Down payment
- $62,498
- Closing costs
- $7,500
- Reserves months
- —
- Total cash needed
- —
Loan-product check · same deal, 3 products live
Conventional
25% down · 7.5% · 30yr
- Down + closing
- —
- Monthly P&I
- —
- Monthly cashflow
- —
- DSCR
- —
- Eligible?
- —
Personal DTI + credit; lowest rate.
DSCR
20% down · 8.5% · 30yr
- Down + closing
- —
- Monthly P&I
- —
- Monthly cashflow
- —
- DSCR
- —
- Eligible?
- —
No personal income docs; deal must DSCR.
Hard money
10% down · 12.0% · 12mo
- Down + closing
- —
- Monthly P&I
- —
- Monthly cashflow
- —
- DSCR
- —
- Eligible?
- —
Short-term bridge; refi at stabilization.
Rent comps 2 comps
| Address | Beds | Baths | Sqft | Rent | $/sqft | DOM | Units | Dist |
|---|---|---|---|---|---|---|---|---|
| 2111 Waylife Ct Alva, FL | 3.0 | 2.0 | 1661 | $2,700 | $1.63 | 5d | 1 | 1.45mi |
| 2111 Waylife Ct Alva, FL | 3.0 | 2.0 | 1661 | $2,700 | $1.63 | 25d | 1 | 1.45mi |
HOA detail condo
- Monthly dues
- $309 · $3,708/yr
- Likely covers
- watersewerlandscapingpoolgym
- Assessments
- None detected in remarks — confirm with the listing agent.
Listing history 15 events
-
2026-06-22days on market $249,990 Active 75 DOM
-
2026-06-17days on market $249,990 Active 71 DOM
-
2026-06-16days on market $249,990 Active 70 DOM
-
2026-06-15days on market $249,990 Active 69 DOM
-
2026-06-13days on market $249,990 Active 67 DOM
-
2026-06-10days on market $249,990 Active 64 DOM
-
2026-06-09days on market $249,990 Active 63 DOM
-
2026-06-07days on market $249,990 Active 61 DOM
-
2026-06-03days on market $249,990 Active 57 DOM
-
2026-06-02days on market $249,990 Active 56 DOM
-
2026-06-01days on market $249,990 Active 55 DOM
-
2026-06-01days on market $249,990 Active 54 DOM
-
2026-04-07$249,990 Active
-
2025-12-09historical
-
2025-06-09$289,000 Active
ⓘ Source: listings_history table (triggers on properties + properties_extension) + one-shot
backfill from property_details.listing_events for pre-trigger history.
Tax reassessment forecast FL · Resets to sale price
- Current annual tax
- $1,840 · $153/mo
- Projected year-2 tax
- $2,075 · $173/mo
- Expected delta
- +$235/yr (+$20/mo · 12.8%)
ⓘ Screening estimate from a state-policy table — verify with the county assessor before closing.
Climate risk First Street
- Flood 4/10 Moderate FEMA zone AE · 24% chance over 30 yrs
- Wildfire 6/10 Major
- Heat 9/10 Extreme 7 d/yr ≥108°F today · 26 d/yr by 30 yrs out
- Wind 10/10 Extreme 99% chance of damaging wind over 30 yrs
- Air quality 2/10 Low 2 unhealthy d/yr today · 2 by 30 yrs out
Nearby sold comps map
Loading sold comps map…
Walkable amenities ~0.75 mi
Loading nearby amenities…
Taxation est. · year 1
- Rental income
- $32,400
- − Mortgage interest
- −$14,003
- − Property taxes
- −$1,840
- − Insurance
- −$6,368
- − Repairs & maintenance
- −$2,592
- − Management
- −$2,592
- − HOA
- −$3,708
- − Depreciation
- −$7,272
- Taxable loss
- −$5,976
- Est. tax savings @ 24.0%
- +$1,434
- After-tax cash flow
- $-618/yr
For passive investors: Depreciation is non-cash, so a rental often shows a tax loss while cash-flowing — sheltering income. Rental losses are passive: they offset passive income freely, and up to $25,000/yr can offset ordinary (W-2) income if you actively participate and your MAGI is under $100k (phasing out to $0 by $150k); unused losses carry forward. On sale, claimed depreciation is recaptured at up to 25%, and gains may owe capital-gains tax (a 1031 exchange can defer both). Figures are a year-1 estimate at your 24.0% rate — not tax advice; consult a CPA.
Schools (NCES district)
- District
- Lee
- NCES district ID
- 1201080
- Math proficiency
- 47% ▼ -11.00%
- Reading proficiency
- 50% ▼ -4.00%
- Median HH income
- $49,518
- Composite
- 41.49/100
- National rank
- #3458
- State rank
- #42 of 73 in FL
Livability — Alva
- Score
- 68/100
- State rank
- #514
- US rank
- #9471
Category grades
Schools grade is shown separately in the Schools card above.
Census & demographics
- Census place
- Alva, FL
- Population (ZIP)
- 7,689
Population outlook (Lee County) Hauer SSP2
- Today (2025)
- 871,946 people
- By 2030
- 955,468 · +9.6%
- By 2040
- 1,113,587 · +27.7%
- By 2050
- 1,256,891 · +44.1%
- By 2075
- 1,560,270 · +78.9%
- By 2100
- 1,726,848 · +98.0%
Race, ethnicity, and origin ACS 2023
- Neighborhood character
- Predominantly White (82%)
- Race & ethnicity
- White 82% Hispanic / Latino 8% Two or more races 7% Asian 5% Black 1%
- Hispanic origin (detail)
- Mexican 3% Puerto Rican 2% Cuban 1%
- Common ancestry
- Romanian 6% Portuguese 5% German 3%
- Foreign-born
- 11% · Canada, Vietnam
- Languages at home
- 90% English-only · Spanish 5% Other Asian/Pacific 2% Vietnamese 2%
Political lean MEDSL · Lee
- 2024 margin
- Strong R (+28.4) · D 35.5% · R 63.9%
- 2008→2024 swing
- -18.0pp toward R · 2008: -10.4pp · 2024: -28.4pp
- All cycles
- 2024: R+28.4 2020: R+19.2 2016: R+20.4 2012: R+16.6 2008: R+10.4
Not yet ingested
- Civics
- —
Market trends
- HPI YoY
- ▼ -47.83%
- Current HPI
- 355.9229
- Rent YoY
- —
- Metro
- —
- State GDP YoY
- ▲ 3.28%
- F500 in state
- 36
Industry mix (Fortune 500 HQ in FL)
| Industry | F500 HQs | Revenue |
|---|---|---|
| Industrial Technology | 2 | $29B |
|
||
| Insurance | 2 | $17B |
|
||
| Retail | 1 | $60B |
|
||
| Technology Distribution | 1 | $58B |
|
||
| Homebuilding | 1 | $35B |
|
||
| Technology Manufacturing | 1 | $35B |
|
||
Price history
-13.5% since first listed3 events — show timeline
- 2026-04-07 Listed $249,990 FORTMLS
- 2025-12-09 Listing Removed — FORTMLS
- 2025-06-09 Listed $289,000 FORTMLS
Property tax history
+11.3%/yrLatest (2025): $1,840 · +42.1% YoY. Source: county tax records.
Cash-flow waterfall
monthlySold comps — $/sqft
last 12 mo · ≤1 miLoading sold comps…