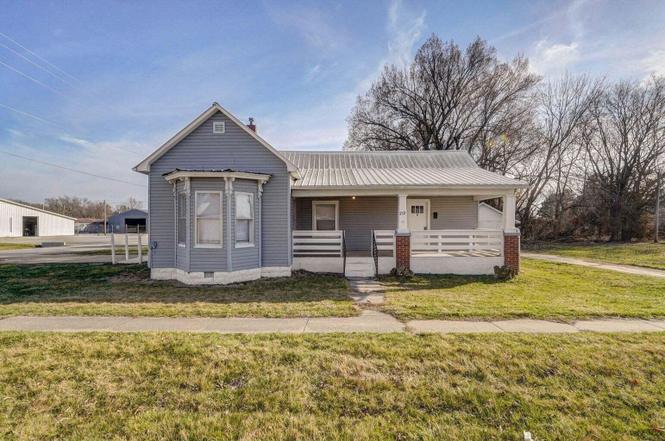
 Duplex
252 Commercial St · Marshfield, MO
Flood risk 1/10 · Minimal
- FEMA flood zone
- X (unshaded)
- Chance of flooding over 30 yrs
- 0.0%
- Est. flood insurance / yr
- $507 – $1,088
Fire risk 4/10 · Minor
- Est. fire insurance / yr
- $1,054 – $1,958
Heat risk 4/10 · Minor
- Hot days now (above 105°F)
- 7 days/yr
- Hot days in 30 yrs
- 19 days/yr
Wind risk 2/10 · Minimal
- Chance of severe wind over 30 yrs
- —
Air-quality risk 2/10 · Minimal
- Unhealthy air days now
- 0 days/yr
- Unhealthy air days in 30 yrs
- 1 days/yr
Risk factors via First Street. Map © Google.
Why this score? — see what drove the B- grade
The composite is a weighted blend of 9 inputs, each scored 0–100. Each bar is that input's sub-score; the figure is the points it added to the 100-point composite (weight × sub-score).
- Cash flow +25.3/30.0
- ARV discount +15.0/15.0
- DSCR +8.4/10.0
- 1% rule +6.6/10.0
- Livability +3.5/5.0
- Schools +3.0/10.0
- Rent growth +2.5/5.0
- Condition / age +2.5/5.0
- Appreciation +0.0/10.0
$157,000
🖨 Deal sheet (PDF) 📄 Offer letter ✓ Due diligence
Multi-family units
County records classify this as Multi-Family (2-4 Unit). Listing-text estimate: 2 units. confirmed
Listing remarks
Attention Investors! Are you looking for an incredible opportunity that meets the 1% rule? Welcome to this completely remodeled duplex in the heart of Marshfield, where opportunity meets convenience. Perfectly situated, this property offers not just a home, but a smart investment for the savvy buyer. The property features a one bedroom, one bathroom unit and a two-bedroom, one bathroom unit. Both units feature updated bathrooms, kitchens, floors, and more! Whether you're seeking an income-generating property or looking to house hack, this versatile layout provides ample space and flexibility. Don't miss out on this incredible opportunity. Call to schedule a showing today! * * CONTRACT FOR
Key facts
- Versatile layout
- Updated floors
- Updated bathrooms
Tags
Neighborhood map
What this means for you Summary
Snapshot
- This is a 2 × 3-bed/2.0-bath units multifamily listed at $157k.
Deal economics
- At list price, monthly cash flow is $358 ($4k/yr) — positive. Per door: $179/mo.
- The deal already cash-flows at list — no discount required.
- Meets the 1% rule at list price ($2k rent vs $157k).
- Recommended offer: $138k (12.0% below list) — sets the bar for market timing.
- Cap rate 9.0% vs local median 2.7% in Marshfield — top-decile yield for the area; either an underpriced asset or a hidden risk that comps aren't pricing in. Stress-test before assuming the spread holds.
Location & tenants
- Location reads 70/100 on livability (#137 in MO) — a middle-class / working-renter tenant base. Strengths: cost of living A+, housing A+, crime B; Watch: employment D+, amenities F, commute F.
- Marshfield R-I (town): math 32% / reading 39% proficiency, ranked #209 of 324 in MO (top 64%) — families likely to look elsewhere, expect single-tenant / working-renter base with shorter leases.
- Zoned schools: Marshfield Early Learning Cntr (174 students, 35% FRL); Marshfield Jr. High (math 35% / reading 40%, grade F, #215 of 391 statewide, top 56%, 670 students, 45% FRL); Marshfield High (math 27% / reading 45%, grade F, #313 of 521 statewide, top 60%, 916 students, 40% FRL) — zoned schools at 40% FRL track the district average.
- Market conditions: 138 active listings in the ZIP; 168 units permitted in Webster County in 2024 (24 in 5+ unit buildings).
Forward outlook
- Local home prices are declining (-3.0%/yr); year-one equity from $1k of loan paydown is wiped out by about $5k of value loss. Plan a longer hold.
- Webster County population projected at +5% by 2050 — modest demand growth; plan on rents tracking national, not racing it.
Negotiation context
- It's been on market 264 days — a 12% lower offer ($138k) is reasonable based on typical stale-listing flexibility.
- 14 sale attempts since 9y ago with the ask held roughly flat each time — persistent listings suggest the price (not the market) is what's stuck; bring a comps-based counter.
Risks & watch-outs
- Watch-outs: built in 1883 — expect roof / HVAC / electrical / plumbing capex.
Questions for the listing agent
- It's been on market 264 days. Have you received any prior offers? Is the seller open to a 12% concession, seller financing, or rate buy-down credit?
- Can we see the unit-by-unit rent roll, current vacancy, and any below-market leases? What's the average tenancy length?
- What capital expenditures (roof, boiler, parking lot, exteriors) have been made in the last 5 years, and what's planned in the next 2?
- Built in 1883 — when were the roof, HVAC, electrical panel, plumbing, and water heater last replaced?
- Why hasn't it sold? Are there any deal-killer items the seller is aware of (foundation, flood, title, zoning, code violations)?
- Is there a deadline driving the sale (1031 exchange, divorce, estate, relocation)? That informs how much negotiation room exists.
- Schools are D-rated, which usually means shorter tenancies and higher turnover. Who's the typical renter profile here, and what's been the actual vacancy rate?
- What's the average days-on-market for RENTAL listings here right now (not sales)? A rising rental-DOM trend means longer vacancies and softer asking-rent achievability than the comps imply.
- What's the recent tenant-quality profile in this submarket — average credit score on applications, eviction rate, late-payment / NSF rate, and stable-employment percentage? A property-management company in the area should have these aggregated.
- How much new apartment / multifamily construction is in the pipeline within 1–3 miles? Heavy new supply (>2% of stock underway) typically softens rents 12–24 months out; light construction supports rent growth.
Investment metrics
- 1% rule
- 1.16% ✓
- Cap rate
- 9.03%
- Cash-on-cash
- 9.78%
- DSCR
- 1.44
- GRM
- 7.2
CMA / ARV
- ARV (on-the-fly)
- $198,396
- Comps found
- 1
Show comp detail 1 sale within ~0.75 mi
| Address | Dist | Beds/Ba | Sqft | Sold | Price | $/sf | Match |
|---|---|---|---|---|---|---|---|
| 304 N Mill St Unit A-D | 0.44mi | 6/1.0 | 1,556 (+4%) | 14mo | $205,000 | $132 | 50 |
Match score weights: distance 35% · size 25% · config 20% · recency 20%. Top-matched comps best support the ARV.
Projected returns pro-forma
-3.0% appreciation · 3.0% rent growth · sell at horizon
- IRR
- -1.6%
- Equity multiple
- 0.94×
- Total profit
- $-2,590
- Equity at exit
- $23,409
- IRR
- 8.1%
- Equity multiple
- 1.62×
- Total profit
- $27,244
- Equity at exit
- $13,574
Cash invested: $43,960 (down + closing). Projections, not guarantees.
Landlord ↔ Tenant lean methodology
- Overall (STATE)
- 81 Strongly Landlord-Friendly
- State Missouri
- 81 Strongly Landlord-Friendly · R+10
- County
- — inherits STATE
- City
- — inherits STATE
ZIP-level market 65706
- Home prices YoY
- -18.7%
- Active inventory
- 138
- Price-to-rent
- 14.3×
Monthly cashflow live
- Estimated rent
- $1,827 medium interval (Pro) →
- Mortgage (P&I)
- −$823
- Tax est. 1.5%
- −$196 /mo · $2,355/yr
- Insurance
- −$65
- HOA
- −$0
- Vacancy / Maint / Mgmt
- −$384
- Net cashflow
- $358
Break-even live
Sensitivity live
| Price | -10% $467 | -5% $413 | +0% $358 | +5% $304 | +10% $250 |
|---|---|---|---|---|---|
| Rent | -10% $214 | -5% $286 | +0% $358 | +5% $431 | +10% $503 |
| Rate | -1.0pp $437 | -0.5pp $398 | base $358 | +0.5pp $318 | +1.0pp $276 |
2-unit breakdown (identical units grouped — click to expand)
| Units | Beds | Baths | Est. rent |
|---|---|---|---|
| 2× units | 3 | 2 | $1,826 |
| #1 | 3 | 2 | $913 |
| #2 | 3 | 2 | $913 |
| Total (2 units) | $1,827 | ||
UW: 25.0% down · 7.5% · 30yr · 1.5% tax · 5.0% vac · 8.0% maint · 8.0% mgmt
Financing live
Cash to close
- Down payment
- $39,250
- Closing costs
- $4,710
- Reserves months
- —
- Total cash needed
- —
Loan-product check · same deal, 3 products live
Conventional
25% down · 7.5% · 30yr
- Down + closing
- —
- Monthly P&I
- —
- Monthly cashflow
- —
- DSCR
- —
- Eligible?
- —
Personal DTI + credit; lowest rate.
DSCR
20% down · 8.5% · 30yr
- Down + closing
- —
- Monthly P&I
- —
- Monthly cashflow
- —
- DSCR
- —
- Eligible?
- —
No personal income docs; deal must DSCR.
Hard money
10% down · 12.0% · 12mo
- Down + closing
- —
- Monthly P&I
- —
- Monthly cashflow
- —
- DSCR
- —
- Eligible?
- —
Short-term bridge; refi at stabilization.
Listing history 27 events
-
2026-02-23status Pending
-
2025-10-02price $157,000
-
2025-06-19price $159,000
-
2025-06-04$163,000 Active
-
2025-05-20status Active
-
2025-05-20price $163,000
-
2025-05-19$163,000 Active
-
2025-04-22historical
-
2025-03-25$168,000 Active
-
2025-01-18historical $595
-
2025-01-11$595
-
2024-05-23historical $595
-
2024-05-05$595
-
2024-03-20historical $775
-
2024-03-20historical $775
-
2024-03-19$775
-
2024-03-19$625
-
2024-03-13status Active
-
2024-02-29status Pending
-
2024-02-27$155,000 Active
-
2024-01-16$139,000 Active
-
2023-10-20price $82,000
-
2023-10-14status Active
-
2023-10-07status Pending
-
2023-10-06$84,000 Active
-
2017-08-29soldstatus
-
2017-06-04$74,900
ⓘ Source: listings_history table (triggers on properties + properties_extension) + one-shot
backfill from property_details.listing_events for pre-trigger history.
Climate risk First Street
- Flood 1/10 Low FEMA zone X (unshaded) · 0% chance over 30 yrs
- Wildfire 4/10 Moderate
- Heat 4/10 Moderate 7 d/yr ≥105°F today · 19 d/yr by 30 yrs out
- Wind 2/10 Low
- Air quality 2/10 Low 0 unhealthy d/yr today · 1 by 30 yrs out
Nearby sold comps map
Loading sold comps map…
Walkable amenities ~0.75 mi
Loading nearby amenities…
Taxation est. · year 1
- Rental income
- $21,924
- − Mortgage interest
- −$8,794
- − Property taxes
- −$2,355
- − Insurance
- −$785
- − Repairs & maintenance
- −$1,754
- − Management
- −$1,754
- − Depreciation
- −$4,567
- Taxable income
- $1,914
- Est. tax owed @ 24.0%
- −$459
- After-tax cash flow
- $3,841/yr
For passive investors: Depreciation is non-cash, so a rental often shows a tax loss while cash-flowing — sheltering income. Rental losses are passive: they offset passive income freely, and up to $25,000/yr can offset ordinary (W-2) income if you actively participate and your MAGI is under $100k (phasing out to $0 by $150k); unused losses carry forward. On sale, claimed depreciation is recaptured at up to 25%, and gains may owe capital-gains tax (a 1031 exchange can defer both). Figures are a year-1 estimate at your 24.0% rate — not tax advice; consult a CPA.
Schools (NCES district)
- District
- Marshfield R-I
- NCES district ID
- 2920430
- Math proficiency
- 32% ▼ -7.00%
- Reading proficiency
- 39% ▼ -3.00%
- Median HH income
- $44,061
- Composite
- 30.17/100
- National rank
- #6320
- State rank
- #209 of 324 in MO
Livability — Marshfield
- Score
- 70/100
- State rank
- #137
- US rank
- #7803
Category grades
Schools grade is shown separately in the Schools card above.
Census & demographics
- Census place
- Marshfield, MO
- Population (ZIP)
- 17,479
Population outlook (Webster County) Hauer SSP2
- Today (2025)
- 39,400 people
- By 2030
- 40,125 · +1.8%
- By 2040
- 41,169 · +4.5%
- By 2050
- 41,286 · +4.8%
- By 2075
- 40,104 · +1.8%
- By 2100
- 33,683 · -14.5%
Race, ethnicity, and origin ACS 2023
- Neighborhood character
- Predominantly White (91%)
- Race & ethnicity
- White 91% Two or more races 6% Hispanic / Latino 2% Black 2%
- Common ancestry
- Slovak 2% Lithuanian 1% Iranian 1%
- Foreign-born
- 1%
- Languages at home
- 99% English-only · Spanish 1%
Political lean MEDSL · Webster
- 2024 margin
- Solid R (+62.2) · D 18.4% · R 80.7%
- 2008→2024 swing
- -33.2pp toward R · 2008: -29.0pp · 2024: -62.2pp
- All cycles
- 2024: R+62.2 2020: R+60.2 2016: R+57.9 2012: R+40.8 2008: R+29.0
Not yet ingested
- Civics
- —
Market trends
- HPI YoY
- ▼ -54.05%
- Current HPI
- 235.6143
- Rent YoY
- —
- Metro
- —
- State GDP YoY
- ▲ 1.84%
- F500 in state
- 20
Industry mix (Fortune 500 HQ in MO)
| Industry | F500 HQs | Revenue |
|---|---|---|
| Healthcare | 1 | $163B |
|
||
| Insurance | 1 | $21B |
|
||
| Industrial Technology | 1 | $17B |
|
||
| Retail | 1 | $16B |
|
||
| Industrial Distribution | 1 | $10B |
|
||
| Utilities | 1 | $9B |
|
||
Price history
+109.6% since first listed27 events — show timeline
- 2026-02-23 Pending — SOMO
- 2025-10-02 Price Changed $157,000 SOMO
- 2025-06-19 Price Changed $159,000 SOMO
- 2025-06-04 Listed $163,000 SOMO
- 2025-05-20 Relisted — SOMO
- 2025-05-20 Price Changed $163,000 SOMO
- 2025-05-19 Listed $163,000 SOMO
- 2025-04-22 Delisted — SOMO
- 2025-03-25 Listed $168,000 SOMO
- 2025-01-18 Rental Removed $595 APPFOLIO
- 2025-01-11 Listed for Rent $595 APPFOLIO
- 2024-05-23 Rental Removed $595 APPFOLIO
- 2024-05-05 Listed for Rent $595 APPFOLIO
- 2024-03-20 Rental Removed $775 APPFOLIO
- 2024-03-20 Rental Removed $775 APPFOLIO
- 2024-03-19 Listed for Rent $775 APPFOLIO
- 2024-03-19 Listed for Rent $625 APPFOLIO
- 2024-03-13 Relisted — SOMO
- 2024-02-29 Pending — SOMO
- 2024-02-27 Listed $155,000 SOMO
- 2024-01-16 Listed $139,000 SOMO
- 2023-10-20 Price Changed $82,000 SOMO
- 2023-10-14 Relisted — SOMO
- 2023-10-07 Pending — SOMO
- 2023-10-06 Listed $84,000 SOMO
- 2017-08-29 Sold (MLS) — SOMO
- 2017-06-04 Listed $74,900 SOMO
Cash-flow waterfall
monthlySold comps — $/sqft
last 12 mo · ≤1 miLoading sold comps…