531 Main St #1511 · New York, NY
Flood risk 1/10 · Minimal
- FEMA flood zone
- X (unshaded)
- Chance of flooding over 30 yrs
- 0.0%
- Est. flood insurance / yr
- $507 – $1,088
Fire risk 1/10 · Minimal
- Est. fire insurance / yr
- $691 – $1,283
Heat risk 6/10 · Moderate
- Hot days now (above 99°F)
- 7 days/yr
- Hot days in 30 yrs
- 14 days/yr
Wind risk 6/10 · Moderate
- Chance of severe wind over 30 yrs
- 27.0%
Air-quality risk 4/10 · Minor
- Unhealthy air days now
- 5 days/yr
- Unhealthy air days in 30 yrs
- 6 days/yr
Risk factors via First Street. Map © Google.
Why this score? — see what drove the D- grade
The composite is a weighted blend of 9 inputs, each scored 0–100. Each bar is that input's sub-score; the figure is the points it added to the 100-point composite (weight × sub-score).
- ARV discount +7.5/15.0
- Appreciation +6.9/10.0
- Schools +5.0/10.0
- 1% rule +4.3/10.0
- Cash flow +4.1/30.0
- Condition / age +4.0/5.0
- Livability +3.8/5.0
- Rent growth +3.4/5.0
- DSCR +0.0/10.0
$598,000
🖨 Deal sheet 📄 Offer letter ✓ Due diligence
Listing remarks
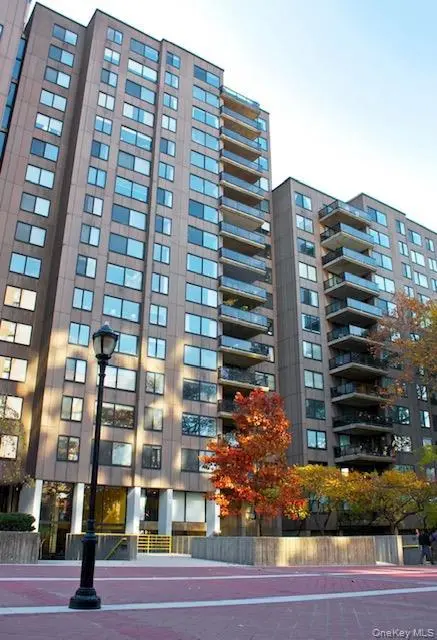
"Lovingly held by the same owner for over 25 years, this residence remains in its original condition- offering a rare opportunity to revovate and customize to your personal taste. A space full of potential, ready to be transformed into your ideal home. " 531 Main Street, also known as "Rivercross", is a prominent residential building located on Roosevelt Island, a unique urban oasis in New York City. Constructed in 1975, this high-rise is part of the original residential development of the island, known for its distinctive design and tranquil environment. Residents of 531 Main Street enjoy a comprehensive array of amenities designed to enhance their quality of life. The
Key facts
- Laundry facilities
- 24 hour doorman
- Children's playroom
Tags
Property features AI
Exterior
- Parking: Other parking
- Utilities: Public sewer; Utilities: See remarks
- Home design: Stock cooperative
- Construction: Brick construction
- Exterior features: Brick construction; Not waterfront
Interior
- Kitchen: Convection oven; Cooktop
- Bedrooms: Includes a bedroom on the first floor
- Bathrooms: 1 full bathroom; 1 half bathroom
- Heating & cooling: Baseboard heating; Central air conditioning
- Interior features: First-floor bedroom; First-floor full bathroom; Original details
- Laundry & utility: Pets allowed
Neighborhood map
What this means for you Summary
Snapshot
- This is a 1-bed/1.5-bath condo listed at $598k. Condition is rated good.
Deal economics
- At list price, monthly cash flow is $-2k ($-20k/yr) — negative.
- The deal already cash-flows at list — no discount required.
- To meet the 1% rule (rent ≥ 1% of price), the offer needs to be $556k (7.1% below list).
- Recommended offer: $556k (7.1% below list) — sets the bar for 1% rule.
Location & tenants
- Location reads 75/100 on livability (#268 in NY, #4,188 nationally) — a middle-class / working-renter tenant base. Strengths: amenities A+, commute A+, health & safety A; Watch: crime F, cost of living F.
- Market conditions: Rents rising (+3.6%/yr); 31 active listings in the ZIP; 40 comparable units currently listed for rent nearby; rentals at typical pace (median 21d on market — plan ~3-4 weeks tenant-placement turnaround); solid renter incomes; 4,467 units permitted in New York County in 2024 (4,463 in 5+ unit buildings).
- At $5,556/mo this rent would consume 65% of the median local household income ($103k/yr) (locally 1319% of renters already pay >50% of income on rent) — very limited rent-growth headroom before tenants either downsize or default.
Forward outlook
- In year one you build about $26k of equity ($4k loan paydown + $22k appreciation (3.7% local appreciation)).
- New York County population projected at +21% by 2050 — long-run rental-demand tailwind backs the buy-and-hold thesis.
- By year 2, paydown + projected appreciation supports a ~$43k cash-out refi (75% LTV) — recoverable capital for the next deal without selling this one.
Negotiation context
- It's been on market 66 days — a 6% lower offer ($562k) is reasonable based on typical stale-listing flexibility.
Risks & watch-outs
- Watch-outs: HOA is 34% of rent.
- Climate carrying-cost: major wind risk, 27% chance of damaging wind over 30y; extreme-heat days projected 7→14/yr by 2055 (HVAC capex compounding) — expect insurance premiums to compound above CPI over the hold.
Questions for the listing agent
- What do current leases actually rent for vs. the listed asking? Can we see a recent rent roll and the last 12 months of T-12 income?
- It's been on market 66 days. Have you received any prior offers? Is the seller open to a 7% concession, seller financing, or rate buy-down credit?
- Built in 1975 — when were the roof, HVAC, electrical panel, plumbing, and water heater last replaced?
- What does the HOA fee cover, when was the last increase, and are there any pending special assessments or reserve-fund shortfalls?
- Any open or pending special assessments — roof, HVAC, plumbing, elevator, façade? What's the per-unit balance and payoff schedule, and is the seller paying it off at close or rolling it to the buyer?
- Why hasn't it sold? Are there any deal-killer items the seller is aware of (foundation, flood, title, zoning, code violations)?
- Is there a deadline driving the sale (1031 exchange, divorce, estate, relocation)? That informs how much negotiation room exists.
- Schools are B-rated — typically a magnet for longer-tenancy family renters. What's the average tenant stay here, and is there a school-zone premium baked into asking?
- Crime grade is F in this area — have there been break-ins, vandalism, or insurance claims at this property in the last 3 years? What carrier currently insures it and at what premium?
- The area grade is low — what's the realistic commute time and amenity access for the typical tenant pool here? Any planned neighborhood developments (good or bad) we should know about?
- What's the average days-on-market for RENTAL listings here right now (not sales)? A rising rental-DOM trend means longer vacancies and softer asking-rent achievability than the comps imply.
- What's the recent tenant-quality profile in this submarket — average credit score on applications, eviction rate, late-payment / NSF rate, and stable-employment percentage? A property-management company in the area should have these aggregated.
- How much new apartment / multifamily construction is in the pipeline within 1–3 miles? Heavy new supply (>2% of stock underway) typically softens rents 12–24 months out; light construction supports rent growth.
Investment metrics
- 1% rule
- 0.93% ✗
- Cap rate
- 2.98%
- Cash-on-cash
- -11.85%
- DSCR
- 0.47
- GRM
- 9.0
CMA / ARV
No comps found within radius.
Projected returns pro-forma
3.72% appreciation · 3.58% rent growth · sell at horizon
- IRR
- -0.5%
- Equity multiple
- 0.97×
- Total profit
- $-5,512
- Equity at exit
- $293,582
- IRR
- 3.8%
- Equity multiple
- 1.64×
- Total profit
- $106,660
- Equity at exit
- $472,664
Cash invested: $167,440 (down + closing). Projections, not guarantees.
Landlord ↔ Tenant lean methodology
- Overall (CITY)
- 0 Strongly Tenant-Friendly
- State New York
- 15 Strongly Tenant-Friendly · D+10
- County
- — inherits STATE
- City New York
- 0 Strongly Tenant-Friendly · D+34
ZIP-level market 10044
- Home prices YoY
- 1.9%
- Rents YoY
- 3.6%
- Active inventory
- 31
- Price-to-rent
- 9.0×
Monthly cashflow live
- Estimated rent
- $5,556 high interval (Pro) →
- Mortgage (P&I)
- −$3,136
- Tax est. 1.5%
- −$748 /mo · $8,970/yr
- Insurance
- −$249
- HOA est. from 1 same-building comp
- −$1,910
- Vacancy / Maint / Mgmt
- −$1,167
- Net cashflow
- $-1,653
Break-even live
UW: 25.0% down · 7.5% · 30yr · 1.5% tax · 5.0% vac · 8.0% maint · 8.0% mgmt
Financing live
Cash to close
- Down payment
- $149,500
- Closing costs
- $17,940
- Reserves months
- —
- Total cash needed
- —
Loan-product check · same deal, 3 products live
Conventional
25% down · 7.5% · 30yr
- Down + closing
- —
- Monthly P&I
- —
- Monthly cashflow
- —
- DSCR
- —
- Eligible?
- —
Personal DTI + credit; lowest rate.
DSCR
20% down · 8.5% · 30yr
- Down + closing
- —
- Monthly P&I
- —
- Monthly cashflow
- —
- DSCR
- —
- Eligible?
- —
No personal income docs; deal must DSCR.
Hard money
10% down · 12.0% · 12mo
- Down + closing
- —
- Monthly P&I
- —
- Monthly cashflow
- —
- DSCR
- —
- Eligible?
- —
Short-term bridge; refi at stabilization.
Rent comps 40 comps
| Address | Beds | Baths | Sqft | Rent | $/sqft | DOM | Units | Dist |
|---|---|---|---|---|---|---|---|---|
| 515 E 72nd St Unit 17D New York, NY | 1.0 | 1.0 | 687 | $5,500 | $8.01 | 24d | 1 | 0.35mi |
| 885 Main St #705 New York, NY | 2.0 | 2.0 | 1100 | $4,950 | $4.50 | 24d | 1 | 0.42mi |
| 885 Main St Unit 6B New York, NY | 2.0 | 2.0 | 950 | $5,320 | $5.60 | 12d | 1 | 0.42mi |
| 411 E 68th St Unit 1021976P New York, NY | 2.0 | 1.0 | 893 | $6,792 | $7.61 | 22d | 1 | 0.44mi |
| 403 E 69th St #1518 New York, NY | 1.0–3.0 | 1.0 | 745 | $3,990 | $5.36 | 24d | 3 | 0.45mi |
| 501 E 74th St #1572 New York, NY | 2.0 | 2.0 | 1000 | $10,210 | $10.21 | 20d | 1 | 0.45mi |
| 1290 1st Ave #1499 New York, NY | 2.0 | 1.0 | 671 | $6,100 | $9.09 | 2d | 2 | 0.46mi |
| 400 E 66th St Unit 1016404P New York, NY | 1.0–2.0 | 1.0–2.0 | 791 | $10,597 | $13.40 | 3d | 2 | 0.47mi |
| 360 E 65th St #1283 New York, NY | 1.0–3.0 | 1.0–2.0 | 1059 | $4,840 | $4.57 | 3d | 3 | 0.51mi |
| 403 E 62nd St Unit 14C New York, NY | 1.0 | 1.0 | 650 | $4,900 | $7.54 | 22d | 1 | 0.53mi |
| 1373 1st Ave Unit 1952 New York, NY | 2.0 | 2.0 | 650 | $7,260 | $11.17 | 24d | 1 | 0.56mi |
| 888 Main St New York, NY | 1.0–3.0 | 1.0–2.0 | 963 | $4,431 | $4.60 | 6d | 7 | 0.56mi |
| 404 E 76th St New York, NY | 1.0–2.0 | 1.0–2.0 | 1001 | $4,895 | $4.89 | 4d | 2 | 0.59mi |
| 300 E 69th St Unit 1294661P New York, NY | 2.0 | 1.0 | 839 | $6,870 | $8.19 | 20d | 1 | 0.59mi |
| 404 E 76th St Unit 19C New York, NY | 2.0 | 2.0 | 1100 | $7,500 | $6.82 | 24d | 1 | 0.60mi |
| 1310 2nd Ave Unit 1224958P New York, NY | 1.0–2.0 | 1.0 | 699 | $5,450 | $7.80 | 1d | 2 | 0.60mi |
| 304 E 65th St Unit 11C New York, NY | 1.0 | 1.0 | 770 | $5,450 | $7.08 | 15d | 1 | 0.62mi |
| 301 E 63rd St New York, NY | 2.0 | 1.0 | 975 | $6,650 | $6.82 | 4d | 1 | 0.65mi |
| 435 E 79th St New York, NY | 1.0–3.0 | 1.0–2.0 | 943 | $5,500 | $5.83 | 7d | 3 | 0.68mi |
| 220 E 65th St New York, NY | 1.0 | 1.0 | 700 | $5,950 | $8.50 | 2d | 1 | 0.68mi |
| 599 E 56th St Unit 1817 New York, NY | 1.0 | 1.0 | 625 | $4,850 | $7.76 | 24d | 1 | 0.68mi |
| 420 E 80th St #198 New York, NY | 1.0 | 1.0 | 623 | $4,760 | $7.64 | 18d | 1 | 0.72mi |
| 225 E 63rd St #1675 New York, NY | 1.0 | 1.0 | 627 | $5,230 | $8.34 | 24d | 2 | 0.72mi |
| 400 E 57th St #2106 New York, NY | 2.0 | 1.0–2.0 | 903 | $6,610 | $7.32 | 3d | 3 | 0.72mi |
| 329 E 58th St #807 New York, NY | 2.0 | 1.0 | 650 | $5,860 | $9.02 | 7d | 1 | 0.73mi |
| 252 E 61st St #638 New York, NY | 1.0 | 1.0 | 666 | $5,530 | $8.30 | 1d | 2 | 0.73mi |
| 347 E 78th St Unit 1460467P New York, NY | 2.0 | 1.0 | 645 | $7,606 | $11.79 | 24d | 1 | 0.73mi |
| 347 E 78th St Unit 1530420P New York, NY | 2.0 | 1.0 | 645 | $6,270 | $9.72 | 22d | 1 | 0.73mi |
| 220 E 63rd St #567 New York, NY | 1.0 | 1.0 | 800 | $6,460 | $8.07 | 20d | 1 | 0.73mi |
| 308 E 78th St #2024 New York, NY | 1.0–2.0 | 1.0 | 550 | $4,610 | $8.38 | 24d | 2 | 0.75mi |
| 315 E 78th St Unit 1021894P New York, NY | 1.0 | 1.0 | 548 | $5,643 | $10.30 | 22d | 1 | 0.76mi |
| 231 E 76th St #1530 New York, NY | 1.0 | 1.0 | 650 | $6,470 | $9.95 | 20d | 1 | 0.77mi |
| 412 E 55th St New York, NY | 1.0 | 1.0 | 767 | $5,250 | $6.84 | 24d | 1 | 0.78mi |
| 301 E 79th St Unit 28P New York, NY | 1.0 | 1.0 | 700 | $5,500 | $7.86 | 24d | 1 | 0.81mi |
| 300 E 57th St #1714 New York, NY | 1.0 | 1.0 | 820 | $5,800 | $7.07 | 20d | 1 | 0.82mi |
| 501 1/2 E 83rd St #1998 New York, NY | 2.0 | 1.0 | 525 | $4,710 | $8.97 | 24d | 2 | 0.82mi |
| 420 E 54th St New York, NY | 3.0 | 1.0–2.5 | 1104 | $7,261 | $6.57 | 1d | 14 | 0.83mi |
| 1567 York Ave Unit 1021866P New York, NY | 2.0 | 1.0 | 742 | $5,910 | $7.96 | 22d | 1 | 0.85mi |
| 227 E 57th St Unit 14C New York, NY | 1.0 | 1.0 | 780 | $4,750 | $6.09 | 24d | 1 | 0.86mi |
| 959 1st Ave Unit 6X New York, NY | 1.0 | 1.0 | 739 | $6,000 | $8.12 | 24d | 1 | 0.91mi |
HOA detail condo
- Monthly dues
- $0 · $0/yr
- Assessments
- None detected in remarks — confirm with the listing agent.
Listing history 12 events
-
2026-06-18days on market $598,000 Active 66 DOM
-
2026-06-17days on market $598,000 Active 65 DOM
-
2026-06-15days on market $598,000 Active 63 DOM
-
2026-06-13days on market $598,000 Active 61 DOM
-
2026-06-10days on market $598,000 Active 57 DOM
-
2026-06-08days on market $598,000 Active 56 DOM
-
2026-06-08days on market $598,000 Active 55 DOM
-
2026-06-04days on market $598,000 Active 52 DOM
-
2026-06-03days on market $598,000 Active 51 DOM
-
2026-06-01days on market $598,000 Active 49 DOM
-
2026-05-31days on market $598,000 Active 48 DOM
-
2026-04-11$598,000 Active
ⓘ Source: listings_history table (triggers on properties + properties_extension) + one-shot
backfill from property_details.listing_events for pre-trigger history.
Climate risk First Street
- Flood 1/10 Low FEMA zone X (unshaded) · 0% chance over 30 yrs
- Wildfire 1/10 Low
- Heat 6/10 Major 7 d/yr ≥99°F today · 14 d/yr by 30 yrs out
- Wind 6/10 Major 27% chance of damaging wind over 30 yrs
- Air quality 4/10 Moderate 5 unhealthy d/yr today · 6 by 30 yrs out
Nearby sold comps map
Loading sold comps map…
Walkable amenities ~0.75 mi
Loading nearby amenities…
Taxation est. · year 1
- Rental income
- $66,678
- − Mortgage interest
- −$33,497
- − Property taxes
- −$8,970
- − Insurance
- −$2,990
- − Repairs & maintenance
- −$5,334
- − Management
- −$5,334
- − HOA
- −$22,920
- − Depreciation
- −$17,396
- Taxable loss
- −$29,765
- Est. tax savings @ 24.0%
- +$7,143
- After-tax cash flow
- $-12,693/yr
For passive investors: Depreciation is non-cash, so a rental often shows a tax loss while cash-flowing — sheltering income. Rental losses are passive: they offset passive income freely, and up to $25,000/yr can offset ordinary (W-2) income if you actively participate and your MAGI is under $100k (phasing out to $0 by $150k); unused losses carry forward. On sale, claimed depreciation is recaptured at up to 25%, and gains may owe capital-gains tax (a 1031 exchange can defer both). Figures are a year-1 estimate at your 24.0% rate — not tax advice; consult a CPA.
Condition & rehab AI · 12 photos
This well-maintained, high-rise condo in a prime location offers a good starting point for a cosmetic renovation to enhance its value.
Repairs flagged
- Minor kitchen cabinets — slight wear
- Minor bathroom fixtures — dated design
Value-add opportunities
- Both kitchen renovation — modernizing the kitchen would enhance both resale and rental value
- Both bathroom renovation — updating the bathroom would enhance both resale and rental value
Renovation cost estimate screening
| Repair item | Severity | Est. cost |
|---|---|---|
| kitchen cabinets · slight wear | Minor | $500–3,000 |
| bathroom fixtures · dated design | Minor | $500–3,000 |
| Total estimated repair cost · 2 items | $1,000–6,000 |
Value-add ROI direction
- Both kitchen renovation — modernizing the kitchen would enhance both resale and rental value ↑
- Both bathroom renovation — updating the bathroom would enhance both resale and rental value ↑
ⓘ Cost ranges are severity-bucket heuristics (US national rule-of-thumb). Get contractor quotes + a written scope before underwriting a rehab budget.
Schools (NCES district)
No district data.
Livability — New York
- Score
- 75/100
- State rank
- #268
- US rank
- #4188
Category grades
Schools grade is shown separately in the Schools card above.
Census & demographics
- Census place
- New York, NY
- County
- New York County · 1,599,927 people
- City population
- 7,731,280
- Metro
- New York-Newark-Jersey City, NY-NJ-PA
- Population (ZIP)
- 11,520
- Household income
- $103,347
- Rent vs Own
- Severe rent burden
- 1319.0
Population outlook (New York County) Hauer SSP2
- Today (2025)
- 1,825,725 people
- By 2030
- 1,904,611 · +4.3%
- By 2040
- 2,052,719 · +12.4%
- By 2050
- 2,206,601 · +20.9%
- By 2075
- 2,509,427 · +37.4%
- By 2100
- 2,702,933 · +48.0%
Race, ethnicity, and origin ACS 2023
- Neighborhood character
- Highly diverse neighborhood (Simpson 0.71)
- Race & ethnicity
- White 41% Asian 29% Black 14% Hispanic / Latino 10% Two or more races 8%
- Hispanic origin (detail)
- Mexican 2% Puerto Rican 2% Dominican 2%
- Common ancestry
- Scotch-Irish 5% Danish 3% Romanian 2%
- Foreign-born
- 54% · Canada, China, South Korea
- Languages at home
- 43% English-only · Other Indo-European 12% Chinese 10% Russian/Polish/Slavic 9%
Political lean MEDSL · New York
- 2024 margin
- Solid D (+64.8) · D 82.4% · R 17.6%
- 2008→2024 swing
- -7.4pp toward R · 2008: 72.2pp · 2024: 64.8pp
- All cycles
- 2024: D+64.8 2020: D+74.5 2016: D+77.2 2012: D+69.6 2008: D+72.2
Not yet ingested
- Civics
- —
Market trends
- HPI YoY
- ▲ 3.72%
- Current HPI
- 200.3549
- Rent YoY
- ▲ 3.58%
- Metro
- New York-Newark-Jersey City, NY-NJ-PA
- State GDP YoY
- ▲ 2.60%
- F500 in state
- 92
Industry mix (Fortune 500 HQ in NY)
| Industry | F500 HQs | Revenue |
|---|---|---|
| Financial Services | 10 | $950B |
|
||
| Consumer Goods | 9 | $162B |
|
||
| Insurance | 4 | $225B |
|
||
| Telecommunications | 2 | $144B |
|
||
| Pharmaceuticals | 2 | $112B |
|
||
| Media / Entertainment | 2 | $69B |
|
||
Price history
1 event — show timeline
- 2026-04-11 Listed $598,000 OneKey® MLS as Distributed by MLS Grid
Cash-flow waterfall
monthlySold comps — $/sqft
last 12 mo · ≤1 miLoading sold comps…