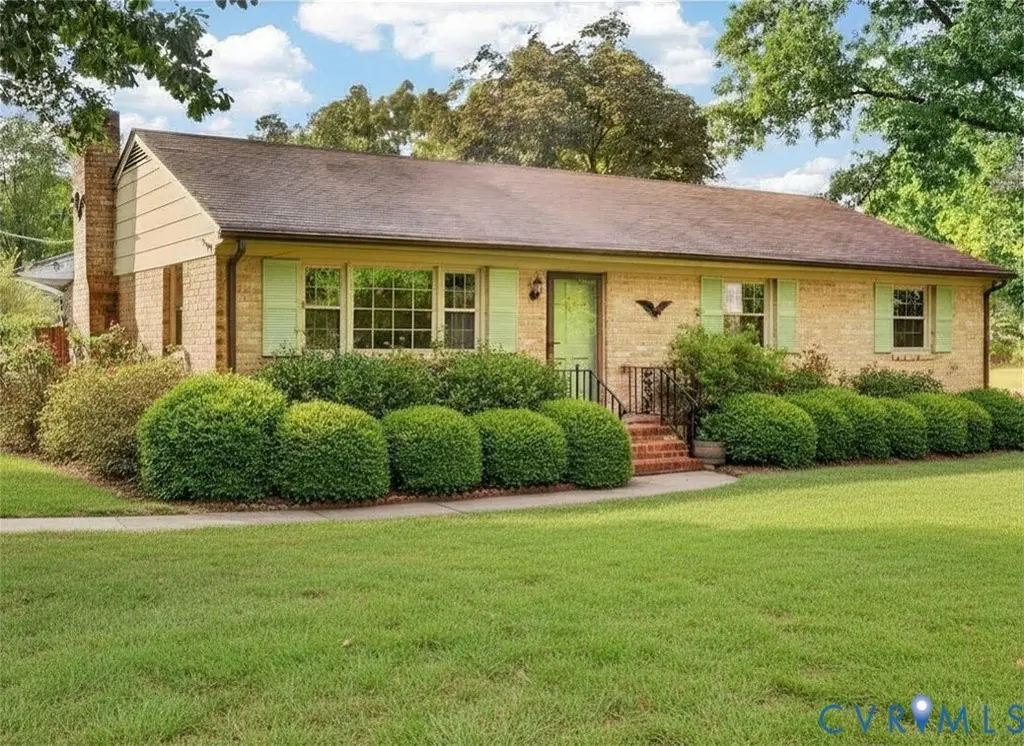
5700 Baron Dr · Meadowbrook, VA
Flood risk 6/10 · Moderate
- FEMA flood zone
- X (unshaded)
- Chance of flooding over 30 yrs
- 0.72%
- Est. flood insurance / yr
- $507 – $1,088
Fire risk 2/10 · Minimal
- Est. fire insurance / yr
- $666 – $1,236
Heat risk 7/10 · Major
- Hot days now (above 106°F)
- 7 days/yr
- Hot days in 30 yrs
- 16 days/yr
Wind risk 6/10 · Moderate
- Chance of severe wind over 30 yrs
- 27.0%
Air-quality risk 2/10 · Minimal
- Unhealthy air days now
- 0 days/yr
- Unhealthy air days in 30 yrs
- 1 days/yr
Risk factors via First Street. Map © Google.
Why this score? — see what drove the D grade
The composite is a weighted blend of 9 inputs, each scored 0–100. Each bar is that input's sub-score; the figure is the points it added to the 100-point composite (weight × sub-score).
- Cash flow +12.1/30.0
- ARV discount +11.0/15.0
- Schools +5.2/10.0
- Livability +3.7/5.0
- DSCR +3.6/10.0
- Rent growth +3.1/5.0
- 1% rule +2.7/10.0
- Condition / age +2.5/5.0
- Appreciation +0.0/10.0
$299,900
🖨 Deal sheet (PDF) 📄 Offer letter ✓ Due diligence
Listing remarks
This charming brick rancher offers the perfect blend of comfort, style, and practicality. Situated on a generous 0.539-acre corner lot, this well-maintained home features 3 bedrooms, 1 full bath, and 1 half bath across 1,269 square feet of inviting living space. Freshly painted throughout, the interior feels bright, refreshed, and move-in ready, while beautiful hardwood floors throughout add warmth, character, and timeless appeal. At the heart of the home, the spacious kitchen serves as a warm and welcoming gathering space, anchored by a beautiful fireplace that creates a cozy focal point full of character and charm. With plenty of room for everyday living, entertaining, and hosting family
Key facts
- Spacious kitchen
- Hardwood floors
- Fireplace
Tags
Property features AI
Exterior
- Parking: Carport; Paved driveway
- Utilities: Public water; Public sewer; Electric service
- Home design: Single-story home (1 story); Resale property
- Construction: Brick exterior with drywall interior; Composition shingle roof
- Exterior features: Rear screened porch; Porch / stoop; Storage shed; Paved driveway; Chain link fenced backyard; Level lot
Interior
- Kitchen: All appliances convey; Range; Dishwasher; Refrigerator; Tile flooring; Fireplace visible from the kitchen area
- Bedrooms: Three bedrooms on the first floor with hardwood flooring, ceiling fans and closets
- Flooring: Hardwood floors in main living areas and bedrooms; Ceramic tile in laundry and kitchen
- Bathrooms: One full bath with tub and shower; One half bath (powder room)
- Heating & cooling: Heat pump with electric heating; Central air conditioning; Attic fan
- Interior features: Ceiling fans; Breakfast area / Eat-in kitchen; Fireplace (masonry, wood burning); Pantry; Main-level primary bedroom; Bedroom on main level
- Laundry & utility: First-floor laundry with tile flooring, cabinets; washer and dryer convey; Washer hookup and dryer hookup; Electric water heater
Neighborhood map
What this means for you Summary
Snapshot
- This is a 3-bed/1.5-bath single-family listed at $300k.
Deal economics
- At list price, monthly cash flow is $-67 ($-808/yr) — negative.
- To cash-flow at today's rent, offer at most $288k (4.0% below list).
- To meet the 1% rule (rent ≥ 1% of price), the offer needs to be $230k (23.2% below list).
- Recommended offer: $230k (23.2% below list) — sets the bar for 1% rule.
- Cap rate 6.0% vs local median 3.9% in Meadowbrook — top-decile yield for the area; either an underpriced asset or a hidden risk that comps aren't pricing in. Stress-test before assuming the spread holds.
Location & tenants
- Location reads 73/100 on livability (#161 in VA) — a middle-class / working-renter tenant base. Strengths: housing A+, health & safety A+, cost of living A-; Watch: amenities F, commute F.
- Chesterfield County Public School District (suburban): math 52% / reading 64% proficiency, ranked #57 of 131 in VA (top 44%) — acceptable for families but not a draw, mixed tenant base, ~2y average lease.
- Zoned schools: J.G. Hening Elementary (math 48% / reading 62%, grade C, #643 of 1,108 statewide, top 59%, 819 students, 82% FRL); Manchester Middle (math 41% / reading 57%, grade C-, #238 of 342 statewide, top 71%, 1,103 students, 81% FRL); Meadowbrook High (math 22% / reading 65%, grade F, #314 of 319 statewide, top 98%, 2,033 students, 79% FRL) — zoned schools average 81% FRL vs 26% district-wide (54 pts higher); higher-poverty schools than district average — tighter screening recommended.
- Market conditions: Rents rising (+2.6%/yr); 369 active listings in the ZIP; 6 comparable units currently listed for rent nearby; rentals at typical pace (median 26d on market — plan ~3-4 weeks tenant-placement turnaround); high-income renter base; 2,307 units permitted in Chesterfield County in 2024 (462 in 5+ unit buildings).
Forward outlook
- Local home prices are declining (-3.0%/yr); year-one equity from $2k of loan paydown is wiped out by about $9k of value loss. Plan a longer hold.
- Chesterfield County population projected at +20% by 2050 — long-run rental-demand tailwind backs the buy-and-hold thesis.
Negotiation context
- Only 4 days on market — expect competitive offers; lowballing is unlikely to land.
Risks & watch-outs
- Climate carrying-cost: major flood risk; major wind risk, 27% chance of damaging wind over 30y; extreme-heat days projected 7→16/yr by 2055 (HVAC capex compounding) — expect insurance premiums to compound above CPI over the hold.
Questions for the listing agent
- What do current leases actually rent for vs. the listed asking? Can we see a recent rent roll and the last 12 months of T-12 income?
- Built in 1970 — when were the roof, HVAC, electrical panel, plumbing, and water heater last replaced?
- Is there a deadline driving the sale (1031 exchange, divorce, estate, relocation)? That informs how much negotiation room exists.
- Schools are B-rated — typically a magnet for longer-tenancy family renters. What's the average tenant stay here, and is there a school-zone premium baked into asking?
- The area grade is low — what's the realistic commute time and amenity access for the typical tenant pool here? Any planned neighborhood developments (good or bad) we should know about?
- What's the average days-on-market for RENTAL listings here right now (not sales)? A rising rental-DOM trend means longer vacancies and softer asking-rent achievability than the comps imply.
- What's the recent tenant-quality profile in this submarket — average credit score on applications, eviction rate, late-payment / NSF rate, and stable-employment percentage? A property-management company in the area should have these aggregated.
- How much new for-sale + rental construction is in the pipeline within 1–3 miles? Heavy new supply typically softens prices + rents 12–24 months out; constrained supply supports both.
Investment metrics
- 1% rule
- 0.77% ✗
- Cap rate
- 6.02%
- Cash-on-cash
- -0.96%
- DSCR
- 0.96
- GRM
- 10.8
CMA / ARV
- ARV (median comp)
- $324,891
- List price
- $299,900
- Delta
- -7.69%
- Verdict
- FAIR
- Comps
- 20 within 1.0 mi
Show comp detail 12 sales within ~0.75 mi
| Address | Dist | Beds/Ba | Sqft | Sold | Price | $/sf | Match |
|---|---|---|---|---|---|---|---|
| 5700 Baron Dr | 0.00mi | 3/1.5 | 1,269 (0%) | 0mo | $300,000 | $236 | 100 |
| 7600 Drexelbrook Rd | 0.32mi | 3/2.0 | 1,244 (-2%) | 3mo | $314,950 | $253 | 77 |
| 7405 Pennbrook Ct | 0.40mi | 3/1.5 | 1,356 (+7%) | 0mo | $325,000 | $240 | 70 |
| 5512 S Jessup Rd | 0.60mi | 3/2.0 | 1,248 (-2%) | 1mo | $327,000 | $262 | 66 |
| 7749 Drexelbrook Rd | 0.30mi | 3/2.0 | 1,350 (+6%) | 9mo | $325,000 | $241 | 66 |
| 7007 Fairpines Rd | 0.34mi | 3/2.0 | 1,344 (+6%) | 12mo | $320,000 | $238 | 62 |
| 6409 E Denny Ct | 0.72mi | 3/1.5 | 1,248 (-2%) | 6mo | $280,000 | $224 | 59 |
| 6812 Fairpines Rd | 0.50mi | 3/2.0 | 1,224 (-4%) | 12mo | $331,000 | $270 | 58 |
| 5200 Huntsville Ct | 0.61mi | 3/2.5 | 1,316 (+4%) | 8mo | $294,950 | $224 | 55 |
| 7617 Belmont Rd | 0.23mi | 3/1.5 | 1,431 (+13%) | 17mo | $299,950 | $210 | 54 |
| 6719 Brambleton Rd | 0.57mi | 3/2.0 | 1,200 (-5%) | 12mo | $338,000 | $282 | 52 |
| 7430 Barkbridge Rd | 0.70mi | 4/2.0 (+1) | 1,296 (+2%) | 14mo | $345,000 | $266 | 45 |
Match score weights: distance 35% · size 25% · config 20% · recency 20%. Top-matched comps best support the ARV.
Projected returns pro-forma
-3.0% appreciation · 2.58% rent growth · sell at horizon
- IRR
- -18.3%
- Equity multiple
- 0.36×
- Total profit
- $-53,936
- Equity at exit
- $44,716
- IRR
- -11.5%
- Equity multiple
- 0.32×
- Total profit
- $-56,757
- Equity at exit
- $25,930
Cash invested: $83,972 (down + closing). Projections, not guarantees.
Landlord ↔ Tenant lean methodology
- Overall (STATE)
- 55 Moderately Landlord-Leaning
- State Virginia
- 55 Moderately Landlord-Leaning · D+2
- County
- — inherits STATE
- City
- — inherits STATE
ZIP-level market 23832
- Rents YoY
- 2.6%
- Active inventory
- 369
- Price-to-rent
- 10.8×
Monthly cashflow live
- Estimated rent
- $2,304 high interval (Pro) →
- Mortgage (P&I)
- −$1,573
- Tax from tax record
- −$190 /mo · $2,279/yr
- Insurance
- −$125
- HOA
- −$0
- Vacancy / Maint / Mgmt
- −$484
- Net cashflow
- $-67
Break-even live
Sensitivity live
| Price | -10% $102 | -5% $18 | +0% $-67 | +5% $-152 | +10% $-237 |
|---|---|---|---|---|---|
| Rent | -10% $-249 | -5% $-158 | +0% $-67 | +5% $24 | +10% $115 |
| Rate | -1.0pp $84 | -0.5pp $9 | base $-67 | +0.5pp $-145 | +1.0pp $-224 |
UW: 25.0% down · 7.5% · 30yr · 1.5% tax · 5.0% vac · 8.0% maint · 8.0% mgmt
Financing live
Cash to close
- Down payment
- $74,975
- Closing costs
- $8,997
- Reserves months
- —
- Total cash needed
- —
Loan-product check · same deal, 3 products live
Conventional
25% down · 7.5% · 30yr
- Down + closing
- —
- Monthly P&I
- —
- Monthly cashflow
- —
- DSCR
- —
- Eligible?
- —
Personal DTI + credit; lowest rate.
DSCR
20% down · 8.5% · 30yr
- Down + closing
- —
- Monthly P&I
- —
- Monthly cashflow
- —
- DSCR
- —
- Eligible?
- —
No personal income docs; deal must DSCR.
Hard money
10% down · 12.0% · 12mo
- Down + closing
- —
- Monthly P&I
- —
- Monthly cashflow
- —
- DSCR
- —
- Eligible?
- —
Short-term bridge; refi at stabilization.
Rent comps 6 comps
| Address | Beds | Baths | Sqft | Rent | $/sqft | DOM | Units | Dist |
|---|---|---|---|---|---|---|---|---|
| 5633 Obisque Dr Chesterfield, VA | 3.0 | 2.5 | 1850 | $2,362 | $1.28 | 25d | 1 | 0.15mi |
| 7731 Drexelbrook Rd Chesterfield, VA | 3.0 | 2.0 | 1300 | $2,262 | $1.74 | 5d | 1 | 0.29mi |
| 7506 Northford Ln Chesterfield, VA | 4.0 | 2.5 | 1874 | $2,695 | $1.44 | 45d | 1 | 0.35mi |
| 5201 Hallmark Dr North Chesterfield, VA | 3.0 | 2.5 | 1600 | $1,550 | $0.97 | 45d | 1 | 0.88mi |
| 6317 Phobus Dr North Chesterfield, VA | 3.0 | 2.0 | 1008 | $2,095 | $2.08 | 5d | 1 | 0.98mi |
| 6139 Buntline Ln North Chesterfield, VA | 3.0 | 2.5 | 1727 | $2,400 | $1.39 | 5d | 1 | 1.39mi |
Listing history 4 events
-
2026-05-17status Pending 1664-char remark
-
2026-05-13$299,900 Active 1664-char remark
-
1984-12-14soldstatus $53,000
-
1970-10-06soldstatus $19,650
ⓘ Source: listings_history table (triggers on properties + properties_extension) + one-shot
backfill from property_details.listing_events for pre-trigger history.
Tax reassessment forecast VA · Resets to sale price
- Current annual tax
- $2,279 · $190/mo
- Projected year-2 tax
- $2,459 · $205/mo
- Expected delta
- +$180/yr (+$15/mo · 7.9%)
ⓘ Screening estimate from a state-policy table — verify with the county assessor before closing.
Climate risk First Street
- Flood 6/10 Major FEMA zone X (unshaded) · 72% chance over 30 yrs
- Wildfire 2/10 Low
- Heat 7/10 Severe 7 d/yr ≥106°F today · 16 d/yr by 30 yrs out
- Wind 6/10 Major 27% chance of damaging wind over 30 yrs
- Air quality 2/10 Low 0 unhealthy d/yr today · 1 by 30 yrs out
Nearby sold comps map
Loading sold comps map…
Walkable amenities ~0.75 mi
Loading nearby amenities…
Taxation est. · year 1
- Rental income
- $27,649
- − Mortgage interest
- −$16,799
- − Property taxes
- −$2,279
- − Insurance
- −$1,500
- − Repairs & maintenance
- −$2,212
- − Management
- −$2,212
- − Depreciation
- −$8,724
- Taxable loss
- −$6,077
- Est. tax savings @ 24.0%
- +$1,458
- After-tax cash flow
- $650/yr
For passive investors: Depreciation is non-cash, so a rental often shows a tax loss while cash-flowing — sheltering income. Rental losses are passive: they offset passive income freely, and up to $25,000/yr can offset ordinary (W-2) income if you actively participate and your MAGI is under $100k (phasing out to $0 by $150k); unused losses carry forward. On sale, claimed depreciation is recaptured at up to 25%, and gains may owe capital-gains tax (a 1031 exchange can defer both). Figures are a year-1 estimate at your 24.0% rate — not tax advice; consult a CPA.
Schools (NCES district)
- District
- Chesterfield County Public School District
- NCES district ID
- 5100840
- Math proficiency
- 52% ▼ -30.00%
- Reading proficiency
- 64% ▼ -15.00%
- Median HH income
- $72,821
- Composite
- 51.56/100
- National rank
- #1712
- State rank
- #57 of 131 in VA
Livability — Meadowbrook
- Score
- 73/100
- State rank
- #161
- US rank
- #5004
Category grades
Schools grade is shown separately in the Schools card above.
Census & demographics
- County
- Chesterfield County · 406,988 people
- City population
- 46,284
- Metro
- Richmond, VA
- Population (ZIP)
- 41,442
- Household income
- $111,684
- Rent vs Own
- Severe rent burden
- 363.0
Population outlook (Chesterfield County) Hauer SSP2
- Today (2025)
- 377,190 people
- By 2030
- 395,710 · +4.9%
- By 2040
- 427,694 · +13.4%
- By 2050
- 452,706 · +20.0%
- By 2075
- 505,533 · +34.0%
- By 2100
- 521,282 · +38.2%
Race, ethnicity, and origin ACS 2023
- Neighborhood character
- Diverse neighborhood (Simpson 0.62)
- Race & ethnicity
- White 55% Black 25% Hispanic / Latino 10% Two or more races 9% Asian 4%
- Hispanic origin (detail)
- Mexican 2% Puerto Rican 1%
- Common ancestry
- Italian 2% Slovak 2% Romanian 2%
- Foreign-born
- 10% · Canada, Vietnam, South Korea
- Languages at home
- 84% English-only · Spanish 10% Other Indo-European 1% Tagalog/Filipino 1%
Political lean MEDSL · Chesterfield
- 2024 margin
- Lean D (+9.0) · D 53.8% · R 44.8% · Other 1.4%
- 2008→2024 swing
- +16.4pp toward D · 2008: -7.5pp · 2024: 9.0pp
- All cycles
- 2024: D+9.0 2020: D+6.7 2016: R+2.2 2012: R+7.1 2008: R+7.5
Not yet ingested
- Civics
- —
Market trends
- HPI YoY
- ▼ -262.03%
- Current HPI
- 267.8038
- Rent YoY
- ▲ 2.58%
- Metro
- Richmond, VA
- State GDP YoY
- ▲ 2.40%
- F500 in state
- 50
Industry mix (Fortune 500 HQ in VA)
| Industry | F500 HQs | Revenue |
|---|---|---|
| Aerospace / Defense | 4 | $236B |
|
||
| Technology / Defense | 3 | $32B |
|
||
| Financial Services | 2 | $176B |
|
||
| Utilities | 2 | $27B |
|
||
| Insurance | 2 | $25B |
|
||
| Technology | 2 | $15B |
|
||
Price history
+1426.7% since first listed5 events — show timeline
- 2026-06-12 Sold (MLS) $300,000 CVRMLS
- 2026-05-17 Pending — CVRMLS
- 2026-05-13 Listed $299,900 CVRMLS
- 1984-12-14 Sold (Public Records) $53,000 Public Records
- 1970-10-06 Sold (Public Records) $19,650 Public Records
Property tax history
+6.1%/yrLatest (2025): $2,279 · +5.0% YoY. Source: county tax records.
Cash-flow waterfall
monthlySold comps — $/sqft
last 12 mo · ≤1 miLoading sold comps…