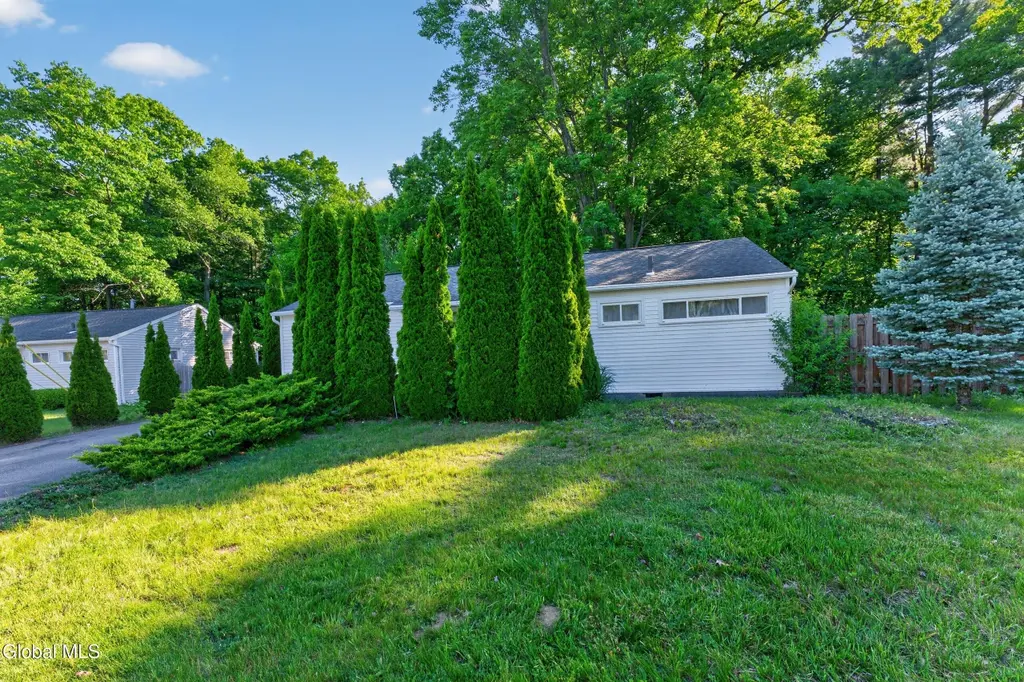
20 Winslow Dr · Niskayuna, NY
Flood risk 1/10 · Minimal
- FEMA flood zone
- X (unshaded)
- Chance of flooding over 30 yrs
- 0.0%
- Est. flood insurance / yr
- $507 – $1,088
Fire risk 3/10 · Minor
- Est. fire insurance / yr
- $691 – $1,283
Heat risk 4/10 · Minor
- Hot days now (above 96°F)
- 7 days/yr
- Hot days in 30 yrs
- 16 days/yr
Wind risk 3/10 · Minor
- Chance of severe wind over 30 yrs
- 5.0%
Air-quality risk 1/10 · Minimal
- Unhealthy air days now
- 0 days/yr
- Unhealthy air days in 30 yrs
- 0 days/yr
Risk factors via First Street. Map © Google.
Why this score? — see what drove the D+ grade
The composite is a weighted blend of 9 inputs, each scored 0–100. Each bar is that input's sub-score; the figure is the points it added to the 100-point composite (weight × sub-score).
- ARV discount +15.0/15.0
- Cash flow +12.1/30.0
- Schools +5.3/10.0
- Livability +4.5/5.0
- DSCR +3.6/10.0
- 1% rule +3.5/10.0
- Condition / age +2.5/5.0
- Rent growth +2.1/5.0
- Appreciation +0.0/10.0
$249,000
🖨 Deal sheet (PDF) 📄 Offer letter ✓ Due diligence
Listing remarks
Welcome to 20 Winslow Drive! Nestled in the highly desirable South Colonie School District, this charming and 3-bedroom, 1-bath ranch offers the ease and convenience of single-floor living in a fantastic Colonie location. Step inside to discover bright, inviting living spaces, a functional floor plan, and plenty of natural light throughout. With a little updating, this house could be great! The spacious backyard, with deck, provides the perfect setting for entertaining guests, enjoying summer barbecues, gardening, or simply relaxing in your own private outdoor retreat. Conveniently located just minutes from shopping, restaurants, parks, schools, and major highways, this home offers both
Key facts
- Spacious backyard
- Deck
- 8,276 sq ft lot
Tags
Property features AI
Exterior
- Parking: Two parking spaces; Paved driveway
- Utilities: Public water; Public sewer; 100 amp service with circuit breakers; Cable available
- Home design: Single-family residence; One-story (all main living on first floor); Shingle roof; Brick/mortar foundation; Vinyl siding
- Construction: Vinyl siding construction; Brick/mortar foundation; Shingle roof
- Exterior features: Deck; Back yard fencing; Private, wooded lot
Interior
- Kitchen: Convection oven; Microwave; Oven; Range; Refrigerator
- Bedrooms: Three bedrooms on the first floor
- Flooring: Tile; Wood; Laminate
- Bathrooms: One full bathroom on the first floor
- Heating & cooling: Forced air heating (natural gas); Central air conditioning
- Interior features: High-speed internet; Ceramic tile bath; Crown molding; Storm door(s); Bay window(s); Blinds; Total of 7 rooms
- Laundry & utility: Washer and dryer included; Main-level laundry room
Neighborhood map
What this means for you Summary
Snapshot
- This is a 3-bed/1.0-bath single-family listed at $249k.
Deal economics
- At list price, monthly cash flow is $-56 ($-668/yr) — negative.
- To cash-flow at today's rent, offer at most $239k (3.9% below list).
- To meet the 1% rule (rent ≥ 1% of price), the offer needs to be $212k (14.9% below list).
- Recommended offer: $212k (14.9% below list) — sets the bar for 1% rule.
- Cap rate 6.0% vs local median 2.6% in Niskayuna — top-decile yield for the area; either an underpriced asset or a hidden risk that comps aren't pricing in. Stress-test before assuming the spread holds.
Location & tenants
- Location reads 91/100 on livability (#3 in NY, #51 nationally) — a professional / high-income tenant draw. Strengths: commute A+, employment A+, housing A+; Watch: cost of living F.
- South Colonie Central School District (suburban): math 63% / reading 57% proficiency, ranked #215 of 590 in NY (top 36%) — acceptable for families but not a draw, mixed tenant base, ~2y average lease; only 19% free/reduced lunch — higher-income household profile.
- Zoned schools: Colonie Central High School (math 96% / reading 72%, grade A, #404 of 1,100 statewide, top 37%, 1,538 students, 39% FRL) — zoned schools average 39% FRL vs 19% district-wide (20 pts higher); higher-poverty schools than district average — tighter screening recommended.
- Zoned-school proficiency averages 84% at this address vs 60% district-wide (+24 pts) — the actual schools serving this property are materially stronger than the South Colonie Central School District average implies; a family-tenant draw the district grade alone would hide.
- Market conditions: Rents soft (-1.6%/yr); 166 active listings in the ZIP; high-income renter base; 675 units permitted in Albany County in 2024 (451 in 5+ unit buildings).
Forward outlook
- Local home prices are declining (-3.0%/yr); year-one equity from $2k of loan paydown is wiped out by about $7k of value loss. Plan a longer hold.
- Albany County population projected at +9% by 2050 — modest demand growth; plan on rents tracking national, not racing it.
Negotiation context
- Only 8 days on market — expect competitive offers; lowballing is unlikely to land.
- Current owner paid $82k; list at $249k implies a 204% gain — meaningful room to come down on a strong offer.
Risks & watch-outs
- Watch-outs: built in 1950 — expect roof / HVAC / electrical / plumbing capex.
Questions for the listing agent
- What do current leases actually rent for vs. the listed asking? Can we see a recent rent roll and the last 12 months of T-12 income?
- Built in 1950 — when were the roof, HVAC, electrical panel, plumbing, and water heater last replaced?
- Is there a deadline driving the sale (1031 exchange, divorce, estate, relocation)? That informs how much negotiation room exists.
- Schools are A-rated — typically a magnet for longer-tenancy family renters. What's the average tenant stay here, and is there a school-zone premium baked into asking?
- The area grade is low — what's the realistic commute time and amenity access for the typical tenant pool here? Any planned neighborhood developments (good or bad) we should know about?
- What's the average days-on-market for RENTAL listings here right now (not sales)? A rising rental-DOM trend means longer vacancies and softer asking-rent achievability than the comps imply.
- What's the recent tenant-quality profile in this submarket — average credit score on applications, eviction rate, late-payment / NSF rate, and stable-employment percentage? A property-management company in the area should have these aggregated.
- How much new for-sale + rental construction is in the pipeline within 1–3 miles? Heavy new supply typically softens prices + rents 12–24 months out; constrained supply supports both.
Investment metrics
- 1% rule
- 0.85% ✗
- Cap rate
- 6.02%
- Cash-on-cash
- -0.96%
- DSCR
- 0.96
- GRM
- 9.8
CMA / ARV
- ARV (on-the-fly)
- $375,360
- Comps found
- 4
Show comp detail 4 sales within ~0.75 mi
| Address | Dist | Beds/Ba | Sqft | Sold | Price | $/sf | Match |
|---|---|---|---|---|---|---|---|
| 61 Jones Dr | 0.08mi | 3/1.5 | 1,104 (0%) | 17mo | $392,000 | $355 | 80 |
| 6 Concord Dr | 0.23mi | 3/1.0 | 1,044 (-5%) | 12mo | $355,000 | $340 | 70 |
| 12 Jones Dr | 0.38mi | 3/2.0 | 1,200 (+9%) | 10mo | $310,000 | $258 | 56 |
| 688 Pearse Rd | 0.74mi | 3/1.5 | 1,196 (+8%) | 20mo | $330,000 | $276 | 33 |
Match score weights: distance 35% · size 25% · config 20% · recency 20%. Top-matched comps best support the ARV.
Projected returns pro-forma
-3.0% appreciation · 0.0% rent growth · sell at horizon
- IRR
- -21.3%
- Equity multiple
- 0.28×
- Total profit
- $-50,066
- Equity at exit
- $37,127
- IRR
- -24.1%
- Equity multiple
- -0.03×
- Total profit
- $-72,010
- Equity at exit
- $21,529
Cash invested: $69,720 (down + closing). Projections, not guarantees.
Landlord ↔ Tenant lean methodology
- Overall (STATE)
- 15 Strongly Tenant-Friendly
- State New York
- 15 Strongly Tenant-Friendly · D+10
- County
- — inherits STATE
- City
- — inherits STATE
ZIP-level market 12309
- Rents YoY
- -1.6%
- Active inventory
- 166
- Price-to-rent
- 9.8×
Monthly cashflow live
- Estimated rent
- $2,119 medium interval (Pro) →
- Mortgage (P&I)
- −$1,306
- Tax from tax record
- −$320 /mo · $3,844/yr
- Insurance
- −$104
- HOA
- −$0
- Vacancy / Maint / Mgmt
- −$445
- Net cashflow
- $-56
Break-even live
Sensitivity live
| Price | -10% $85 | -5% $15 | +0% $-56 | +5% $-126 | +10% $-197 |
|---|---|---|---|---|---|
| Rent | -10% $-223 | -5% $-139 | +0% $-56 | +5% $28 | +10% $112 |
| Rate | -1.0pp $70 | -0.5pp $8 | base $-56 | +0.5pp $-120 | +1.0pp $-186 |
UW: 25.0% down · 7.5% · 30yr · 1.5% tax · 5.0% vac · 8.0% maint · 8.0% mgmt
Financing live
Cash to close
- Down payment
- $62,250
- Closing costs
- $7,470
- Reserves months
- —
- Total cash needed
- —
Loan-product check · same deal, 3 products live
Conventional
25% down · 7.5% · 30yr
- Down + closing
- —
- Monthly P&I
- —
- Monthly cashflow
- —
- DSCR
- —
- Eligible?
- —
Personal DTI + credit; lowest rate.
DSCR
20% down · 8.5% · 30yr
- Down + closing
- —
- Monthly P&I
- —
- Monthly cashflow
- —
- DSCR
- —
- Eligible?
- —
No personal income docs; deal must DSCR.
Hard money
10% down · 12.0% · 12mo
- Down + closing
- —
- Monthly P&I
- —
- Monthly cashflow
- —
- DSCR
- —
- Eligible?
- —
Short-term bridge; refi at stabilization.
Listing history 7 events
-
2026-06-18days on market $249,000 Active 8 DOM
-
2026-06-17days on market $249,000 Active 7 DOM
-
2026-06-16days on market $249,000 Active 6 DOM
-
2026-06-15days on market $249,000 Active 5 DOM
-
2026-06-14days on market $249,000 Active 3 DOM
-
2026-06-13remarks 699-char remark
-
2026-06-13$249,000 Active 2 DOM
ⓘ Source: listings_history table (triggers on properties + properties_extension) + one-shot
backfill from property_details.listing_events for pre-trigger history.
Tax reassessment forecast NY · Partial reset (capped growth)
- Current annual tax
- $3,844 · $320/mo
- Projected year-2 tax
- $4,026 · $335/mo
- Expected delta
- +$182/yr (+$15/mo · 4.7%)
ⓘ Screening estimate from a state-policy table — verify with the county assessor before closing.
Climate risk First Street
- Flood 1/10 Low FEMA zone X (unshaded) · 0% chance over 30 yrs
- Wildfire 3/10 Moderate
- Heat 4/10 Moderate 7 d/yr ≥96°F today · 16 d/yr by 30 yrs out
- Wind 3/10 Moderate 5% chance of damaging wind over 30 yrs
- Air quality 1/10 Low 0 unhealthy d/yr today · 0 by 30 yrs out
Nearby sold comps map
Loading sold comps map…
Walkable amenities ~0.75 mi
Loading nearby amenities…
Taxation est. · year 1
- Rental income
- $25,431
- − Mortgage interest
- −$13,948
- − Property taxes
- −$3,844
- − Insurance
- −$1,245
- − Repairs & maintenance
- −$2,034
- − Management
- −$2,034
- − Depreciation
- −$7,244
- Taxable loss
- −$4,918
- Est. tax savings @ 24.0%
- +$1,180
- After-tax cash flow
- $513/yr
For passive investors: Depreciation is non-cash, so a rental often shows a tax loss while cash-flowing — sheltering income. Rental losses are passive: they offset passive income freely, and up to $25,000/yr can offset ordinary (W-2) income if you actively participate and your MAGI is under $100k (phasing out to $0 by $150k); unused losses carry forward. On sale, claimed depreciation is recaptured at up to 25%, and gains may owe capital-gains tax (a 1031 exchange can defer both). Figures are a year-1 estimate at your 24.0% rate — not tax advice; consult a CPA.
Schools (NCES district)
- District
- South Colonie Central School District
- NCES district ID
- 3627210
- Math proficiency
- 63% ▼ -1.00%
- Reading proficiency
- 57% ▲ 4.00%
- Median HH income
- $69,499
- Composite
- 52.97/100
- National rank
- #1527
- State rank
- #215 of 590 in NY
Livability — Niskayuna
- Score
- 91/100
- State rank
- #3
- US rank
- #51
Category grades
Schools grade is shown separately in the Schools card above.
Census & demographics
- County
- Schenectady County · 141,369 people
- City population
- 32,996
- Metro
- Albany-Schenectady-Troy, NY
- Population (ZIP)
- 33,246
- Household income
- $125,274
- Rent vs Own
- Severe rent burden
- 300.0
Population outlook (Albany County) Hauer SSP2
- Today (2025)
- 320,794 people
- By 2030
- 327,401 · +2.1%
- By 2040
- 338,218 · +5.4%
- By 2050
- 348,467 · +8.6%
- By 2075
- 381,693 · +19.0%
- By 2100
- 393,809 · +22.8%
Race, ethnicity, and origin ACS 2023
- Neighborhood character
- Predominantly White (76%)
- Race & ethnicity
- White 76% Asian 9% Two or more races 8% Hispanic / Latino 5% Black 3%
- Hispanic origin (detail)
- Puerto Rican 3%
- Common ancestry
- Romanian 6% Lithuanian 4% Iranian 3%
- Foreign-born
- 11% · Canada, China, Vietnam
- Languages at home
- 89% English-only · Other Indo-European 3% Spanish 2% Other Asian/Pacific 2%
Political lean MEDSL · Albany
- 2024 margin
- Strong D (+25.8) · D 62.9% · R 37.1%
- 2008→2024 swing
- -3.6pp toward R · 2008: 29.4pp · 2024: 25.8pp
- All cycles
- 2024: D+25.8 2020: D+31.4 2016: D+24.3 2012: D+31.0 2008: D+29.4
Not yet ingested
- Civics
- —
Market trends
- HPI YoY
- ▼ -228.63%
- Current HPI
- 294.773
- Rent YoY
- ▼ -1.55%
- Metro
- Albany-Schenectady-Troy, NY
- State GDP YoY
- ▲ 2.60%
- F500 in state
- 92
Industry mix (Fortune 500 HQ in NY)
| Industry | F500 HQs | Revenue |
|---|---|---|
| Financial Services | 10 | $950B |
|
||
| Consumer Goods | 9 | $162B |
|
||
| Insurance | 4 | $225B |
|
||
| Telecommunications | 2 | $144B |
|
||
| Pharmaceuticals | 2 | $112B |
|
||
| Media / Entertainment | 2 | $69B |
|
||
Price history
+203.7% since first listed2 events — show timeline
- 2026-06-10 Listed $249,000 Global MLS
- 2002-05-30 Sold (Public Records) $82,000 Public Records
Property tax history
+2.0%/yrLatest (2025): $3,844 · -3.2% YoY. Source: county tax records.
Cash-flow waterfall
monthlySold comps — $/sqft
last 12 mo · ≤1 miLoading sold comps…