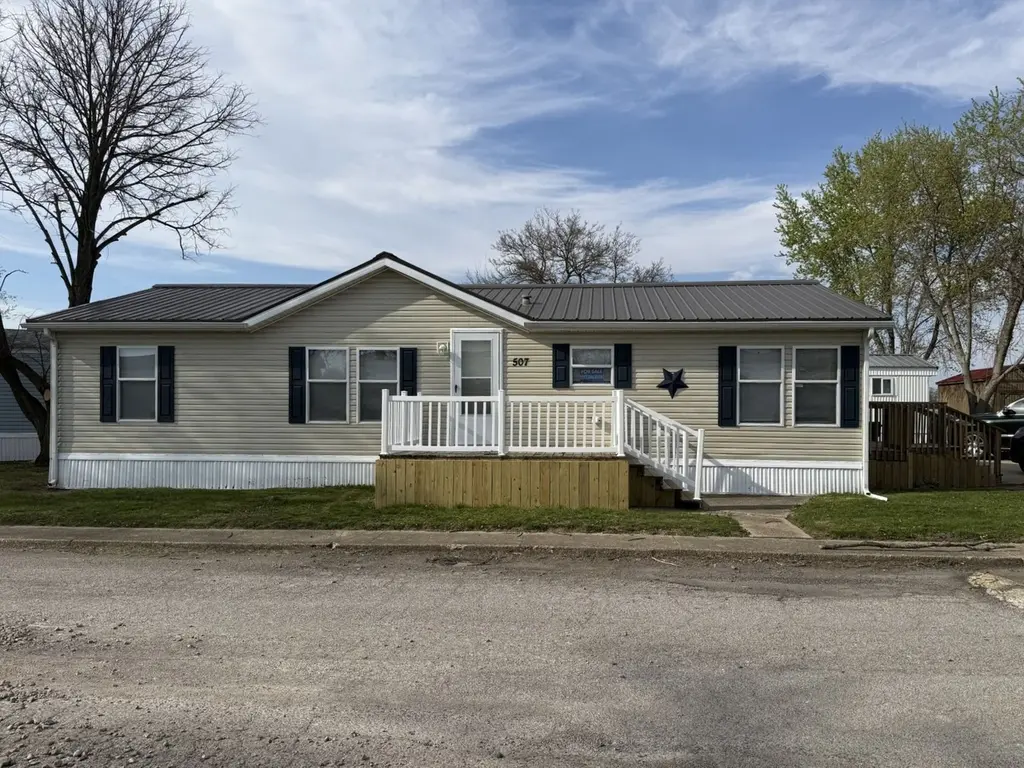
507 W Elm Ave #187 · Charleston, IL
Flood risk No data
- FEMA flood zone
- —
- Chance of flooding over 30 yrs
- —
- Est. flood insurance / yr
- —
Fire risk No data
- Est. fire insurance / yr
- —
Heat risk No data
- Hot days now (above threshold)
- —
- Hot days in 30 yrs
- —
Wind risk No data
- Chance of severe wind over 30 yrs
- —
Air-quality risk No data
- Unhealthy air days now
- —
- Unhealthy air days in 30 yrs
- —
Risk factors via First Street. Map © Google.
Why this score? — see what drove the B- grade
The composite is a weighted blend of 9 inputs, each scored 0–100. Each bar is that input's sub-score; the figure is the points it added to the 100-point composite (weight × sub-score).
- Cash flow +30.0/30.0
- 1% rule +10.0/10.0
- DSCR +10.0/10.0
- ARV discount +7.5/15.0
- Condition / age +3.8/5.0
- Livability +3.7/5.0
- Rent growth +2.5/5.0
- Schools +1.4/10.0
- Appreciation +0.0/10.0
$29,500
🖨 Deal sheet 📄 Offer letter ✓ Due diligence
Listing remarks MLS
* THIS IS A RESALE LISTING * You'll love living in this 3 bedroom, 2 bathroom home within a wonderful family-friendly community. Check out the awesome amenities your community has to offer such as a clubhouse, a playground, community events, and more! This home won't be on the market long, so call us today for more information or to schedule a tour. Deposits & Fees are subject to change.
Key facts
- Built 2026
- Listed 108 days
Neighborhood map
What this means for you Summary
Snapshot
- This is a 3-bed/2.0-bath manufactured listed at $30k. Condition is rated good.
Deal economics
- At list price, monthly cash flow is $606 ($7k/yr) — positive.
- The deal already cash-flows at list — no discount required.
- Meets the 1% rule at list price ($1k rent vs $30k).
- Recommended offer: $27k (9.0% below list) — sets the bar for market timing.
- Cap rate 31.0% vs local median 4.0% in Charleston — top-decile yield for the area; either an underpriced asset or a hidden risk that comps aren't pricing in. Stress-test before assuming the spread holds.
Location & tenants
- Location reads 73/100 on livability (#293 in IL) — a middle-class / working-renter tenant base. Strengths: cost of living A+, housing A+, health & safety A+; Watch: crime C-, amenities C-, schools F.
- Charleston CUSD 1 (town): math 14% / reading 21% proficiency, ranked #489 of 620 in IL (top 79%) — low school quality limits family demand, transient renter base, plan for 1-2y turnover.
- Market conditions: 125 active listings in the ZIP; 1 comparable units currently listed for rent nearby; 34 units permitted in Coles County in 2024 (30 in 5+ unit buildings).
Forward outlook
- Local home prices are declining (-3.0%/yr); year-one equity from $204 of loan paydown is wiped out by about $885 of value loss. Plan a longer hold.
- Coles County population projected to shrink 7% by 2050 — rents likely to lag national; underwrite the cash flow, not the appreciation.
- At projected returns (-3.0% appreciation + 3.0% rent growth), your $8k cash investment doubles in ~2 years — after that, you're playing with house money.
Negotiation context
- It's been on market 109 days — a 9% lower offer ($27k) is reasonable based on typical stale-listing flexibility.
Questions for the listing agent
- It's been on market 109 days. Have you received any prior offers? Is the seller open to a 9% concession, seller financing, or rate buy-down credit?
- Why hasn't it sold? Are there any deal-killer items the seller is aware of (foundation, flood, title, zoning, code violations)?
- Is there a deadline driving the sale (1031 exchange, divorce, estate, relocation)? That informs how much negotiation room exists.
- Schools are F-rated, which usually means shorter tenancies and higher turnover. Who's the typical renter profile here, and what's been the actual vacancy rate?
- What's the average days-on-market for RENTAL listings here right now (not sales)? A rising rental-DOM trend means longer vacancies and softer asking-rent achievability than the comps imply.
- What's the recent tenant-quality profile in this submarket — average credit score on applications, eviction rate, late-payment / NSF rate, and stable-employment percentage? A property-management company in the area should have these aggregated.
- How much new for-sale + rental construction is in the pipeline within 1–3 miles? Heavy new supply typically softens prices + rents 12–24 months out; constrained supply supports both.
Investment metrics
- 1% rule
- 3.48% ✓
- Cap rate
- 30.96%
- Cash-on-cash
- 88.09%
- DSCR
- 4.92
- GRM
- 2.4
CMA / ARV
No comps found within radius.
Projected returns pro-forma
-3.0% appreciation · 3.0% rent growth · sell at horizon
- IRR
- 88.7%
- Equity multiple
- 5.10×
- Total profit
- $33,854
- Equity at exit
- $4,399
- IRR
- 91.7%
- Equity multiple
- 10.60×
- Total profit
- $79,270
- Equity at exit
- $2,551
Cash invested: $8,260 (down + closing). Projections, not guarantees.
Landlord ↔ Tenant lean methodology
- Overall (STATE)
- 43 Moderately Tenant-Leaning
- State Illinois
- 43 Moderately Tenant-Leaning · D+7
- County
- — inherits STATE
- City
- — inherits STATE
ZIP-level market 61920
- Home prices YoY
- -28.1%
- Active inventory
- 125
- Price-to-rent
- 2.4×
Monthly cashflow live
- Estimated rent
- $1,026 medium interval (Pro) →
- Mortgage (P&I)
- −$155
- Tax est. 1.5%
- −$37 /mo · $442/yr
- Insurance
- −$12
- HOA
- −$0
- Vacancy / Maint / Mgmt
- −$215
- Net cashflow
- $606
Break-even live
UW: 25.0% down · 7.5% · 30yr · 1.5% tax · 5.0% vac · 8.0% maint · 8.0% mgmt
Financing live
Cash to close
- Down payment
- $7,375
- Closing costs
- $885
- Reserves months
- —
- Total cash needed
- —
Loan-product check · same deal, 3 products live
Conventional
25% down · 7.5% · 30yr
- Down + closing
- —
- Monthly P&I
- —
- Monthly cashflow
- —
- DSCR
- —
- Eligible?
- —
Personal DTI + credit; lowest rate.
DSCR
20% down · 8.5% · 30yr
- Down + closing
- —
- Monthly P&I
- —
- Monthly cashflow
- —
- DSCR
- —
- Eligible?
- —
No personal income docs; deal must DSCR.
Hard money
10% down · 12.0% · 12mo
- Down + closing
- —
- Monthly P&I
- —
- Monthly cashflow
- —
- DSCR
- —
- Eligible?
- —
Short-term bridge; refi at stabilization.
Rent comps 1 comps
| Address | Beds | Baths | Sqft | Rent | $/sqft | DOM | Units | Dist |
|---|---|---|---|---|---|---|---|---|
| 1408 6th St Charleston, IL | 2.0 | 1.0 | 1346 | $729 | $0.54 | 44d | 3 | 1.30mi |
Listing history 10 events
-
2026-06-09days on market $29,500 Active 109 DOM
-
2026-06-08days on market $29,500 Active 108 DOM
-
2026-06-07days on market $29,500 Active 107 DOM
-
2026-06-05days on market $29,500 Active 104 DOM
-
2026-06-03days on market $29,500 Active 103 DOM
-
2026-06-02days on market $29,500 Active 102 DOM
-
2026-06-01pricedays on market $29,500 Active 101 DOM
-
2026-05-31days on market $29,000 Active 100 DOM
-
2026-05-30days on market $29,000 Active 99 DOM
-
2026-02-20$34,600 Active 399-char remark
Show marketing remark (399 chars)
* THIS IS A RESALE LISTING * You'll love living in this 3 bedroom, 2 bathroom home within a wonderful family-friendly community. Check out the awesome amenities your community has to offer such as a clubhouse, a playground, community events, and more! This home won't be on the market long, so call us today for more information or to schedule a tour. Deposits & Fees are subject to change.
ⓘ Source: listings_history table (triggers on properties + properties_extension) + one-shot
backfill from property_details.listing_events for pre-trigger history.
Nearby sold comps map
Loading sold comps map…
Walkable amenities ~0.75 mi
Loading nearby amenities…
Taxation est. · year 1
- Rental income
- $12,307
- − Mortgage interest
- −$1,652
- − Property taxes
- −$442
- − Insurance
- −$148
- − Repairs & maintenance
- −$985
- − Management
- −$985
- − Depreciation
- −$858
- Taxable income
- $7,237
- Est. tax owed @ 24.0%
- −$1,737
- After-tax cash flow
- $5,539/yr
For passive investors: Depreciation is non-cash, so a rental often shows a tax loss while cash-flowing — sheltering income. Rental losses are passive: they offset passive income freely, and up to $25,000/yr can offset ordinary (W-2) income if you actively participate and your MAGI is under $100k (phasing out to $0 by $150k); unused losses carry forward. On sale, claimed depreciation is recaptured at up to 25%, and gains may owe capital-gains tax (a 1031 exchange can defer both). Figures are a year-1 estimate at your 24.0% rate — not tax advice; consult a CPA.
Condition & rehab AI · 11 photos
This 3-bedroom, 2-bathroom manufactured home is in good condition with minor repairs needed. It's move-in ready with cosmetic updates that would significantly increase its value.
Repairs flagged
- Minor kitchen backsplash — standard backsplash
- Minor bathroom backsplash — standard backsplash
Value-add opportunities
- Both paint interior walls — enhances curb appeal and interior aesthetics
- Both replace ceiling fans — modernizes the home and improves air circulation
- Both install new backsplash in kitchen and bathrooms — adds value and modernizes the space
Renovation cost estimate screening
| Repair item | Severity | Est. cost |
|---|---|---|
| kitchen backsplash · standard backsplash | Minor | $500–3,000 |
| bathroom backsplash · standard backsplash | Minor | $500–3,000 |
| Total estimated repair cost · 2 items | $1,000–6,000 |
Value-add ROI direction
- Both paint interior walls — enhances curb appeal and interior aesthetics ↑
- Both replace ceiling fans — modernizes the home and improves air circulation ↑
- Both install new backsplash in kitchen and bathrooms — adds value and modernizes the space ↑
ⓘ Cost ranges are severity-bucket heuristics (US national rule-of-thumb). Get contractor quotes + a written scope before underwriting a rehab budget.
Schools (NCES district)
- District
- Charleston CUSD 1
- NCES district ID
- 1709600
- Math proficiency
- 14% ▼ -6.00%
- Reading proficiency
- 21% ▼ -8.00%
- Median HH income
- $35,724
- Composite
- 14.45/100
- National rank
- #9429
- State rank
- #489 of 620 in IL
Livability — Charleston
- Score
- 73/100
- State rank
- #293
- US rank
- #5627
Category grades
Schools grade is shown separately in the Schools card above.
Census & demographics
- Census place
- Charleston, IL
- County
- Coles County · 41,301 people
- City population
- 20,951
- Metro
- Charleston-Mattoon, IL
- Population (ZIP)
- 20,951
- Household income
- $52,429
- Rent vs Own
- Severe rent burden
- 1209.0
Population outlook (Coles County) Hauer SSP2
- Today (2025)
- 53,967 people
- By 2030
- 53,829 · -0.3%
- By 2040
- 52,332 · -3.0%
- By 2050
- 49,989 · -7.4%
- By 2075
- 42,226 · -21.8%
- By 2100
- 34,675 · -35.7%
Race, ethnicity, and origin ACS 2023
- Neighborhood character
- Predominantly White (84%)
- Race & ethnicity
- White 84% Black 6% Hispanic / Latino 4% Two or more races 3% Asian 2%
- Common ancestry
- Italian 2% Romanian 2% Iranian 2%
- Foreign-born
- 4% · Canada, Jamaica
- Languages at home
- 95% English-only · Spanish 1% Other Indo-European 1%
Political lean MEDSL · Coles
- 2024 margin
- Strong R (+28.5) · D 34.9% · R 63.4% · Other 1.7%
- 2008→2024 swing
- -31.7pp toward R · 2008: 3.2pp · 2024: -28.5pp
- All cycles
- 2024: R+28.5 2020: R+26.4 2016: R+26.4 2012: R+11.1 2008: D+3.2
Not yet ingested
- Civics
- —
Market trends
- HPI YoY
- ▼ -59.97%
- Current HPI
- 153.8607
- Rent YoY
- —
- Metro
- Charleston-Mattoon, IL
- State GDP YoY
- ▲ 1.59%
- F500 in state
- 60
Industry mix (Fortune 500 HQ in IL)
| Industry | F500 HQs | Revenue |
|---|---|---|
| Insurance | 4 | $201B |
|
||
| Consumer Goods | 4 | $87B |
|
||
| Industrial Machinery | 3 | $64B |
|
||
| Healthcare | 2 | $55B |
|
||
| Retail / Pharmacy | 1 | $148B |
|
||
| Agriculture / Food | 1 | $86B |
|
||
Price history
1 event — show timeline
- 2026-02-20 Listed $34,600 Zillow
Cash-flow waterfall
monthlySold comps — $/sqft
last 12 mo · ≤1 miLoading sold comps…