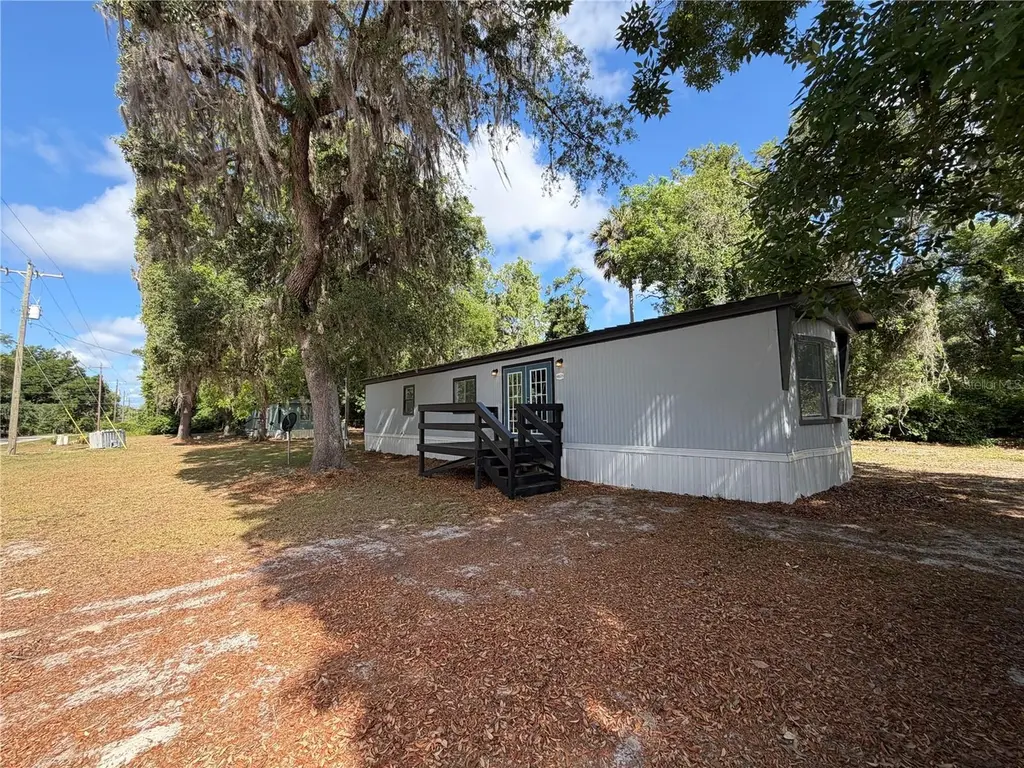
4605 NE 167th Pl · Reddick, FL
Flood risk 1/10 · Minimal
- FEMA flood zone
- X (unshaded)
- Chance of flooding over 30 yrs
- 0.0%
- Est. flood insurance / yr
- $507 – $1,088
Fire risk 7/10 · Major
- Est. fire insurance / yr
- $947 – $1,759
Heat risk 8/10 · Major
- Hot days now (above 108°F)
- 7 days/yr
- Hot days in 30 yrs
- 21 days/yr
Wind risk 9/10 · Severe
- Chance of severe wind over 30 yrs
- 99.0%
Air-quality risk 3/10 · Minor
- Unhealthy air days now
- 2 days/yr
- Unhealthy air days in 30 yrs
- 4 days/yr
Risk factors via First Street. Map © Google.
Why this score? — see what drove the C+ grade
The composite is a weighted blend of 9 inputs, each scored 0–100. Each bar is that input's sub-score; the figure is the points it added to the 100-point composite (weight × sub-score).
- Cash flow +30.0/30.0
- DSCR +10.0/10.0
- 1% rule +8.9/10.0
- Schools +3.6/10.0
- Livability +2.9/5.0
- Rent growth +2.5/5.0
- Condition / age +2.5/5.0
- ARV discount +0.0/15.0
- Appreciation +0.0/10.0
$79,000
🖨 Deal sheet (PDF) 📄 Offer letter ✓ Due diligence
Listing remarks
Under contract-accepting backup offers. Don’t miss this beautifully renovated 1980 single-wide home that blends classic charm with modern upgrades—move-in ready and worry-free! Offering 989 sq ft of thoughtfully updated living space, this home features a brand-new heating and A/C system, completely updated electrical, and all-new plumbing for peace of mind. Enjoy enhanced durability with additional support pillars, upgraded insulation, and a water barrier designed for efficiency and long-term protection. The private well is equipped with a water treatment system, adding extra value and convenience. Whether you’re looking for an affordable full-time residence or a smart inv
Key facts
- 0.31 acre lot
- Built 1980
- Listed 40 days
Property features AI
Finance
- Other: Property type: Residential; Property subtype: Manufactured Home; Zoning: R4; Total rooms: 3; Unfurnished
- Financial info: No investor or income/expense details provided
- HOA & community: No HOA
Exterior
- Parking: No specific parking details provided
- Utilities: Well water; Private sewer / septic tank; Electricity connected; Water connected
- Home design: Manufactured single-wide home; One story; Faces south; Entry level: One
- Construction: Vinyl siding; Metal roof; Pillar/post/pier foundation; Built area 789 square feet; Lot dimensions approximately 150 x 90 (0.31 acre)
- Exterior features: French doors; Asphalt road access
Interior
- Kitchen: Built-in oven; Microwave; Refrigerator; Water filtration system
- Bedrooms: 2 bedrooms
- Flooring: Carpet; Living area 789 square feet
- Bathrooms: 1 full bathroom
- Heating & cooling: Ductless heating; Mini-split cooling units; Wall/window cooling unit(s)
- Interior features: High ceilings; Open floorplan; Vaulted ceilings
- Laundry & utility: Inside laundry; Washer; Dryer
Neighborhood map
What this means for you Summary
Snapshot
- This is a 2-bed/2.0-bath manufactured listed at $79k.
Deal economics
- At list price, monthly cash flow is $347 ($4k/yr) — positive.
- The deal already cash-flows at list — no discount required.
- Meets the 1% rule at list price ($1k rent vs $79k).
- Recommended offer: $77k (3.0% below list) — sets the bar for market timing.
- Cap rate 11.6% vs local median 1.7% in Reddick — top-decile yield for the area; either an underpriced asset or a hidden risk that comps aren't pricing in. Stress-test before assuming the spread holds.
Location & tenants
- Location reads 58/100 on livability (#845 in FL) — a working-class tenant base; expect higher turnover. Strengths: cost of living A+, housing A+; Watch: crime D, schools D-, amenities F.
- Marion (rural): math 42% / reading 43% proficiency, ranked #61 of 73 in FL (top 84%) — families likely to look elsewhere, expect single-tenant / working-renter base with shorter leases; 61% free/reduced lunch — lower-income household profile, screen leases tightly.
- Market conditions: 142 active listings in the ZIP; 1 comparable units currently listed for rent nearby; 7,071 units permitted in Marion County in 2024 (534 in 5+ unit buildings).
Forward outlook
- Local home prices are declining (-3.0%/yr); year-one equity from $546 of loan paydown is wiped out by about $2k of value loss. Plan a longer hold.
- Marion County population projected at +13% by 2050 — modest demand growth; plan on rents tracking national, not racing it.
- At projected returns (-3.0% appreciation + 3.0% rent growth), your $22k cash investment doubles in ~7 years — after that, you're playing with house money.
Negotiation context
- It's been on market 40 days — a 3% lower offer ($77k) is reasonable based on typical stale-listing flexibility.
Risks & watch-outs
- Climate carrying-cost: severe wind risk, 99% chance of damaging wind over 30y; major wildfire risk; extreme-heat days projected 7→21/yr by 2055 (HVAC capex compounding) — expect insurance premiums to compound above CPI over the hold.
Questions for the listing agent
- It's been on market 40 days. Have you received any prior offers? Is the seller open to a 3% concession, seller financing, or rate buy-down credit?
- Is there a deadline driving the sale (1031 exchange, divorce, estate, relocation)? That informs how much negotiation room exists.
- Schools are D-rated, which usually means shorter tenancies and higher turnover. Who's the typical renter profile here, and what's been the actual vacancy rate?
- Crime grade is D in this area — have there been break-ins, vandalism, or insurance claims at this property in the last 3 years? What carrier currently insures it and at what premium?
- What's the average days-on-market for RENTAL listings here right now (not sales)? A rising rental-DOM trend means longer vacancies and softer asking-rent achievability than the comps imply.
- What's the recent tenant-quality profile in this submarket — average credit score on applications, eviction rate, late-payment / NSF rate, and stable-employment percentage? A property-management company in the area should have these aggregated.
- How much new for-sale + rental construction is in the pipeline within 1–3 miles? Heavy new supply typically softens prices + rents 12–24 months out; constrained supply supports both.
Investment metrics
- 1% rule
- 1.39% ✓
- Cap rate
- 11.56%
- Cash-on-cash
- 18.83%
- DSCR
- 1.84
- GRM
- 6.0
CMA / ARV
- ARV (median comp)
- $57,440
- List price
- $79,000
- Delta
- 37.54%
- Verdict
- OVERPRICED
- Comps
- 1 within 2.0 mi
Projected returns pro-forma
-3.0% appreciation · 3.0% rent growth · sell at horizon
- IRR
- 10.6%
- Equity multiple
- 1.42×
- Total profit
- $9,302
- Equity at exit
- $11,779
- IRR
- 19.7%
- Equity multiple
- 2.65×
- Total profit
- $36,567
- Equity at exit
- $6,830
Cash invested: $22,120 (down + closing). Projections, not guarantees.
Landlord ↔ Tenant lean methodology
- Overall (STATE)
- 87 Strongly Landlord-Friendly
- State Florida
- 87 Strongly Landlord-Friendly · R+3
- County
- — inherits STATE
- City
- — inherits STATE
ZIP-level market 32113
- Home prices YoY
- -5.5%
- Active inventory
- 142
- Price-to-rent
- 6.0×
Monthly cashflow live
- Estimated rent
- $1,100 medium interval (Pro) →
- Mortgage (P&I)
- −$414
- Tax from tax record
- −$75 /mo · $897/yr
- Insurance
- −$33
- HOA
- −$0
- Vacancy / Maint / Mgmt
- −$231
- Net cashflow
- $347
Break-even live
Sensitivity live
| Price | -10% $392 | -5% $369 | +0% $347 | +5% $325 | +10% $302 |
|---|---|---|---|---|---|
| Rent | -10% $260 | -5% $304 | +0% $347 | +5% $390 | +10% $434 |
| Rate | -1.0pp $387 | -0.5pp $367 | base $347 | +0.5pp $327 | +1.0pp $306 |
UW: 25.0% down · 7.5% · 30yr · 1.5% tax · 5.0% vac · 8.0% maint · 8.0% mgmt
Financing live
Cash to close
- Down payment
- $19,750
- Closing costs
- $2,370
- Reserves months
- —
- Total cash needed
- —
Loan-product check · same deal, 3 products live
Conventional
25% down · 7.5% · 30yr
- Down + closing
- —
- Monthly P&I
- —
- Monthly cashflow
- —
- DSCR
- —
- Eligible?
- —
Personal DTI + credit; lowest rate.
DSCR
20% down · 8.5% · 30yr
- Down + closing
- —
- Monthly P&I
- —
- Monthly cashflow
- —
- DSCR
- —
- Eligible?
- —
No personal income docs; deal must DSCR.
Hard money
10% down · 12.0% · 12mo
- Down + closing
- —
- Monthly P&I
- —
- Monthly cashflow
- —
- DSCR
- —
- Eligible?
- —
Short-term bridge; refi at stabilization.
Rent comps 1 comps
| Address | Beds | Baths | Sqft | Rent | $/sqft | DOM | Units | Dist |
|---|---|---|---|---|---|---|---|---|
| 17410 NE 37th Ct Citra, FL | 1.0 | 1.0 | 672 | $1,100 | $1.64 | 13d | 1 | 1.05mi |
Listing history 13 events
-
2026-06-09status $79,000 Pending 40 DOM
-
2026-06-08days on market $79,000 Active 40 DOM
-
2026-06-07days on market $79,000 Active 39 DOM
-
2026-06-03days on market $79,000 Active 35 DOM
-
2026-06-02days on market $79,000 Active 34 DOM
-
2026-06-01days on market $79,000 Active 33 DOM
-
2026-06-01price $79,000 Active 32 DOM
-
2026-05-31days on market $85,000 Active 32 DOM
-
2026-05-30days on market $85,000 Active 31 DOM
-
2026-04-29$85,000 Active 752-char remark
-
2023-06-07soldstatus $87,000
-
2005-03-25soldstatus $19,500
-
2002-03-07soldstatus $18,500
ⓘ Source: listings_history table (triggers on properties + properties_extension) + one-shot
backfill from property_details.listing_events for pre-trigger history.
Tax reassessment forecast FL · Resets to sale price
- Current annual tax
- $897 · $75/mo
- Projected year-2 tax
- $897 · $75/mo
- Expected delta
- $0/yr ($0/mo · 0.0%)
ⓘ Screening estimate from a state-policy table — verify with the county assessor before closing.
Climate risk First Street
- Flood 1/10 Low FEMA zone X (unshaded) · 0% chance over 30 yrs
- Wildfire 7/10 Severe
- Heat 8/10 Severe 7 d/yr ≥108°F today · 21 d/yr by 30 yrs out
- Wind 9/10 Extreme 99% chance of damaging wind over 30 yrs
- Air quality 3/10 Moderate 2 unhealthy d/yr today · 4 by 30 yrs out
Nearby sold comps map
Loading sold comps map…
Walkable amenities ~0.75 mi
Loading nearby amenities…
Taxation est. · year 1
- Rental income
- $13,200
- − Mortgage interest
- −$4,425
- − Property taxes
- −$897
- − Insurance
- −$395
- − Repairs & maintenance
- −$1,056
- − Management
- −$1,056
- − Depreciation
- −$2,298
- Taxable income
- $3,072
- Est. tax owed @ 24.0%
- −$737
- After-tax cash flow
- $3,427/yr
For passive investors: Depreciation is non-cash, so a rental often shows a tax loss while cash-flowing — sheltering income. Rental losses are passive: they offset passive income freely, and up to $25,000/yr can offset ordinary (W-2) income if you actively participate and your MAGI is under $100k (phasing out to $0 by $150k); unused losses carry forward. On sale, claimed depreciation is recaptured at up to 25%, and gains may owe capital-gains tax (a 1031 exchange can defer both). Figures are a year-1 estimate at your 24.0% rate — not tax advice; consult a CPA.
Schools (NCES district)
- District
- Marion
- NCES district ID
- 1201260
- Math proficiency
- 42% ▼ -7.00%
- Reading proficiency
- 43% ▼ -4.00%
- Median HH income
- $40,015
- Composite
- 35.61/100
- National rank
- #4890
- State rank
- #61 of 73 in FL
Livability — Reddick
- Score
- 58/100
- State rank
- #845
- US rank
- #21164
Category grades
Schools grade is shown separately in the Schools card above.
Census & demographics
- Population (ZIP)
- 5,382
Population outlook (Marion County) Hauer SSP2
- Today (2025)
- 365,905 people
- By 2030
- 376,768 · +3.0%
- By 2040
- 396,555 · +8.4%
- By 2050
- 412,723 · +12.8%
- By 2075
- 446,090 · +21.9%
- By 2100
- 436,193 · +19.2%
Race, ethnicity, and origin ACS 2023
- Neighborhood character
- Predominantly White (67%)
- Race & ethnicity
- White 67% Black 12% Two or more races 11% Hispanic / Latino 10%
- Hispanic origin (detail)
- Mexican 5% Puerto Rican 3% Cuban 1%
- Common ancestry
- Iranian 3% Serbian 2% Slovak 1%
- Foreign-born
- 3% · Canada
- Languages at home
- 93% English-only · Spanish 6% Other Indo-European 1%
Political lean MEDSL · Marion
- 2024 margin
- Solid R (+31.6) · D 33.8% · R 65.5%
- 2008→2024 swing
- -20.0pp toward R · 2008: -11.6pp · 2024: -31.6pp
- All cycles
- 2024: R+31.6 2020: R+25.9 2016: R+26.2 2012: R+16.2 2008: R+11.6
Not yet ingested
- Civics
- —
Market trends
- HPI YoY
- ▼ -16.68%
- Current HPI
- 284.1669
- Rent YoY
- —
- Metro
- —
- State GDP YoY
- ▲ 3.28%
- F500 in state
- 36
Industry mix (Fortune 500 HQ in FL)
| Industry | F500 HQs | Revenue |
|---|---|---|
| Industrial Technology | 2 | $29B |
|
||
| Insurance | 2 | $17B |
|
||
| Retail | 1 | $60B |
|
||
| Technology Distribution | 1 | $58B |
|
||
| Homebuilding | 1 | $35B |
|
||
| Technology Manufacturing | 1 | $35B |
|
||
Price history
+327.0% since first listed6 events — show timeline
- 2026-06-08 Pending — Stellar MLS as Distributed by MLS Grid
- 2026-06-01 Price Changed $79,000 Stellar MLS as Distributed by MLS Grid
- 2026-04-29 Listed $85,000 Stellar MLS as Distributed by MLS Grid
- 2023-06-07 Sold (Public Records) $87,000 Public Records
- 2005-03-25 Sold (Public Records) $19,500 Public Records
- 2002-03-07 Sold (Public Records) $18,500 Public Records
Property tax history
+6.3%/yrLatest (2025): $897 · +29.8% YoY. Source: county tax records.
Cash-flow waterfall
monthlySold comps — $/sqft
last 12 mo · ≤1 miLoading sold comps…