1401 N 33rd St · Lincoln, NE
Flood risk 1/10 · Minimal
- FEMA flood zone
- X (unshaded)
- Chance of flooding over 30 yrs
- 0.0%
- Est. flood insurance / yr
- $473 – $860
Fire risk 1/10 · Minimal
- Est. fire insurance / yr
- $1,161 – $2,155
Heat risk 3/10 · Minor
- Hot days now (above 104°F)
- 7 days/yr
- Hot days in 30 yrs
- 16 days/yr
Wind risk 2/10 · Minimal
- Chance of severe wind over 30 yrs
- —
Air-quality risk 1/10 · Minimal
- Unhealthy air days now
- 0 days/yr
- Unhealthy air days in 30 yrs
- 0 days/yr
Risk factors via First Street. Map © Google.
Why this score? — see what drove the C grade
The composite is a weighted blend of 9 inputs, each scored 0–100. Each bar is that input's sub-score; the figure is the points it added to the 100-point composite (weight × sub-score).
- Cash flow +20.2/30.0
- ARV discount +13.7/15.0
- DSCR +6.4/10.0
- 1% rule +4.9/10.0
- Schools +4.4/10.0
- Livability +4.2/5.0
- Rent growth +3.1/5.0
- Condition / age +2.5/5.0
- Appreciation +0.0/10.0
$199,000
🖨 Deal sheet (PDF) 📄 Offer letter ✓ Due diligence
Listing remarks MLS
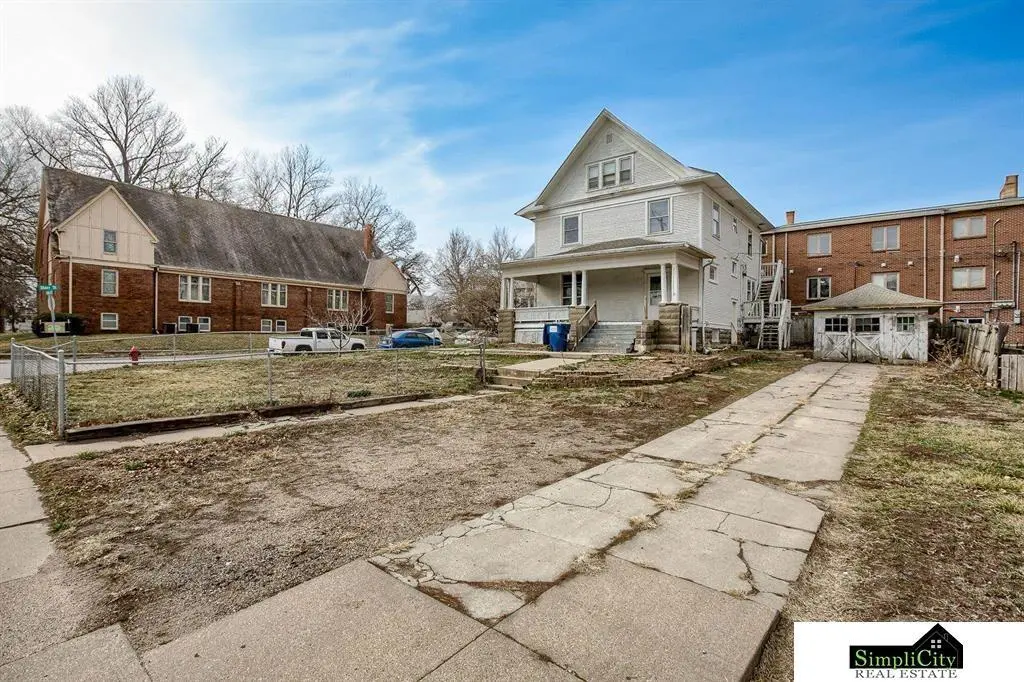
Investor special! Conversion duplex, 5 bed/ 1 bath unit rented at $1,400/month and a 1 bed/ 1 bath unit rented at $875/month. Conveniently located near East Campus with off street parking.
Key facts
- Off street parking
- Near east campus
- 7,405 sq ft lot
Tags
Neighborhood map
What this means for you Summary
Snapshot
- This is a 5-bed/2.0-bath other listed at $199k.
Deal economics
- At list price, monthly cash flow is $250 ($3k/yr) — positive.
- The deal already cash-flows at list — no discount required.
- To meet the 1% rule (rent ≥ 1% of price), the offer needs to be $197k (0.8% below list).
- Recommended offer: $187k (6.0% below list) — sets the bar for market timing.
- Cap rate 7.8% vs local median 3.0% in Lincoln — top-decile yield for the area; either an underpriced asset or a hidden risk that comps aren't pricing in. Stress-test before assuming the spread holds.
Location & tenants
- Location reads 85/100 on livability (#5 in NE, #545 nationally) — a professional / high-income tenant draw. Strengths: amenities A+, cost of living A+, housing A+; Watch: crime D+.
- Lincoln Public Schools (urban): math 50% / reading 53% proficiency, ranked #59 of 111 in NE (top 53%) — acceptable for families but not a draw, mixed tenant base, ~2y average lease.
- Zoned schools: Clinton Elementary School (math 32% / reading 32%, grade F, #405 of 502 statewide, top 84%, 407 students, 0% FRL); Culler Middle School (math 30% / reading 33%, grade F, #109 of 128 statewide, top 85%, 703 students, 74% FRL); North Star High School (math 36% / reading 33%, grade F, #208 of 261 statewide, top 86%, 2,072 students, 55% FRL).
- Zoned-school proficiency averages 33% at this address vs 52% district-wide (-19 pts) — the specific schools serving this property underperform the Lincoln Public Schools average; the district grade overstates school quality for this exact location.
- Market conditions: Rents rising (+2.4%/yr); 59 active listings in the ZIP; 1 comparable units currently listed for rent nearby; 1,940 units permitted in Lancaster County in 2024 (895 in 5+ unit buildings).
- This rent runs 44% of the median local income ($54k/yr) — at the standard rent-burdened threshold; future hikes will face affordability resistance.
Forward outlook
- Local home prices are declining (-3.0%/yr); year-one equity from $1k of loan paydown is wiped out by about $6k of value loss. Plan a longer hold.
- Lancaster County population projected at +37% by 2050 — long-run rental-demand tailwind backs the buy-and-hold thesis.
Negotiation context
- It's been on market 88 days — a 6% lower offer ($187k) is reasonable based on typical stale-listing flexibility.
- 7 sale attempts since 4y ago; this cycle's ask has dropped $11k (5%) from the opening price — seller is motivated, your offer sets the floor, not the list.
Risks & watch-outs
- Watch-outs: built in 1900 — expect roof / HVAC / electrical / plumbing capex.
Questions for the listing agent
- It's been on market 88 days. Have you received any prior offers? Is the seller open to a 6% concession, seller financing, or rate buy-down credit?
- Built in 1900 — when were the roof, HVAC, electrical panel, plumbing, and water heater last replaced?
- Why hasn't it sold? Are there any deal-killer items the seller is aware of (foundation, flood, title, zoning, code violations)?
- Is there a deadline driving the sale (1031 exchange, divorce, estate, relocation)? That informs how much negotiation room exists.
- Schools are A-rated — typically a magnet for longer-tenancy family renters. What's the average tenant stay here, and is there a school-zone premium baked into asking?
- Crime grade is D in this area — have there been break-ins, vandalism, or insurance claims at this property in the last 3 years? What carrier currently insures it and at what premium?
- What's the average days-on-market for RENTAL listings here right now (not sales)? A rising rental-DOM trend means longer vacancies and softer asking-rent achievability than the comps imply.
- What's the recent tenant-quality profile in this submarket — average credit score on applications, eviction rate, late-payment / NSF rate, and stable-employment percentage? A property-management company in the area should have these aggregated.
- How much new for-sale + rental construction is in the pipeline within 1–3 miles? Heavy new supply typically softens prices + rents 12–24 months out; constrained supply supports both.
Investment metrics
- 1% rule
- 0.99% ✗
- Cap rate
- 7.80%
- Cash-on-cash
- 5.38%
- DSCR
- 1.24
- GRM
- 8.4
CMA / ARV
- ARV (median comp)
- $230,920
- List price
- $199,000
- Delta
- -13.82%
- Verdict
- UNDERPRICED
- Comps
- 11 within 1.0 mi
Projected returns pro-forma
-3.0% appreciation · 2.39% rent growth · sell at horizon
- IRR
- -8.6%
- Equity multiple
- 0.68×
- Total profit
- $-17,563
- Equity at exit
- $29,672
- IRR
- 0.1%
- Equity multiple
- 1.00×
- Total profit
- $253
- Equity at exit
- $17,206
Cash invested: $55,720 (down + closing). Projections, not guarantees.
Landlord ↔ Tenant lean methodology
- Overall (STATE)
- 83 Strongly Landlord-Friendly
- State Nebraska
- 83 Strongly Landlord-Friendly · R+13
- County
- — inherits STATE
- City
- — inherits STATE
ZIP-level market 68503
- Rents YoY
- 2.4%
- Active inventory
- 59
- Price-to-rent
- 8.4×
Monthly cashflow live
- Estimated rent
- $1,974 medium interval (Pro) →
- Mortgage (P&I)
- −$1,044
- Tax from tax record
- −$184 /mo · $2,204/yr
- Insurance
- −$83
- HOA
- −$0
- Vacancy / Maint / Mgmt
- −$415
- Net cashflow
- $250
Break-even live
Sensitivity live
| Price | -10% $362 | -5% $306 | +0% $250 | +5% $193 | +10% $137 |
|---|---|---|---|---|---|
| Rent | -10% $94 | -5% $172 | +0% $250 | +5% $328 | +10% $406 |
| Rate | -1.0pp $350 | -0.5pp $300 | base $250 | +0.5pp $198 | +1.0pp $146 |
UW: 25.0% down · 7.5% · 30yr · 1.5% tax · 5.0% vac · 8.0% maint · 8.0% mgmt
Financing live
Cash to close
- Down payment
- $49,750
- Closing costs
- $5,970
- Reserves months
- —
- Total cash needed
- —
Loan-product check · same deal, 3 products live
Conventional
25% down · 7.5% · 30yr
- Down + closing
- —
- Monthly P&I
- —
- Monthly cashflow
- —
- DSCR
- —
- Eligible?
- —
Personal DTI + credit; lowest rate.
DSCR
20% down · 8.5% · 30yr
- Down + closing
- —
- Monthly P&I
- —
- Monthly cashflow
- —
- DSCR
- —
- Eligible?
- —
No personal income docs; deal must DSCR.
Hard money
10% down · 12.0% · 12mo
- Down + closing
- —
- Monthly P&I
- —
- Monthly cashflow
- —
- DSCR
- —
- Eligible?
- —
Short-term bridge; refi at stabilization.
Rent comps 1 comps
| Address | Beds | Baths | Sqft | Rent | $/sqft | DOM | Units | Dist |
|---|---|---|---|---|---|---|---|---|
| 2253 Orchard St Unit 1 Lincoln, NE | 4.0 | 3.0 | 2000 | $2,400 | $1.20 | 45d | 1 | 0.81mi |
Listing history 32 events
-
2026-06-21days on market $199,000 Active 88 DOM
-
2026-06-18days on market $199,000 Active 85 DOM
-
2026-06-17days on market $199,000 Active 84 DOM
-
2026-06-16days on market $199,000 Active 83 DOM
-
2026-06-15days on market $199,000 Active 82 DOM
-
2026-06-14days on market $199,000 Active 80 DOM
-
2026-06-10days on market $199,000 Active 77 DOM
-
2026-06-09days on market $199,000 Active 76 DOM
-
2026-06-08days on market $199,000 Active 75 DOM
-
2026-06-07days on market $199,000 Active 74 DOM
-
2026-06-05days on market $199,000 Active 71 DOM
-
2026-06-03days on market $199,000 Active 70 DOM
-
2026-06-02days on market $199,000 Active 69 DOM
-
2026-05-31days on market $199,000 Active 67 DOM
-
2026-05-30days on market $199,000 Active 66 DOM
-
2026-03-23$210,000 New 188-char remark
Show marketing remark (188 chars)
Investor special! Conversion duplex, 5 bed/ 1 bath unit rented at $1,400/month and a 1 bed/ 1 bath unit rented at $875/month. Conveniently located near East Campus with off street parking.
-
2024-06-06historical
-
2024-06-06historical
-
2024-03-12$199,900 New
-
2024-03-07$199,900 New
-
2023-12-29historical
-
2023-09-20price $194,900
-
2023-09-12$200,000 New
-
2023-09-12historical
-
2023-09-05$200,000 New
-
2023-09-05historical
-
2023-06-30$200,000 New
-
2022-06-30soldstatus $190,000
-
2022-06-28soldstatus $190,000 Sold
-
2022-06-10status Pending
-
2022-06-04price $199,500
-
2022-06-03$199,500,000 Active - New
ⓘ Source: listings_history table (triggers on properties + properties_extension) + one-shot
backfill from property_details.listing_events for pre-trigger history.
Tax reassessment forecast NE · Resets to sale price
- Current annual tax
- $2,204 · $184/mo
- Projected year-2 tax
- $3,443 · $287/mo
- Expected delta
- +$1,239/yr (+$103/mo · 56.2%)
ⓘ Screening estimate from a state-policy table — verify with the county assessor before closing.
Climate risk First Street
- Flood 1/10 Low FEMA zone X (unshaded) · 0% chance over 30 yrs
- Wildfire 1/10 Low
- Heat 3/10 Moderate 7 d/yr ≥104°F today · 16 d/yr by 30 yrs out
- Wind 2/10 Low
- Air quality 1/10 Low 0 unhealthy d/yr today · 0 by 30 yrs out
Nearby sold comps map
Loading sold comps map…
Walkable amenities ~0.75 mi
Loading nearby amenities…
Taxation est. · year 1
- Rental income
- $23,692
- − Mortgage interest
- −$11,147
- − Property taxes
- −$2,204
- − Insurance
- −$995
- − Repairs & maintenance
- −$1,895
- − Management
- −$1,895
- − Depreciation
- −$5,789
- Taxable loss
- −$233
- Est. tax savings @ 24.0%
- +$56
- After-tax cash flow
- $3,051/yr
For passive investors: Depreciation is non-cash, so a rental often shows a tax loss while cash-flowing — sheltering income. Rental losses are passive: they offset passive income freely, and up to $25,000/yr can offset ordinary (W-2) income if you actively participate and your MAGI is under $100k (phasing out to $0 by $150k); unused losses carry forward. On sale, claimed depreciation is recaptured at up to 25%, and gains may owe capital-gains tax (a 1031 exchange can defer both). Figures are a year-1 estimate at your 24.0% rate — not tax advice; consult a CPA.
Schools (NCES district)
- District
- Lincoln Public Schools
- NCES district ID
- 3172840
- Math proficiency
- 50% ▼ -6.00%
- Reading proficiency
- 53% ▼ -3.00%
- Median HH income
- $50,273
- Composite
- 44.05/100
- National rank
- #2880
- State rank
- #59 of 111 in NE
Livability — Lincoln
- Score
- 85/100
- State rank
- #5
- US rank
- #545
Category grades
Schools grade is shown separately in the Schools card above.
Census & demographics
- Census place
- Lincoln, NE
- County
- Lancaster County · 291,509 people
- City population
- 291,509
- Metro
- Lincoln, NE
- Population (ZIP)
- 15,867
- Household income
- $54,232
- Rent vs Own
- Severe rent burden
- 820.0
Population outlook (Lancaster County) Hauer SSP2
- Today (2025)
- 352,806 people
- By 2030
- 377,899 · +7.1%
- By 2040
- 428,582 · +21.5%
- By 2050
- 483,103 · +36.9%
- By 2075
- 632,390 · +79.2%
- By 2100
- 759,513 · +115.3%
Race, ethnicity, and origin ACS 2023
- Neighborhood character
- Diverse neighborhood (Simpson 0.62)
- Race & ethnicity
- White 59% Hispanic / Latino 12% Black 12% Two or more races 10% Asian 10%
- Hispanic origin (detail)
- Mexican 8%
- Common ancestry
- Lithuanian 2% Romanian 2% Portuguese 2%
- Foreign-born
- 19% · Canada, Vietnam, China
- Languages at home
- 73% English-only · Spanish 7% Other Indo-European 5% Vietnamese 5%
Political lean MEDSL · Lancaster
- 2024 margin
- Toss-up / Even · D 51.4% · R 47.1% · Other 1.5%
- 2008→2024 swing
- -0.7pp no change · 2008: 5.0pp · 2024: 4.3pp
- All cycles
- 2024: D+4.3 2020: D+7.8 2016: D+0.1 2012: R+1.0 2008: D+5.0
Not yet ingested
- Civics
- —
Market trends
- HPI YoY
- ▼ -145.46%
- Current HPI
- 260.3421
- Rent YoY
- ▲ 2.39%
- Metro
- Lincoln, NE
- State GDP YoY
- ▲ 0.68%
- F500 in state
- 2
Industry mix (Fortune 500 HQ in NE)
| Industry | F500 HQs | Revenue |
|---|---|---|
| Conglomerate | 1 | $371B |
|
||
Price history
-99.9% since first listed17 events — show timeline
- 2026-03-23 Listed $210,000 GPRMLS
- 2024-06-06 Listing Removed — GPRMLS
- 2024-06-06 Listing Removed — GPRMLS
- 2024-03-12 Listed $199,900 GPRMLS
- 2024-03-07 Listed $199,900 GPRMLS
- 2023-12-29 Listing Removed — GPRMLS
- 2023-09-20 Price Changed $194,900 GPRMLS
- 2023-09-12 Listing Removed — GPRMLS
- 2023-09-12 Listed $200,000 GPRMLS
- 2023-09-05 Listing Removed — GPRMLS
- 2023-09-05 Listed $200,000 GPRMLS
- 2023-06-30 Listed $200,000 GPRMLS
- 2022-06-30 Sold (Public Records) $190,000 Public Records
- 2022-06-28 Sold (MLS) $190,000 GPRMLS
- 2022-06-10 Pending — GPRMLS
- 2022-06-04 Price Changed $199,500 GPRMLS
- 2022-06-03 Listed $199,500,000 GPRMLS
Property tax history
+3.8%/yrLatest (2025): $2,204 · -8.0% YoY. Source: county tax records.
Cash-flow waterfall
monthlySold comps — $/sqft
last 12 mo · ≤1 miLoading sold comps…