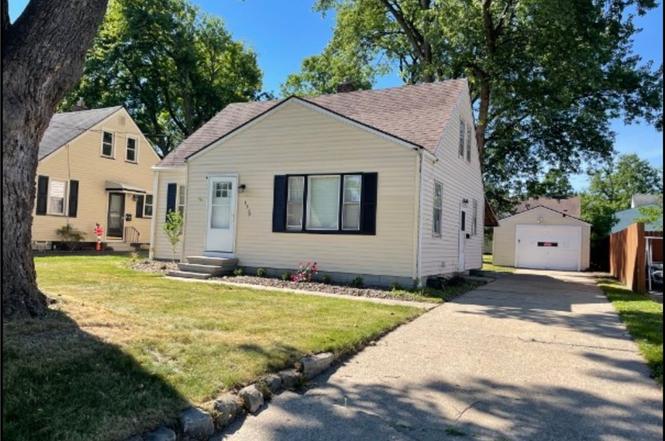
1539 Weston Ave · Youngstown, OH
Flood risk 1/10 · Minimal
- FEMA flood zone
- X (unshaded)
- Chance of flooding over 30 yrs
- 0.0%
- Est. flood insurance / yr
- $473 – $860
Fire risk 1/10 · Minimal
- Est. fire insurance / yr
- $713 – $1,323
Heat risk 3/10 · Minor
- Hot days now (above 97°F)
- 7 days/yr
- Hot days in 30 yrs
- 17 days/yr
Wind risk 1/10 · Minimal
- Chance of severe wind over 30 yrs
- —
Air-quality risk 3/10 · Minor
- Unhealthy air days now
- 1 days/yr
- Unhealthy air days in 30 yrs
- 4 days/yr
Risk factors via First Street. Map © Google.
Why this score? — see what drove the C grade
The composite is a weighted blend of 9 inputs, each scored 0–100. Each bar is that input's sub-score; the figure is the points it added to the 100-point composite (weight × sub-score).
- Cash flow +25.4/30.0
- ARV discount +8.6/15.0
- DSCR +8.4/10.0
- 1% rule +5.8/10.0
- Livability +4.0/5.0
- Rent growth +2.5/5.0
- Condition / age +2.5/5.0
- Schools +0.9/10.0
- Appreciation +0.0/10.0
$130,000
🖨 Deal sheet (PDF) 📄 Offer letter ✓ Due diligence
Listing remarks MLS
Almost Perfect! Truly in move-in condition. This spotless cape cod offers the following updates in the last 8 years: New vinyl siding and roof (tear off), new furnace (2 yrs), hot water heater, updated kitchen with new countertops, sink, floor & hardware, first floor bath completely renovated, new fixtures, all ceilings changed to smooth texture, electric box certified, installed new shower, sink & commode in basement, all outlets & switches replaced, interior painting throughout, new carpet in upstairs dormitory bedroom, two new exterior doors, new cement walkway & steps and new down spouts run to the street. First one in gets to buy it!! Located on a quiet dead end street.
Key facts
- Updated bath
- Eat in kitchen
- New flooring
Tags
Property features AI
Exterior
- Parking: Detached garage (1 car)
- Utilities: Public water; Public sewer
- Home design: Two-story home; Updated/remodeled condition; Block foundation
- Construction: Vinyl siding; Asphalt/fiberglass roof; Built per public records
- Exterior features: Covered porch/patio; Shed(s); Landscaped lot; Has view
Interior
- Kitchen: Dishwasher; Refrigerator
- Bedrooms: 2 bedrooms on the main level
- Bathrooms: 1 full bathroom (main level)
- Heating & cooling: Forced air heating (gas); Central electric air conditioning
- Interior features: Eat-in kitchen; See remarks; Double pane windows; Full basement
- Laundry & utility: Laundry in basement
Neighborhood map
What this means for you Summary
Snapshot
- This is a 3-bed/1.0-bath single-family listed at $130k.
Deal economics
- At list price, monthly cash flow is $299 ($4k/yr) — positive.
- The deal already cash-flows at list — no discount required.
- Meets the 1% rule at list price ($1k rent vs $130k).
- Cap rate 9.1% vs local median 7.0% in Youngstown — meaningfully above typical; check what's discounted (condition, days-on-market, listing class) to confirm the premium yield is real.
Location & tenants
- Location reads 81/100 on livability (#99 in OH, #1,506 nationally) — a professional / high-income tenant draw. Strengths: amenities A+, commute A+, cost of living A+; Watch: crime F, employment F.
- Youngstown City (urban): math 8% / reading 17% proficiency, ranked #649 of 656 in OH (top 99%) — low school quality limits family demand, transient renter base, plan for 1-2y turnover; 88% free/reduced lunch — lower-income household profile, screen leases tightly.
- Market conditions: 156 active listings in the ZIP; 9 comparable units currently listed for rent nearby; rentals at typical pace (median 23d on market — plan ~3-4 weeks tenant-placement turnaround); 44% of comp listings sitting > 30 days — soft ceiling on asking rent; solid renter incomes; 147 units permitted in Mahoning County in 2024 (0 in 5+ unit buildings).
Forward outlook
- Local home prices are declining (-3.0%/yr); year-one equity from $899 of loan paydown is wiped out by about $4k of value loss. Plan a longer hold.
- Mahoning County population projected at -14% by 2050 — secular population decline; favor cash flow + early exit over multi-decade hold.
Negotiation context
- Only 6 days on market — expect competitive offers; lowballing is unlikely to land.
- 3 sale attempts since 23y ago; this cycle's ask is 8% above the opening price — seller raised mid-cycle; expect resistance to lowballs.
- Current owner paid $43k; list at $130k implies a 202% gain — meaningful room to come down on a strong offer.
Risks & watch-outs
- Watch-outs: built in 1952 — expect roof / HVAC / electrical / plumbing capex.
Questions for the listing agent
- Built in 1952 — when were the roof, HVAC, electrical panel, plumbing, and water heater last replaced?
- Is there a deadline driving the sale (1031 exchange, divorce, estate, relocation)? That informs how much negotiation room exists.
- Crime grade is F in this area — have there been break-ins, vandalism, or insurance claims at this property in the last 3 years? What carrier currently insures it and at what premium?
- What's the average days-on-market for RENTAL listings here right now (not sales)? A rising rental-DOM trend means longer vacancies and softer asking-rent achievability than the comps imply.
- What's the recent tenant-quality profile in this submarket — average credit score on applications, eviction rate, late-payment / NSF rate, and stable-employment percentage? A property-management company in the area should have these aggregated.
- How much new for-sale + rental construction is in the pipeline within 1–3 miles? Heavy new supply typically softens prices + rents 12–24 months out; constrained supply supports both.
Investment metrics
- 1% rule
- 1.08% ✓
- Cap rate
- 9.05%
- Cash-on-cash
- 9.85%
- DSCR
- 1.44
- GRM
- 7.7
CMA / ARV
- ARV (on-the-fly)
- $133,320
- Comps found
- 12
Show comp detail 12 sales within ~0.75 mi
| Address | Dist | Beds/Ba | Sqft | Sold | Price | $/sf | Match |
|---|---|---|---|---|---|---|---|
| 1562 Medford Ave | 0.05mi | 3/1.0 | 1,170 (-4%) | 3mo | $129,156 | $110 | 89 |
| 1633 Everett Ave | 0.17mi | 3/1.0 | 1,202 (-1%) | 5mo | $125,000 | $104 | 86 |
| 1925 Weston Ave | 0.36mi | 3/1.0 | 1,227 (+1%) | 1mo | $89,000 | $73 | 80 |
| 1646 Everett Ave | 0.21mi | 4/1.0 (+1) | 1,152 (-5%) | 3mo | $100,000 | $87 | 74 |
| 3551 Shirley Rd | 0.37mi | 3/2.0 | 1,341 (+11%) | 2mo | $142,000 | $106 | 59 |
| 1122 Inverness Ave | 0.54mi | 3/2.0 | 1,309 (+8%) | 4mo | $126,900 | $97 | 54 |
| 2002 Bancroft Ave | 0.53mi | 3/2.0 | 1,080 (-11%) | 4mo | $131,500 | $122 | 50 |
| 1210 Aberdeen Ave | 0.70mi | 3/2.0 | 1,316 (+9%) | 1mo | $177,000 | $134 | 48 |
| 1208 Aberdeen Ave | 0.70mi | 3/2.0 | 1,316 (+9%) | 2mo | $175,000 | $133 | 47 |
| 1913 Country Club Ave | 0.70mi | 3/2.0 | 1,092 (-10%) | 0mo | $78,000 | $71 | 47 |
| 1928 Palo Verde Dr | 0.73mi | 3/1.0 | 1,074 (-11%) | 3mo | $130,000 | $121 | 45 |
| 1720 Sequoya Dr | 0.69mi | 3/2.0 | 1,044 (-14%) | 4mo | $168,000 | $161 | 38 |
Match score weights: distance 35% · size 25% · config 20% · recency 20%. Top-matched comps best support the ARV.
Projected returns pro-forma
-3.0% appreciation · 3.0% rent growth · sell at horizon
- IRR
- -1.5%
- Equity multiple
- 0.94×
- Total profit
- $-2,062
- Equity at exit
- $19,383
- IRR
- 8.2%
- Equity multiple
- 1.62×
- Total profit
- $22,584
- Equity at exit
- $11,240
Cash invested: $36,400 (down + closing). Projections, not guarantees.
Landlord ↔ Tenant lean methodology
- Overall (STATE)
- 73 Landlord-Friendly
- State Ohio
- 73 Landlord-Friendly · R+6
- County
- — inherits STATE
- City
- — inherits STATE
ZIP-level market 44514
- Home prices YoY
- -23.8%
- Active inventory
- 156
- Price-to-rent
- 7.7×
Monthly cashflow live
- Estimated rent
- $1,405 high interval (Pro) →
- Mortgage (P&I)
- −$682
- Tax from tax record
- −$75 /mo · $899/yr
- Insurance
- −$54
- HOA
- −$0
- Vacancy / Maint / Mgmt
- −$295
- Net cashflow
- $299
Break-even live
Sensitivity live
| Price | -10% $372 | -5% $336 | +0% $299 | +5% $262 | +10% $225 |
|---|---|---|---|---|---|
| Rent | -10% $188 | -5% $243 | +0% $299 | +5% $354 | +10% $410 |
| Rate | -1.0pp $364 | -0.5pp $332 | base $299 | +0.5pp $265 | +1.0pp $231 |
UW: 25.0% down · 7.5% · 30yr · 1.5% tax · 5.0% vac · 8.0% maint · 8.0% mgmt
Financing live
Cash to close
- Down payment
- $32,500
- Closing costs
- $3,900
- Reserves months
- —
- Total cash needed
- —
Loan-product check · same deal, 3 products live
Conventional
25% down · 7.5% · 30yr
- Down + closing
- —
- Monthly P&I
- —
- Monthly cashflow
- —
- DSCR
- —
- Eligible?
- —
Personal DTI + credit; lowest rate.
DSCR
20% down · 8.5% · 30yr
- Down + closing
- —
- Monthly P&I
- —
- Monthly cashflow
- —
- DSCR
- —
- Eligible?
- —
No personal income docs; deal must DSCR.
Hard money
10% down · 12.0% · 12mo
- Down + closing
- —
- Monthly P&I
- —
- Monthly cashflow
- —
- DSCR
- —
- Eligible?
- —
Short-term bridge; refi at stabilization.
Rent comps 9 comps
| Address | Beds | Baths | Sqft | Rent | $/sqft | DOM | Units | Dist |
|---|---|---|---|---|---|---|---|---|
| 1803 Pointview Ave Youngstown, OH | 2.0 | 1.0 | 950 | $1,000 | $1.05 | 45d | 1 | 0.41mi |
| 1914 S Heights Ave Youngstown, OH | 3.0 | 1.0 | 1115 | $1,950 | $1.75 | 45d | 1 | 0.45mi |
| 3446 Ambert Ave Youngstown, OH | 4.0 | 1.0 | 1100 | $1,250 | $1.14 | 15d | 1 | 0.54mi |
| 610 Elm St Struthers, OH | 3.0 | 1.0 | 1050 | $1,500 | $1.43 | 14d | 1 | 0.74mi |
| 2523 E Midlothian Blvd Apt 5 Struthers, OH | 2.0 | 1.0 | 750 | $800 | $1.07 | 15d | 1 | 0.95mi |
| 512 E Philadelphia Ave Unit 1 Youngstown, OH | 2.0 | 1.0 | 1200 | $899 | $0.75 | 22d | 1 | 1.26mi |
| 929 Cook Ave Unit 1 Youngstown, OH | 2.0 | 1.0 | 700 | $850 | $1.21 | 45d | 1 | 1.27mi |
| 851 Cook Ave Unit 4 Youngstown, OH | 2.0 | 1.0 | 1050 | $800 | $0.76 | 45d | 1 | 1.33mi |
| 236 Hilton Ave Youngstown, OH | 4.0 | 1.5 | 1488 | $1,195 | $0.80 | 22d | 1 | 1.33mi |
Listing history 6 events
-
2026-06-16status $130,000 Pending 6 DOM
-
2026-06-16days on market $130,000 Active 6 DOM
-
2026-06-15days on market $130,000 Active 5 DOM
-
2026-06-14days on market $130,000 Active 3 DOM
-
2026-06-13remarks 380-char remark
-
2026-06-13$130,000 Active 2 DOM
ⓘ Source: listings_history table (triggers on properties + properties_extension) + one-shot
backfill from property_details.listing_events for pre-trigger history.
Tax reassessment forecast OH · Partial reset (capped growth)
- Current annual tax
- $899 · $75/mo
- Projected year-2 tax
- $1,464 · $122/mo
- Expected delta
- +$564/yr (+$47/mo · 62.7%)
ⓘ Screening estimate from a state-policy table — verify with the county assessor before closing.
Climate risk First Street
- Flood 1/10 Low FEMA zone X (unshaded) · 0% chance over 30 yrs
- Wildfire 1/10 Low
- Heat 3/10 Moderate 7 d/yr ≥97°F today · 17 d/yr by 30 yrs out
- Wind 1/10 Low
- Air quality 3/10 Moderate 1 unhealthy d/yr today · 4 by 30 yrs out
Nearby sold comps map
Loading sold comps map…
Walkable amenities ~0.75 mi
Loading nearby amenities…
Taxation est. · year 1
- Rental income
- $16,857
- − Mortgage interest
- −$7,282
- − Property taxes
- −$899
- − Insurance
- −$650
- − Repairs & maintenance
- −$1,349
- − Management
- −$1,349
- − Depreciation
- −$3,782
- Taxable income
- $1,546
- Est. tax owed @ 24.0%
- −$371
- After-tax cash flow
- $3,216/yr
For passive investors: Depreciation is non-cash, so a rental often shows a tax loss while cash-flowing — sheltering income. Rental losses are passive: they offset passive income freely, and up to $25,000/yr can offset ordinary (W-2) income if you actively participate and your MAGI is under $100k (phasing out to $0 by $150k); unused losses carry forward. On sale, claimed depreciation is recaptured at up to 25%, and gains may owe capital-gains tax (a 1031 exchange can defer both). Figures are a year-1 estimate at your 24.0% rate — not tax advice; consult a CPA.
Schools (NCES district)
- District
- Youngstown City
- NCES district ID
- 3904516
- Math proficiency
- 8% ▼ -15.00%
- Reading proficiency
- 17% ▼ -10.00%
- Median HH income
- $25,257
- Composite
- 9.29/100
- National rank
- #9858
- State rank
- #649 of 656 in OH
Livability — Youngstown
- Score
- 81/100
- State rank
- #99
- US rank
- #1506
Category grades
Schools grade is shown separately in the Schools card above.
Census & demographics
- Census place
- Youngstown, OH
- County
- Mahoning County · 84,956 people
- City population
- 28,503
- Metro
- Youngstown-Warren-Boardman, OH-PA
- Population (ZIP)
- 23,917
- Household income
- $79,808
- Rent vs Own
- Severe rent burden
- 411.0
Population outlook (Mahoning County) Hauer SSP2
- Today (2025)
- 223,932 people
- By 2030
- 218,387 · -2.5%
- By 2040
- 205,367 · -8.3%
- By 2050
- 193,606 · -13.5%
- By 2075
- 173,694 · -22.4%
- By 2100
- 151,147 · -32.5%
Race, ethnicity, and origin ACS 2023
- Neighborhood character
- Predominantly White (91%)
- Race & ethnicity
- White 91% Two or more races 4% Hispanic / Latino 3% Black 2%
- Common ancestry
- Romanian 6% Slovak 2% Lithuanian 2%
- Foreign-born
- 2% · Canada
- Languages at home
- 95% English-only · Other Indo-European 2% Spanish 2%
Political lean MEDSL · Mahoning
- 2024 margin
- Lean R (+9.4) · D 44.9% · R 54.4%
- 2008→2024 swing
- -36.1pp toward R · 2008: 26.6pp · 2024: -9.4pp
- All cycles
- 2024: R+9.4 2020: R+1.9 2016: D+3.0 2012: D+27.7 2008: D+26.6
Not yet ingested
- Civics
- —
Market trends
- HPI YoY
- ▼ -65.78%
- Current HPI
- 210.5511
- Rent YoY
- —
- Metro
- Youngstown-Warren-Boardman, OH-PA
- State GDP YoY
- ▲ 1.98%
- F500 in state
- 48
Industry mix (Fortune 500 HQ in OH)
| Industry | F500 HQs | Revenue |
|---|---|---|
| Insurance | 3 | $145B |
|
||
| Industrial Machinery | 3 | $49B |
|
||
| Financial Services | 3 | $24B |
|
||
| Consumer Goods | 2 | $93B |
|
||
| Aerospace / Defense | 2 | $47B |
|
||
| Utilities | 2 | $33B |
|
||
Price history
+234.2% since first listed7 events — show timeline
- 2026-06-10 Price Changed $130,000 MLSNOW
- 2026-06-09 Listed $120,000 MLSNOW
- 2012-06-29 Sold (MLS) $43,000 MLSNOW
- 2012-04-21 Listed $49,900 MLSNOW
- 2003-11-28 Sold (MLS) $29,250 MLSNOW
- 2003-11-24 Sold (Public Records) $29,300 Public Records
- 2003-07-21 Listed $38,900 MLSNOW
Property tax history
-2.0%/yrLatest (2025): $899 · -11.9% YoY. Source: county tax records.
Cash-flow waterfall
monthlySold comps — $/sqft
last 12 mo · ≤1 miLoading sold comps…