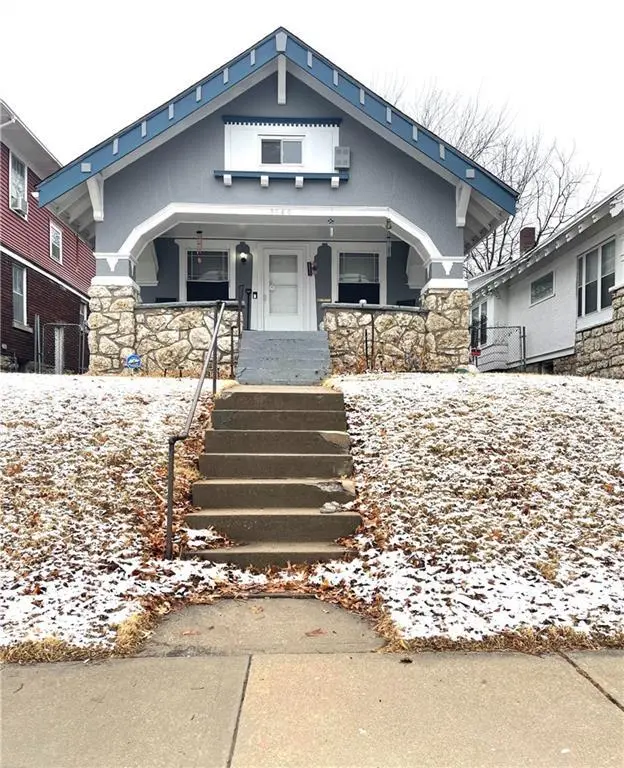
3840 College Ave · Kansas City, MO
Flood risk 1/10 · Minimal
- FEMA flood zone
- X (unshaded)
- Chance of flooding over 30 yrs
- 0.0%
- Est. flood insurance / yr
- $473 – $860
Fire risk 1/10 · Minimal
- Est. fire insurance / yr
- $1,054 – $1,958
Heat risk 4/10 · Minor
- Hot days now (above 107°F)
- 7 days/yr
- Hot days in 30 yrs
- 17 days/yr
Wind risk 2/10 · Minimal
- Chance of severe wind over 30 yrs
- —
Air-quality risk 3/10 · Minor
- Unhealthy air days now
- 2 days/yr
- Unhealthy air days in 30 yrs
- 3 days/yr
Risk factors via First Street. Map © Google.
Why this score? — see what drove the D grade
The composite is a weighted blend of 9 inputs, each scored 0–100. Each bar is that input's sub-score; the figure is the points it added to the 100-point composite (weight × sub-score).
- Cash flow +13.9/30.0
- Appreciation +10.0/10.0
- DSCR +4.2/10.0
- Livability +3.9/5.0
- Rent growth +3.7/5.0
- 1% rule +2.5/10.0
- Condition / age +2.5/5.0
- Schools +1.5/10.0
- ARV discount +0.0/15.0
$179,999
🖨 Deal sheet (PDF) 📄 Offer letter ✓ Due diligence
Listing remarks MLS
Charming and well-maintained property located at 3840 College Ave, offering a great opportunity for homeowners or investors alike. This home features a functional layout with comfortable living spaces, abundant natural light, and thoughtful updates throughout. The kitchen provides ample cabinetry and workspace, while the living and dining areas create an inviting atmosphere for everyday living and entertaining. Bedrooms are generously sized, and the property offers a spacious yard perfect for outdoor activities, gardening, or future enhancements. The home is equipped with a very good security system, providing added peace of mind. Recent improvements include a remodeled bathroom and a patio deck, perfect for relaxing or hosting gatherings. Conveniently situated near local amenities, schools, parks, and major roadways, this home combines comfort, location, and potential. A fantastic opportunity to own a property in an established neighborhood
Key facts
- 4,394 sq ft lot
- Built 1917
- Listed 79 days
Neighborhood map
What this means for you Summary
Snapshot
- This is a 3-bed/1.0-bath single-family listed at $180k.
Deal economics
- At list price, monthly cash flow is $21 ($255/yr) — positive.
- The deal already cash-flows at list — no discount required.
- To meet the 1% rule (rent ≥ 1% of price), the offer needs to be $136k (24.6% below list).
- Recommended offer: $136k (24.6% below list) — sets the bar for 1% rule.
- Cap rate 6.4% vs local median 3.9% in Kansas City — top-decile yield for the area; either an underpriced asset or a hidden risk that comps aren't pricing in. Stress-test before assuming the spread holds.
Location & tenants
- Location reads 78/100 on livability (#28 in MO, #2,671 nationally) — a middle-class / working-renter tenant base. Strengths: amenities A+, commute A+, cost of living A+; Watch: schools C-, crime F.
- Kansas City 33 (urban): math 12% / reading 24% proficiency, ranked #308 of 324 in MO (top 95%) — low school quality limits family demand, transient renter base, plan for 1-2y turnover; 75% free/reduced lunch — lower-income household profile, screen leases tightly.
- Market conditions: Rents rising fast (+4.7%/yr); 87 active listings in the ZIP; 40 comparable units currently listed for rent nearby; rentals at typical pace (median 25d on market — plan ~3-4 weeks tenant-placement turnaround); lower-income renter base — watch delinquency; 4,002 units permitted in Jackson County in 2024 (2,271 in 5+ unit buildings).
- At $1,358/mo this rent would consume 45% of the median local household income ($36k/yr) (locally 946% of renters already pay >50% of income on rent) — very limited rent-growth headroom before tenants either downsize or default.
Forward outlook
- In year one you build about $19k of equity ($1k loan paydown + $18k appreciation (10.0% local appreciation)).
- Jackson County population projected at +4% by 2050 — modest demand growth; plan on rents tracking national, not racing it.
- At projected returns (10.0% appreciation + 4.7% rent growth), your $50k cash investment doubles in ~3 years — after that, you're playing with house money.
- By year 2, paydown + projected appreciation supports a ~$31k cash-out refi (75% LTV) — recoverable capital for the next deal without selling this one.
Negotiation context
- It's been on market 80 days — a 6% lower offer ($169k) is reasonable based on typical stale-listing flexibility.
- 2 sale attempts since 6y ago; this cycle's ask is 102% above the opening price — seller raised mid-cycle; expect resistance to lowballs.
Risks & watch-outs
- Watch-outs: built in 1917 — expect roof / HVAC / electrical / plumbing capex.
Questions for the listing agent
- It's been on market 80 days. Have you received any prior offers? Is the seller open to a 25% concession, seller financing, or rate buy-down credit?
- Built in 1917 — when were the roof, HVAC, electrical panel, plumbing, and water heater last replaced?
- Why hasn't it sold? Are there any deal-killer items the seller is aware of (foundation, flood, title, zoning, code violations)?
- Is there a deadline driving the sale (1031 exchange, divorce, estate, relocation)? That informs how much negotiation room exists.
- Crime grade is F in this area — have there been break-ins, vandalism, or insurance claims at this property in the last 3 years? What carrier currently insures it and at what premium?
- The area grade is low — what's the realistic commute time and amenity access for the typical tenant pool here? Any planned neighborhood developments (good or bad) we should know about?
- What's the average days-on-market for RENTAL listings here right now (not sales)? A rising rental-DOM trend means longer vacancies and softer asking-rent achievability than the comps imply.
- What's the recent tenant-quality profile in this submarket — average credit score on applications, eviction rate, late-payment / NSF rate, and stable-employment percentage? A property-management company in the area should have these aggregated.
- How much new for-sale + rental construction is in the pipeline within 1–3 miles? Heavy new supply typically softens prices + rents 12–24 months out; constrained supply supports both.
Investment metrics
- 1% rule
- 0.75% ✗
- Cap rate
- 6.43%
- Cash-on-cash
- 0.51%
- DSCR
- 1.02
- GRM
- 11.0
CMA / ARV
- ARV (median comp)
- $141,896
- List price
- $179,999
- Delta
- 26.85%
- Verdict
- OVERPRICED
- Comps
- 20 within 1.0 mi
Show comp detail 12 sales within ~0.75 mi
| Address | Dist | Beds/Ba | Sqft | Sold | Price | $/sf | Match |
|---|---|---|---|---|---|---|---|
| 3920 S Benton Ave | 0.26mi | 2/1.5 (-1) | 1,160 (-2%) | 5mo | $65,000 | $56 | 74 |
| 3838 S Benton Ave | 0.25mi | 3/1.0 | 1,066 (-10%) | 3mo | $90,000 | $84 | 70 |
| 2809 E 39th St | 0.27mi | 3/1.0 | 1,279 (+8%) | 6mo | $114,900 | $90 | 69 |
| 3422 Askew Ave | 0.57mi | 3/1.0 | 1,226 (+4%) | 4mo | $114,900 | $94 | 64 |
| 3536 College Ave | 0.39mi | 3/1.0 | 1,086 (-8%) | 6mo | $96,000 | $88 | 63 |
| 3711 Bellefontaine Ave | 0.22mi | 3/1.0 | 1,007 (-15%) | 5mo | $120,000 | $119 | 61 |
| 3936 Wabash Ave | 0.51mi | 3/2.0 | 1,099 (-7%) | 2mo | $89,900 | $82 | 59 |
| 4128 Agnes Ave | 0.39mi | 2/1.0 (-1) | 1,098 (-7%) | 7mo | $42,000 | $38 | 59 |
| 4427 Agnes Ave | 0.73mi | 3/1.0 | 1,100 (-7%) | 2mo | $69,900 | $64 | 52 |
| 3304 Askew Ave | 0.73mi | 3/1.0 | 1,066 (-10%) | 3mo | $45,000 | $42 | 47 |
| 4338 Indiana Ave | 0.64mi | 2/1.0 (-1) | 1,012 (-14%) | 0mo | $150,000 | $148 | 41 |
| 3915 Brooklyn Ave | 0.66mi | 2/1.0 (-1) | 1,020 (-14%) | 8mo | $45,000 | $44 | 35 |
Match score weights: distance 35% · size 25% · config 20% · recency 20%. Top-matched comps best support the ARV.
Projected returns pro-forma
10.0% appreciation · 4.65% rent growth · sell at horizon
- IRR
- 25.1%
- Equity multiple
- 3.02×
- Total profit
- $101,577
- Equity at exit
- $162,157
- IRR
- 22.5%
- Equity multiple
- 7.01×
- Total profit
- $302,841
- Equity at exit
- $349,698
Cash invested: $50,400 (down + closing). Projections, not guarantees.
Landlord ↔ Tenant lean methodology
- Overall (STATE)
- 81 Strongly Landlord-Friendly
- State Missouri
- 81 Strongly Landlord-Friendly · R+10
- County
- — inherits STATE
- City
- — inherits STATE
ZIP-level market 64128
- Home prices YoY
- 21.6%
- Rents YoY
- 4.7%
- Active inventory
- 87
- Price-to-rent
- 11.0×
Monthly cashflow live
- Estimated rent
- $1,358 high interval (Pro) →
- Mortgage (P&I)
- −$944
- Tax from tax record
- −$33 /mo · $390/yr
- Insurance
- −$75
- HOA
- −$0
- Vacancy / Maint / Mgmt
- −$285
- Net cashflow
- $21
Break-even live
Sensitivity live
| Price | -10% $123 | -5% $72 | +0% $21 | +5% $-30 | +10% $-296 |
|---|---|---|---|---|---|
| Rent | -10% $-86 | -5% $-32 | +0% $21 | +5% $75 | +10% $128 |
| Rate | -1.0pp $112 | -0.5pp $67 | base $21 | +0.5pp $-25 | +1.0pp $-73 |
UW: 25.0% down · 7.5% · 30yr · 1.5% tax · 5.0% vac · 8.0% maint · 8.0% mgmt
Financing live
Cash to close
- Down payment
- $45,000
- Closing costs
- $5,400
- Reserves months
- —
- Total cash needed
- —
Loan-product check · same deal, 3 products live
Conventional
25% down · 7.5% · 30yr
- Down + closing
- —
- Monthly P&I
- —
- Monthly cashflow
- —
- DSCR
- —
- Eligible?
- —
Personal DTI + credit; lowest rate.
DSCR
20% down · 8.5% · 30yr
- Down + closing
- —
- Monthly P&I
- —
- Monthly cashflow
- —
- DSCR
- —
- Eligible?
- —
No personal income docs; deal must DSCR.
Hard money
10% down · 12.0% · 12mo
- Down + closing
- —
- Monthly P&I
- —
- Monthly cashflow
- —
- DSCR
- —
- Eligible?
- —
Short-term bridge; refi at stabilization.
Rent comps 40 comps
| Address | Beds | Baths | Sqft | Rent | $/sqft | DOM | Units | Dist |
|---|---|---|---|---|---|---|---|---|
| 3818 Indiana Ave Kansas City, MO | 3.0 | 1.5 | 1223 | $1,147 | $0.94 | 44d | 1 | 0.11mi |
| 3840 Bellefontaine Ave Kansas City, MO | 3.0 | 1.0 | 1500 | $1,500 | $1.00 | 17d | 1 | 0.12mi |
| 4005 Bales Ave Kansas City, MO | 2.0 | 1.0 | 792 | $1,050 | $1.33 | 44d | 1 | 0.21mi |
| 3739 Bales Ave Kansas City, MO | 3.0 | 2.0 | 1400 | $1,575 | $1.12 | 24d | 1 | 0.22mi |
| 3817 S Benton Ave Kansas City, MO | 4.0 | 1.5 | 1380 | $1,650 | $1.20 | 24d | 1 | 0.23mi |
| 4116 Bellefontaine Ave Kansas City, MO | 3.0 | 1.0 | 1234 | $1,000 | $0.81 | 24d | 1 | 0.30mi |
| 3630 Agnes Ave Kansas City, MO | 3.0 | 2.0 | 1448 | $1,500 | $1.04 | 11d | 1 | 0.34mi |
| 4144 College Ave Kansas City, MO | 3.0 | 1.0 | 1108 | $1,095 | $0.99 | 24d | 1 | 0.34mi |
| 3713 Cleveland Ave Kansas City, MO | 4.0 | 1.0 | 1256 | $1,250 | $1.00 | 17d | 1 | 0.41mi |
| 3524 Bellefontaine Ave Kansas City, MO | 3.0 | 1.0 | 1228 | $1,350 | $1.10 | 44d | 1 | 0.45mi |
| 3902 Wabash Ave Kansas City, MO | 4.0 | 2.0 | 1400 | $1,850 | $1.32 | 44d | 1 | 0.48mi |
| 4028 Myrtle Ave Kansas City, MO | 3.0 | 1.0 | 1100 | $1,490 | $1.35 | 44d | 1 | 0.48mi |
| 4216 Cleveland Ave Kansas City, MO | 2.0 | 1.0 | 780 | $1,125 | $1.44 | 17d | 1 | 0.51mi |
| 4309 College Ave Kansas City, MO | 3.0 | 2.0 | 1040 | $1,550 | $1.49 | 17d | 1 | 0.51mi |
| 3841 Olive St Kansas City, MO | 2.0 | 1.0 | 792 | $985 | $1.24 | 15d | 1 | 0.52mi |
| 3710 Wabash Ave Unit 2S Kansas City, MO | 2.0 | 1.0 | 875 | $850 | $0.97 | 24d | 1 | 0.55mi |
| 4107 Olive St Kansas City, MO | 3.0 | 1.5 | 1271 | $1,578 | $1.24 | 8d | 1 | 0.57mi |
| 2305 E 41st St Kansas City, MO | 2.0 | 1.0 | 750 | $1,000 | $1.33 | 8d | 1 | 0.63mi |
| 4014 Park Ave Kansas City, MO | 3.0 | 2.0 | 1271 | $1,273 | $1.00 | 44d | 1 | 0.63mi |
| 3346 Agnes Ave Kansas City, MO | 3.0 | 1.0 | 1400 | $1,200 | $0.86 | 8d | 1 | 0.67mi |
| 4427 Agnes Ave Kansas City, MO | 3.0 | 1.0 | 1100 | $1,350 | $1.23 | 17d | 1 | 0.70mi |
| 3330 Agnes Ave Kansas City, MO | 3.0 | 1.0 | 1000 | $1,410 | $1.41 | 44d | 1 | 0.71mi |
| 3310 College Ave Kansas City, MO | 3.0 | 1.0 | 874 | $995 | $1.14 | 44d | 1 | 0.73mi |
| 3304 Agnes Ave Unit Downstairs Kansas City, MO | 3.0 | 1.0 | 1150 | $1,095 | $0.95 | 44d | 1 | 0.76mi |
| 3736 Cypress Ave Kansas City, MO | 3.0 | 1.0 | 1100 | $1,200 | $1.09 | 8d | 1 | 0.77mi |
| 3305 Askew Ave Kansas City, MO | 3.0 | 1.5 | 1428 | $1,450 | $1.02 | 24d | 1 | 0.78mi |
| 3437 Jackson Ave Kansas City, MO | 2.0 | 1.0 | 700 | $1,150 | $1.64 | 17d | 1 | 0.81mi |
| 3332 Norton Ave Kansas City, MO | 3.0 | 1.0 | 1272 | $1,350 | $1.06 | 44d | 1 | 0.84mi |
| 4534 S Benton Ave Kansas City, MO | 2.0 | 1.0 | 912 | $1,045 | $1.15 | 17d | 1 | 0.86mi |
| 2002 E 35th St Kansas City, MO | 3.0 | 2.0 | 1426 | $1,295 | $0.91 | 8d | 1 | 0.93mi |
| 3233 Park Ave Unit 1 Kansas City, MO | 2.0 | 1.0 | 950 | $1,075 | $1.13 | 44d | 1 | 0.97mi |
| 3233 Park Ave Unit 2 Kansas City, MO | 2.0 | 1.0 | 950 | $1,000 | $1.05 | 24d | 1 | 0.97mi |
| 3414 Elmwood Ave Kansas City, MO | 4.0 | 1.0 | 1109 | $1,300 | $1.17 | 17d | 1 | 1.01mi |
| 4902 E 39th St Kansas City, MO | 2.0 | 1.0 | 820 | $1,300 | $1.59 | 17d | 1 | 1.03mi |
| 3609 Wayne Ave Kansas City, MO | 3.0 | 1.5 | 1118 | $1,900 | $1.70 | 24d | 1 | 1.08mi |
| 4900 E 41st Ter Kansas City, MO | 3.0 | 2.0 | 1270 | $1,500 | $1.18 | 17d | 1 | 1.08mi |
| 2120 Linwood Blvd Kansas City, MO | 3.0 | 1.0 | 1326 | $1,400 | $1.06 | 44d | 1 | 1.13mi |
| 4209 Flora Ave Kansas City, MO | 2.0 | 1.0 | 778 | $1,200 | $1.54 | 17d | 1 | 1.15mi |
| 3220 E 30th St Unit 1A Kansas City, MO | 2.0 | 1.0 | 1214 | $950 | $0.78 | 44d | 1 | 1.15mi |
| 4401 Wayne Ave Kansas City, MO | 2.0 | 1.5 | 955 | $1,300 | $1.36 | 24d | 1 | 1.19mi |
Listing history 25 events
-
2026-06-21days on market $179,999 Coming Soon 80 DOM
-
2026-06-18days on market $179,999 Coming Soon 77 DOM
-
2026-06-17days on market $179,999 Coming Soon 76 DOM
-
2026-06-16days on market $179,999 Coming Soon 75 DOM
-
2026-06-15days on market $179,999 Coming Soon 74 DOM
-
2026-06-13days on market $179,999 Coming Soon 72 DOM
-
2026-06-09days on market $179,999 Coming Soon 68 DOM
-
2026-06-08days on market $179,999 Coming Soon 67 DOM
-
2026-06-07days on market $179,999 Coming Soon 66 DOM
-
2026-06-05days on market $179,999 Coming Soon 63 DOM
-
2026-06-03days on market $179,999 Coming Soon 62 DOM
-
2026-06-02days on market $179,999 Coming Soon 61 DOM
-
2026-06-01days on market $179,999 Coming Soon 60 DOM
-
2026-05-31days on market $179,999 Coming Soon 59 DOM
-
2026-04-02historical $179,999 955-char remark
Show marketing remark (955 chars)
Charming and well-maintained property located at 3840 College Ave, offering a great opportunity for homeowners or investors alike. This home features a functional layout with comfortable living spaces, abundant natural light, and thoughtful updates throughout. The kitchen provides ample cabinetry and workspace, while the living and dining areas create an inviting atmosphere for everyday living and entertaining. Bedrooms are generously sized, and the property offers a spacious yard perfect for outdoor activities, gardening, or future enhancements. The home is equipped with a very good security system, providing added peace of mind. Recent improvements include a remodeled bathroom and a patio deck, perfect for relaxing or hosting gatherings. Conveniently situated near local amenities, schools, parks, and major roadways, this home combines comfort, location, and potential. A fantastic opportunity to own a property in an established neighborhood
-
2021-02-11soldstatus
-
2021-02-08soldstatus Closed 316-char remark
Show marketing remark (316 chars)
This Cutie is NEW everywhere!!! New Roof, New Furnace, New Exterior Paint, New Interior Paint, New Stained Wood Floors & Built-Ins. Beautiful Charm in all corners Stained Glass, Amazing Built Ins in the Formal Dining Room, Gorgeous Stone Front Porch, Fenced backyard! So much to see Bring yours Buyers today!
-
2021-01-02historical Active Under Contract 316-char remark
Show marketing remark (316 chars)
This Cutie is NEW everywhere!!! New Roof, New Furnace, New Exterior Paint, New Interior Paint, New Stained Wood Floors & Built-Ins. Beautiful Charm in all corners Stained Glass, Amazing Built Ins in the Formal Dining Room, Gorgeous Stone Front Porch, Fenced backyard! So much to see Bring yours Buyers today!
-
2020-12-20price $79,000 316-char remark
Show marketing remark (316 chars)
This Cutie is NEW everywhere!!! New Roof, New Furnace, New Exterior Paint, New Interior Paint, New Stained Wood Floors & Built-Ins. Beautiful Charm in all corners Stained Glass, Amazing Built Ins in the Formal Dining Room, Gorgeous Stone Front Porch, Fenced backyard! So much to see Bring yours Buyers today!
-
2020-11-20price $82,000 316-char remark
Show marketing remark (316 chars)
This Cutie is NEW everywhere!!! New Roof, New Furnace, New Exterior Paint, New Interior Paint, New Stained Wood Floors & Built-Ins. Beautiful Charm in all corners Stained Glass, Amazing Built Ins in the Formal Dining Room, Gorgeous Stone Front Porch, Fenced backyard! So much to see Bring yours Buyers today!
-
2020-10-26status Active 316-char remark
Show marketing remark (316 chars)
This Cutie is NEW everywhere!!! New Roof, New Furnace, New Exterior Paint, New Interior Paint, New Stained Wood Floors & Built-Ins. Beautiful Charm in all corners Stained Glass, Amazing Built Ins in the Formal Dining Room, Gorgeous Stone Front Porch, Fenced backyard! So much to see Bring yours Buyers today!
-
2020-10-26historical Active Under Contract 316-char remark
Show marketing remark (316 chars)
This Cutie is NEW everywhere!!! New Roof, New Furnace, New Exterior Paint, New Interior Paint, New Stained Wood Floors & Built-Ins. Beautiful Charm in all corners Stained Glass, Amazing Built Ins in the Formal Dining Room, Gorgeous Stone Front Porch, Fenced backyard! So much to see Bring yours Buyers today!
-
2020-10-16price $87,000 316-char remark
Show marketing remark (316 chars)
This Cutie is NEW everywhere!!! New Roof, New Furnace, New Exterior Paint, New Interior Paint, New Stained Wood Floors & Built-Ins. Beautiful Charm in all corners Stained Glass, Amazing Built Ins in the Formal Dining Room, Gorgeous Stone Front Porch, Fenced backyard! So much to see Bring yours Buyers today!
-
2020-09-12$89,000 Active 316-char remark
Show marketing remark (316 chars)
This Cutie is NEW everywhere!!! New Roof, New Furnace, New Exterior Paint, New Interior Paint, New Stained Wood Floors & Built-Ins. Beautiful Charm in all corners Stained Glass, Amazing Built Ins in the Formal Dining Room, Gorgeous Stone Front Porch, Fenced backyard! So much to see Bring yours Buyers today!
-
1983-06-01soldstatus
ⓘ Source: listings_history table (triggers on properties + properties_extension) + one-shot
backfill from property_details.listing_events for pre-trigger history.
Tax reassessment forecast MO · Resets to sale price
- Current annual tax
- $390 · $33/mo
- Projected year-2 tax
- $1,746 · $145/mo
- Expected delta
- +$1,356/yr (+$113/mo · 347.6%)
ⓘ Screening estimate from a state-policy table — verify with the county assessor before closing.
Climate risk First Street
- Flood 1/10 Low FEMA zone X (unshaded) · 0% chance over 30 yrs
- Wildfire 1/10 Low
- Heat 4/10 Moderate 7 d/yr ≥107°F today · 17 d/yr by 30 yrs out
- Wind 2/10 Low
- Air quality 3/10 Moderate 2 unhealthy d/yr today · 3 by 30 yrs out
Nearby sold comps map
Loading sold comps map…
Walkable amenities ~0.75 mi
Loading nearby amenities…
Taxation est. · year 1
- Rental income
- $16,293
- − Mortgage interest
- −$10,083
- − Property taxes
- −$390
- − Insurance
- −$900
- − Repairs & maintenance
- −$1,303
- − Management
- −$1,303
- − Depreciation
- −$5,236
- Taxable loss
- −$2,923
- Est. tax savings @ 24.0%
- +$701
- After-tax cash flow
- $956/yr
For passive investors: Depreciation is non-cash, so a rental often shows a tax loss while cash-flowing — sheltering income. Rental losses are passive: they offset passive income freely, and up to $25,000/yr can offset ordinary (W-2) income if you actively participate and your MAGI is under $100k (phasing out to $0 by $150k); unused losses carry forward. On sale, claimed depreciation is recaptured at up to 25%, and gains may owe capital-gains tax (a 1031 exchange can defer both). Figures are a year-1 estimate at your 24.0% rate — not tax advice; consult a CPA.
Schools (NCES district)
- District
- Kansas City 33
- NCES district ID
- 2916400
- Math proficiency
- 12% ▼ -8.00%
- Reading proficiency
- 24% ▬ 0.00%
- Median HH income
- $35,227
- Composite
- 14.8/100
- National rank
- #9387
- State rank
- #308 of 324 in MO
Livability — Kansas City
- Score
- 78/100
- State rank
- #28
- US rank
- #2671
Category grades
Schools grade is shown separately in the Schools card above.
Census & demographics
- Census place
- Kansas City, MO
- County
- Jackson County · 687,798 people
- City population
- 439,467
- Metro
- Kansas City, MO-KS
- Population (ZIP)
- 11,912
- Household income
- $36,088
- Rent vs Own
- Severe rent burden
- 946.0
Population outlook (Jackson County) Hauer SSP2
- Today (2025)
- 719,589 people
- By 2030
- 731,456 · +1.6%
- By 2040
- 746,689 · +3.8%
- By 2050
- 749,289 · +4.1%
- By 2075
- 736,227 · +2.3%
- By 2100
- 668,210 · -7.1%
Race, ethnicity, and origin ACS 2023
- Neighborhood character
- Predominantly Black (79%)
- Race & ethnicity
- Black 79% Hispanic / Latino 9% White 8% Two or more races 7%
- Hispanic origin (detail)
- Mexican 6%
- Common ancestry
- Swedish 1% Hispanic 1%
- Foreign-born
- 7% · Canada
- Languages at home
- 88% English-only · Spanish 7% French/Haitian/Cajun 2%
Political lean MEDSL · Jackson
- 2024 margin
- D (+19.3) · D 58.9% · R 39.5% · Other 1.6%
- 2008→2024 swing
- -6.1pp toward R · 2008: 25.4pp · 2024: 19.3pp
- All cycles
- 2024: D+19.3 2020: D+22.0 2016: D+16.6 2012: D+19.0 2008: D+25.4
Not yet ingested
- Civics
- —
Market trends
- HPI YoY
- ▲ 73.41%
- Current HPI
- 412.6862
- Rent YoY
- ▲ 4.65%
- Metro
- Kansas City, MO-KS
- State GDP YoY
- ▲ 1.84%
- F500 in state
- 20
Industry mix (Fortune 500 HQ in MO)
| Industry | F500 HQs | Revenue |
|---|---|---|
| Healthcare | 1 | $163B |
|
||
| Insurance | 1 | $21B |
|
||
| Industrial Technology | 1 | $17B |
|
||
| Retail | 1 | $16B |
|
||
| Industrial Distribution | 1 | $10B |
|
||
| Utilities | 1 | $9B |
|
||
Price history
+102.2% since first listed11 events — show timeline
- 2026-04-02 Coming Soon $179,999 Heartland MLS as Distributed by MLS Grid
- 2021-02-11 Sold (Public Records) — Public Records
- 2021-02-08 Sold (MLS) — Heartland MLS as Distributed by MLS Grid
- 2021-01-02 Contingent — Heartland MLS as Distributed by MLS Grid
- 2020-12-20 Price Changed $79,000 Heartland MLS as Distributed by MLS Grid
- 2020-11-20 Price Changed $82,000 Heartland MLS as Distributed by MLS Grid
- 2020-10-26 Relisted — Heartland MLS as Distributed by MLS Grid
- 2020-10-26 Contingent — Heartland MLS as Distributed by MLS Grid
- 2020-10-16 Price Changed $87,000 Heartland MLS as Distributed by MLS Grid
- 2020-09-12 Listed $89,000 Heartland MLS as Distributed by MLS Grid
- 1983-06-01 Sold (Public Records) — Public Records
Property tax history
+2.8%/yrLatest (2025): $390 · +0.1% YoY. Source: county tax records.
Cash-flow waterfall
monthlySold comps — $/sqft
last 12 mo · ≤1 miLoading sold comps…