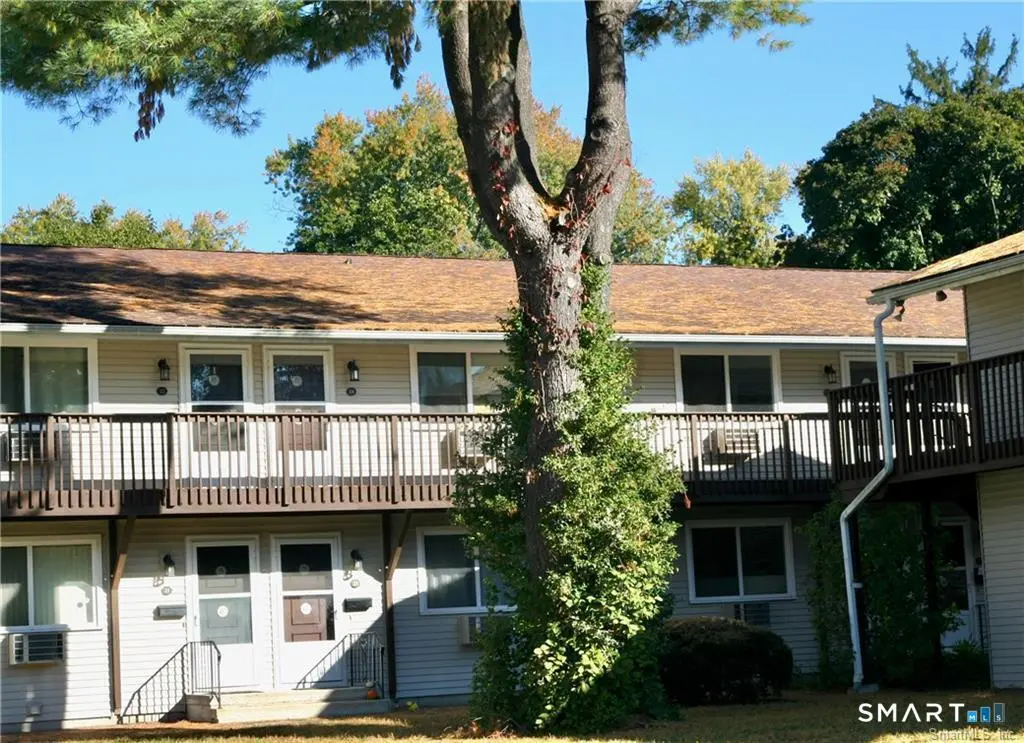
27 Bostwick ARMS #27 · New Milford, CT
Flood risk 1/10 · Minimal
- FEMA flood zone
- X (shaded)
- Chance of flooding over 30 yrs
- 0.0%
- Est. flood insurance / yr
- $507 – $1,088
Fire risk 1/10 · Minimal
- Est. fire insurance / yr
- $829 – $1,539
Heat risk 5/10 · Moderate
- Hot days now (above 97°F)
- 7 days/yr
- Hot days in 30 yrs
- 17 days/yr
Wind risk 5/10 · Moderate
- Chance of severe wind over 30 yrs
- 26.0%
Air-quality risk 3/10 · Minor
- Unhealthy air days now
- 2 days/yr
- Unhealthy air days in 30 yrs
- 3 days/yr
Risk factors via First Street. Map © Google.
Why this score? — see what drove the C- grade
The composite is a weighted blend of 9 inputs, each scored 0–100. Each bar is that input's sub-score; the figure is the points it added to the 100-point composite (weight × sub-score).
- Cash flow +20.0/30.0
- ARV discount +7.5/15.0
- 1% rule +7.4/10.0
- DSCR +6.4/10.0
- Livability +4.3/5.0
- Schools +3.6/10.0
- Rent growth +2.5/5.0
- Condition / age +2.2/5.0
- Appreciation +0.0/10.0
$145,000
🖨 Deal sheet (PDF) 📄 Offer letter ✓ Due diligence
Listing remarks
Main level ranch. .. no steps! Easy breezy living in this affordable one bedroom condo located in southern New Milford. Two minutes to Village Center, bus lines, shops and more!
Key facts
- Main level ranch
- $237 HOA
- Built 1969
Tags
Property features AI
Finance
- Other: 40-unit building
- HOA & community: Monthly HOA fee ($237); HOA covers grounds maintenance, trash pickup, and snow removal; Professional off-site property management; Pets not allowed
Exterior
- Utilities: Public water; Public sewer
- Home design: Condominium (Condo/Co-Op for sale); Part of Bostwick Arms complex
- Construction: Frame construction
- Exterior features: Vinyl siding; Level lot
Interior
- Kitchen: Oven/Range; Refrigerator
- Bedrooms: 1 bedroom
- Bathrooms: 1 full bathroom
- Heating & cooling: Electric baseboard heat; 40-gallon hot water tank
- Interior features: One-level unit; No basement
Neighborhood map
What this means for you Summary
Snapshot
- This is a 1-bed/1.0-bath condo listed at $145k. Condition is rated fair.
Deal economics
- At list price, monthly cash flow is $179 ($2k/yr) — positive.
- The deal already cash-flows at list — no discount required.
- Meets the 1% rule at list price ($2k rent vs $145k).
- Recommended offer: $143k (1.5% below list) — sets the bar for market timing.
- Cap rate 7.8% vs local median 3.5% in New Milford — top-decile yield for the area; either an underpriced asset or a hidden risk that comps aren't pricing in. Stress-test before assuming the spread holds.
Location & tenants
- Location reads 86/100 on livability (#2 in CT, #371 nationally) — a professional / high-income tenant draw. Strengths: crime A+, commute A+, housing A+; Watch: cost of living C-, amenities D-.
- New Milford School District (suburban): math 29% / reading 47% proficiency, ranked #100 of 153 in CT (top 65%) — families likely to look elsewhere, expect single-tenant / working-renter base with shorter leases; only 15% free/reduced lunch — higher-income household profile.
- Zoned schools: Hill And Plain School (377 students, 47% FRL); Schaghticoke Middle School (math 28% / reading 47%, grade F, #112 of 175 statewide, top 66%, 811 students, 36% FRL); New Milford High School (math 33% / reading 62%, grade D, #91 of 194 statewide, top 47%, 1,247 students, 31% FRL) — zoned schools average 38% FRL vs 15% district-wide (23 pts higher); higher-poverty schools than district average — tighter screening recommended.
- Market conditions: 148 active listings in the ZIP; 2 comparable units currently listed for rent nearby; solid renter incomes; 1,151 units permitted in Western Connecticut Planning Region in 2024 (714 in 5+ unit buildings).
Forward outlook
- Local home prices are declining (-3.0%/yr); year-one equity from $1k of loan paydown is wiped out by about $4k of value loss. Plan a longer hold.
Negotiation context
- It's been on market 22 days — a 2% lower offer ($143k) is reasonable based on typical stale-listing flexibility.
Risks & watch-outs
- Climate carrying-cost: moderate wind risk, 26% chance of damaging wind over 30y; extreme-heat days projected 7→17/yr by 2055 (HVAC capex compounding) — expect insurance premiums to compound above CPI over the hold.
Questions for the listing agent
- Have any recent inspections been done? Can we get a copy of the seller's disclosures and any deferred-maintenance estimates?
- Built in 1969 — when were the roof, HVAC, electrical panel, plumbing, and water heater last replaced?
- What does the HOA fee cover, when was the last increase, and are there any pending special assessments or reserve-fund shortfalls?
- Any open or pending special assessments — roof, HVAC, plumbing, elevator, façade? What's the per-unit balance and payoff schedule, and is the seller paying it off at close or rolling it to the buyer?
- Is there a deadline driving the sale (1031 exchange, divorce, estate, relocation)? That informs how much negotiation room exists.
- What's the average days-on-market for RENTAL listings here right now (not sales)? A rising rental-DOM trend means longer vacancies and softer asking-rent achievability than the comps imply.
- What's the recent tenant-quality profile in this submarket — average credit score on applications, eviction rate, late-payment / NSF rate, and stable-employment percentage? A property-management company in the area should have these aggregated.
- How much new apartment / multifamily construction is in the pipeline within 1–3 miles? Heavy new supply (>2% of stock underway) typically softens rents 12–24 months out; light construction supports rent growth.
Investment metrics
- 1% rule
- 1.24% ✓
- Cap rate
- 7.77%
- Cash-on-cash
- 5.28%
- DSCR
- 1.24
- GRM
- 6.7
CMA / ARV
No comps found within radius.
Projected returns pro-forma
-3.0% appreciation · 3.0% rent growth · sell at horizon
- IRR
- -8.0%
- Equity multiple
- 0.71×
- Total profit
- $-11,942
- Equity at exit
- $21,620
- IRR
- 1.7%
- Equity multiple
- 1.12×
- Total profit
- $4,958
- Equity at exit
- $12,537
Cash invested: $40,600 (down + closing). Projections, not guarantees.
Landlord ↔ Tenant lean methodology
- Overall (STATE)
- 27 Tenant-Leaning
- State Connecticut
- 27 Tenant-Leaning · D+7
- County
- — inherits STATE
- City
- — inherits STATE
ZIP-level market 06776
- Active inventory
- 148
- Price-to-rent
- 6.7×
Monthly cashflow live
- Estimated rent
- $1,795 medium interval (Pro) →
- Mortgage (P&I)
- −$760
- Tax est. 1.5%
- −$181 /mo · $2,175/yr
- Insurance
- −$60
- HOA
- −$237
- Vacancy / Maint / Mgmt
- −$377
- Net cashflow
- $179
Break-even live
Sensitivity live
| Price | -10% $279 | -5% $229 | +0% $179 | +5% $129 | +10% $78 |
|---|---|---|---|---|---|
| Rent | -10% $37 | -5% $108 | +0% $179 | +5% $250 | +10% $320 |
| Rate | -1.0pp $252 | -0.5pp $216 | base $179 | +0.5pp $141 | +1.0pp $103 |
UW: 25.0% down · 7.5% · 30yr · 1.5% tax · 5.0% vac · 8.0% maint · 8.0% mgmt
Financing live
Cash to close
- Down payment
- $36,250
- Closing costs
- $4,350
- Reserves months
- —
- Total cash needed
- —
Loan-product check · same deal, 3 products live
Conventional
25% down · 7.5% · 30yr
- Down + closing
- —
- Monthly P&I
- —
- Monthly cashflow
- —
- DSCR
- —
- Eligible?
- —
Personal DTI + credit; lowest rate.
DSCR
20% down · 8.5% · 30yr
- Down + closing
- —
- Monthly P&I
- —
- Monthly cashflow
- —
- DSCR
- —
- Eligible?
- —
No personal income docs; deal must DSCR.
Hard money
10% down · 12.0% · 12mo
- Down + closing
- —
- Monthly P&I
- —
- Monthly cashflow
- —
- DSCR
- —
- Eligible?
- —
Short-term bridge; refi at stabilization.
Rent comps 2 comps
| Address | Beds | Baths | Sqft | Rent | $/sqft | DOM | Units | Dist |
|---|---|---|---|---|---|---|---|---|
| 6 Hillside Ave Unit B New Milford, CT | 1.0 | 1.0 | 624 | $1,850 | $2.96 | 46d | 1 | 0.67mi |
| 63 Glen Ridge Ct #63 New Milford, CT | 1.0 | 1.0 | 682 | $2,050 | $3.01 | 46d | 1 | 1.33mi |
HOA detail condo
- Monthly dues
- $237 · $2,844/yr
- Assessments
- None detected in remarks — confirm with the listing agent.
Listing history 3 events
-
2026-05-14status Under Contract
-
2026-04-23historical Under Contract - Continue to Show
-
2026-04-20$145,000 Active
ⓘ Source: listings_history table (triggers on properties + properties_extension) + one-shot
backfill from property_details.listing_events for pre-trigger history.
Climate risk First Street
- Flood 1/10 Low FEMA zone X (shaded) · 0% chance over 30 yrs
- Wildfire 1/10 Low
- Heat 5/10 Major 7 d/yr ≥97°F today · 17 d/yr by 30 yrs out
- Wind 5/10 Major 26% chance of damaging wind over 30 yrs
- Air quality 3/10 Moderate 2 unhealthy d/yr today · 3 by 30 yrs out
Nearby sold comps map
Loading sold comps map…
Walkable amenities ~0.75 mi
Loading nearby amenities…
Taxation est. · year 1
- Rental income
- $21,536
- − Mortgage interest
- −$8,122
- − Property taxes
- −$2,175
- − Insurance
- −$725
- − Repairs & maintenance
- −$1,723
- − Management
- −$1,723
- − HOA
- −$2,844
- − Depreciation
- −$4,218
- Taxable income
- $5
- Est. tax owed @ 24.0%
- −$1
- After-tax cash flow
- $2,143/yr
For passive investors: Depreciation is non-cash, so a rental often shows a tax loss while cash-flowing — sheltering income. Rental losses are passive: they offset passive income freely, and up to $25,000/yr can offset ordinary (W-2) income if you actively participate and your MAGI is under $100k (phasing out to $0 by $150k); unused losses carry forward. On sale, claimed depreciation is recaptured at up to 25%, and gains may owe capital-gains tax (a 1031 exchange can defer both). Figures are a year-1 estimate at your 24.0% rate — not tax advice; consult a CPA.
Condition & rehab AI · 6 photos
This one-bedroom condo is in fair condition with cosmetic updates needed. Painting and flooring upgrades would significantly enhance its value.
Repairs flagged
- Minor kitchen cabinets — slight wear
- Minor bathroom vanity — slight wear
Value-add opportunities
- Both paint interior walls — enhances curb appeal and interior aesthetics
- Both replace carpet with hardwood — increases both resale and rental value
- Both update kitchen cabinets and appliances — modernizes the space and adds value
Renovation cost estimate screening
| Repair item | Severity | Est. cost |
|---|---|---|
| kitchen cabinets · slight wear | Minor | $500–3,000 |
| bathroom vanity · slight wear | Minor | $500–3,000 |
| Total estimated repair cost · 2 items | $1,000–6,000 |
Value-add ROI direction
- Both paint interior walls — enhances curb appeal and interior aesthetics ↑
- Both replace carpet with hardwood — increases both resale and rental value ↑
- Both update kitchen cabinets and appliances — modernizes the space and adds value ↑
ⓘ Cost ranges are severity-bucket heuristics (US national rule-of-thumb). Get contractor quotes + a written scope before underwriting a rehab budget.
Schools (NCES district)
- District
- New Milford School District
- NCES district ID
- 0902850
- Math proficiency
- 29% ▼ -22.00%
- Reading proficiency
- 47% ▼ -11.00%
- Median HH income
- $81,576
- Composite
- 35.78/100
- National rank
- #4839
- State rank
- #100 of 153 in CT
Livability — New Milford
- Score
- 86/100
- State rank
- #2
- US rank
- #371
Category grades
Schools grade is shown separately in the Schools card above.
Census & demographics
- Census place
- New Milford, CT
- County
- Litchfield County · 81,203 people
- City population
- 27,010
- Metro
- Torrington, CT
- Population (ZIP)
- 27,010
- Household income
- $104,112
- Rent vs Own
- Severe rent burden
- 627.0
Population outlook (Western Connecticut County) Hauer SSP2
- By 2040
- 685,031
Race, ethnicity, and origin ACS 2023
- Neighborhood character
- Predominantly White (77%)
- Race & ethnicity
- White 77% Hispanic / Latino 12% Two or more races 7% Black 4% Asian 4%
- Hispanic origin (detail)
- Puerto Rican 4% Dominican 2%
- Common ancestry
- Romanian 4% Lithuanian 3% Italian 2%
- Foreign-born
- 12% · Canada, China
- Languages at home
- 86% English-only · Spanish 6% Other Indo-European 3% Chinese 1%
Political lean MEDSL · Western Connecticut
- 2024 margin
- D (+19.1) · D 58.8% · R 39.7% · Other 1.6%
- All cycles
- 2024: D+19.1
Not yet ingested
- Civics
- —
Market trends
- HPI YoY
- ▼ -264.52%
- Current HPI
- 305.6036
- Rent YoY
- —
- Metro
- Torrington, CT
- State GDP YoY
- ▲ 1.06%
- F500 in state
- 38
Industry mix (Fortune 500 HQ in CT)
| Industry | F500 HQs | Revenue |
|---|---|---|
| Industrial Machinery | 4 | $38B |
|
||
| Insurance | 3 | $71B |
|
||
| Financial Services | 2 | $25B |
|
||
| Transportation / Logistics | 2 | $18B |
|
||
| Healthcare | 1 | $247B |
|
||
| Telecommunications | 1 | $55B |
|
||
Price history
3 events — show timeline
- 2026-05-14 Pending — Smart MLS
- 2026-04-23 Contingent — Smart MLS
- 2026-04-20 Listed $145,000 Smart MLS
Cash-flow waterfall
monthlySold comps — $/sqft
last 12 mo · ≤1 miLoading sold comps…