2153 River Rd · Gilman, VT
Flood risk 1/10 · Minimal
- FEMA flood zone
- X
- Chance of flooding over 30 yrs
- 0.0%
- Est. flood insurance / yr
- $507 – $1,088
Fire risk 1/10 · Minimal
- Est. fire insurance / yr
- $480 – $892
Heat risk 2/10 · Minimal
- Hot days now (above 89°F)
- 7 days/yr
- Hot days in 30 yrs
- 17 days/yr
Wind risk 2/10 · Minimal
- Chance of severe wind over 30 yrs
- 2.0%
Air-quality risk 2/10 · Minimal
- Unhealthy air days now
- 1 days/yr
- Unhealthy air days in 30 yrs
- 1 days/yr
Risk factors via First Street. Map © Google.
Why this score? — see what drove the B+ grade
The composite is a weighted blend of 9 inputs, each scored 0–100. Each bar is that input's sub-score; the figure is the points it added to the 100-point composite (weight × sub-score).
- Cash flow +30.0/30.0
- 1% rule +10.0/10.0
- DSCR +10.0/10.0
- ARV discount +7.5/15.0
- Appreciation +5.0/10.0
- Schools +5.0/10.0
- Rent growth +2.5/5.0
- Livability +2.5/5.0
- Condition / age +2.5/5.0
$35,000
🖨 Deal sheet 📄 Offer letter ✓ Due diligence
Listing remarks
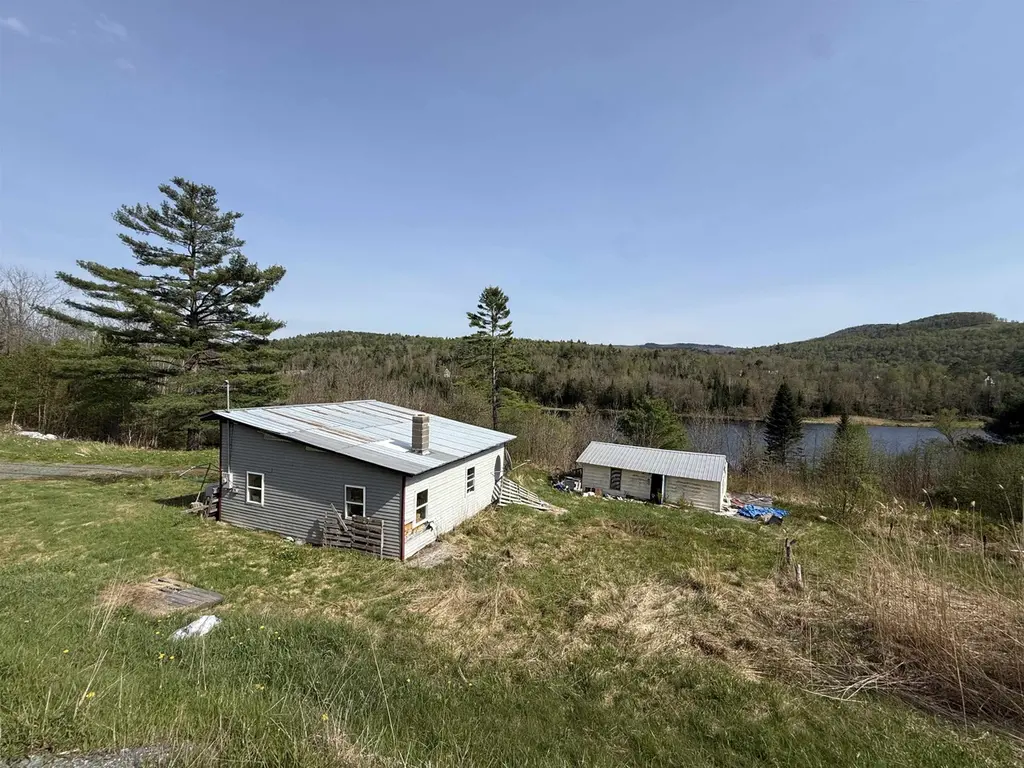
Opportunity awaits with this 1.5-acre property in Gilman, VT offering beautiful views of the Connecticut River and plenty of potential for the right buyer. The existing home is in need of complete rehabilitation or removal, making this an ideal project for investors, builders, or anyone looking to start fresh and create something new in a scenic setting. The property is being sold strictly as is, where is, with all contents and debris remaining. A dug well is on site (condition unknown). Additional features include a small pole barn with attached storage room and a grazing pasture area, offering flexibility for storage, hobby farming, or agricultural use. With its attractive river views and
Key facts
- 1.5-acre property
- Grazing pasture area
- Small pole barn
Tags
Property features AI
Finance
- Other: Assessed in 2024 (assessment details withheld); Tax year 2024 (tax details withheld)
Exterior
- Parking: Driveway access (dirt)
- Utilities: Dug well; On-site electric service (Green Mountain Power); Telephone available; High-speed internet available; Fuel service not provided; Sewer information unknown
- Home design: Cottage/Camp style; Existing structure; Facing information not provided; One-story (entry/levels not specified)
- Construction: Built in 2000; Wood frame with vinyl siding; Metal roof
- Exterior features: Country setting; Mountain view; Water view; Dirt driveway; Public maintained road frontage (approximately 315 feet); Property directions available
Interior
- Bathrooms: One 3/4 bathroom
- Heating & cooling: No heat listed
- Interior features: 3 total rooms
Neighborhood map
What this means for you Summary
Snapshot
- This is a 1-bed/1.0-bath other listed at $35k.
Deal economics
- At list price, monthly cash flow is $381 ($5k/yr) — positive.
- The deal already cash-flows at list — no discount required.
- Meets the 1% rule at list price ($841 rent vs $35k).
Location & tenants
- Location reads: area grade B — affects rentability + tenant quality, not the cash-flow math above.
- Market conditions: 1 active listings in the ZIP; 11 units permitted in Essex County in 2024 (0 in 5+ unit buildings).
Forward outlook
- In year one you build about $1k of equity ($242 loan paydown + $1k appreciation (3.0% local appreciation)).
- Essex County population projected at -30% by 2050 — secular population decline; favor cash flow + early exit over multi-decade hold.
- At projected returns (3.0% appreciation + 3.0% rent growth), your $10k cash investment doubles in ~2 years — after that, you're playing with house money.
Negotiation context
- Only 4 days on market — expect competitive offers; lowballing is unlikely to land.
Risks & watch-outs
- Watch-outs: property tax is 2.9% of price.
Questions for the listing agent
- Property tax is high relative to price — has the assessment been appealed recently, and will the sale trigger a re-assessment?
- Is there a deadline driving the sale (1031 exchange, divorce, estate, relocation)? That informs how much negotiation room exists.
- What's the average days-on-market for RENTAL listings here right now (not sales)? A rising rental-DOM trend means longer vacancies and softer asking-rent achievability than the comps imply.
- What's the recent tenant-quality profile in this submarket — average credit score on applications, eviction rate, late-payment / NSF rate, and stable-employment percentage? A property-management company in the area should have these aggregated.
- How much new for-sale + rental construction is in the pipeline within 1–3 miles? Heavy new supply typically softens prices + rents 12–24 months out; constrained supply supports both.
Investment metrics
- 1% rule
- 2.40% ✓
- Cap rate
- 19.35%
- Cash-on-cash
- 46.62%
- DSCR
- 3.07
- GRM
- 3.5
CMA / ARV
No comps found within radius.
Projected returns pro-forma
3.0% appreciation · 3.0% rent growth · sell at horizon
- IRR
- 51.9%
- Equity multiple
- 3.91×
- Total profit
- $28,506
- Equity at exit
- $15,738
- IRR
- 51.6%
- Equity multiple
- 7.89×
- Total profit
- $67,549
- Equity at exit
- $24,253
Cash invested: $9,800 (down + closing). Projections, not guarantees.
Landlord ↔ Tenant lean methodology
- Overall (STATE)
- 41 Moderately Tenant-Leaning
- State Vermont
- 41 Moderately Tenant-Leaning · D+15
- County
- — inherits STATE
- City
- — inherits STATE
ZIP-level market 05904
- Active inventory
- 1
- Price-to-rent
- 3.5×
Monthly cashflow live
- Estimated rent
- $841 medium interval (Pro) →
- Mortgage (P&I)
- −$184
- Tax from tax record
- −$86 /mo · $1,029/yr
- Insurance
- −$15
- HOA
- −$0
- Vacancy / Maint / Mgmt
- −$177
- Net cashflow
- $381
Break-even live
UW: 25.0% down · 7.5% · 30yr · 1.5% tax · 5.0% vac · 8.0% maint · 8.0% mgmt
Financing live
Cash to close
- Down payment
- $8,750
- Closing costs
- $1,050
- Reserves months
- —
- Total cash needed
- —
Loan-product check · same deal, 3 products live
Conventional
25% down · 7.5% · 30yr
- Down + closing
- —
- Monthly P&I
- —
- Monthly cashflow
- —
- DSCR
- —
- Eligible?
- —
Personal DTI + credit; lowest rate.
DSCR
20% down · 8.5% · 30yr
- Down + closing
- —
- Monthly P&I
- —
- Monthly cashflow
- —
- DSCR
- —
- Eligible?
- —
No personal income docs; deal must DSCR.
Hard money
10% down · 12.0% · 12mo
- Down + closing
- —
- Monthly P&I
- —
- Monthly cashflow
- —
- DSCR
- —
- Eligible?
- —
Short-term bridge; refi at stabilization.
Listing history 1 events
-
2026-05-19$35,000 Active
ⓘ Source: listings_history table (triggers on properties + properties_extension) + one-shot
backfill from property_details.listing_events for pre-trigger history.
Tax reassessment forecast VT · Partial reset (capped growth)
- Current annual tax
- $1,029 · $86/mo
- Projected year-2 tax
- $1,029 · $86/mo
- Expected delta
- $0/yr ($0/mo · 0.0%)
ⓘ Screening estimate from a state-policy table — verify with the county assessor before closing.
Climate risk First Street
- Flood 1/10 Low FEMA zone X · 0% chance over 30 yrs
- Wildfire 1/10 Low
- Heat 2/10 Low 7 d/yr ≥89°F today · 17 d/yr by 30 yrs out
- Wind 2/10 Low 2% chance of damaging wind over 30 yrs
- Air quality 2/10 Low 1 unhealthy d/yr today · 1 by 30 yrs out
Nearby sold comps map
Loading sold comps map…
Walkable amenities ~0.75 mi
Loading nearby amenities…
Taxation est. · year 1
- Rental income
- $10,096
- − Mortgage interest
- −$1,961
- − Property taxes
- −$1,029
- − Insurance
- −$175
- − Repairs & maintenance
- −$808
- − Management
- −$808
- − Depreciation
- −$1,018
- Taxable income
- $4,298
- Est. tax owed @ 24.0%
- −$1,031
- After-tax cash flow
- $3,538/yr
For passive investors: Depreciation is non-cash, so a rental often shows a tax loss while cash-flowing — sheltering income. Rental losses are passive: they offset passive income freely, and up to $25,000/yr can offset ordinary (W-2) income if you actively participate and your MAGI is under $100k (phasing out to $0 by $150k); unused losses carry forward. On sale, claimed depreciation is recaptured at up to 25%, and gains may owe capital-gains tax (a 1031 exchange can defer both). Figures are a year-1 estimate at your 24.0% rate — not tax advice; consult a CPA.
Schools (NCES district)
No district data.
Livability — Gilman
No livability data for this city. (Only ~50 U.S. cities are tracked.)
Census & demographics
- City population
- 187
- Population (ZIP)
- 187
Population outlook (Essex County) Hauer SSP2
- Today (2025)
- 5,715 people
- By 2030
- 5,396 · -5.6%
- By 2040
- 4,680 · -18.1%
- By 2050
- 4,025 · -29.6%
- By 2075
- 3,104 · -45.7%
- By 2100
- 2,590 · -54.7%
Race, ethnicity, and origin ACS 2023
- Neighborhood character
- Predominantly White (97%)
- Race & ethnicity
- White 97% Hispanic / Latino 3% Two or more races 3%
- Common ancestry
- Lithuanian 18% Slovak 8% Romanian 7%
- Foreign-born
- 3% · Canada
- Languages at home
- 95% English-only · French/Haitian/Cajun 5%
Political lean MEDSL · Essex
- 2024 margin
- R (+16.0) · D 39.4% · R 55.4% · Other 5.2%
- 2008→2024 swing
- -30.5pp toward R · 2008: 14.5pp · 2024: -16.0pp
- All cycles
- 2024: R+16.0 2020: R+11.2 2016: R+18.0 2012: D+13.4 2008: D+14.5
Not yet ingested
- Civics
- —
Market trends
- HPI YoY
- —
- Current HPI
- —
- Rent YoY
- —
- Metro
- —
- State GDP YoY
- —
- F500 in state
- 0
Price history
1 event — show timeline
- 2026-05-19 Listed $35,000 PrimeMLS
Property tax history
-0.7%/yrLatest (2024): $1,029 · +71.6% YoY. Source: county tax records.
Cash-flow waterfall
monthlySold comps — $/sqft
last 12 mo · ≤1 miLoading sold comps…