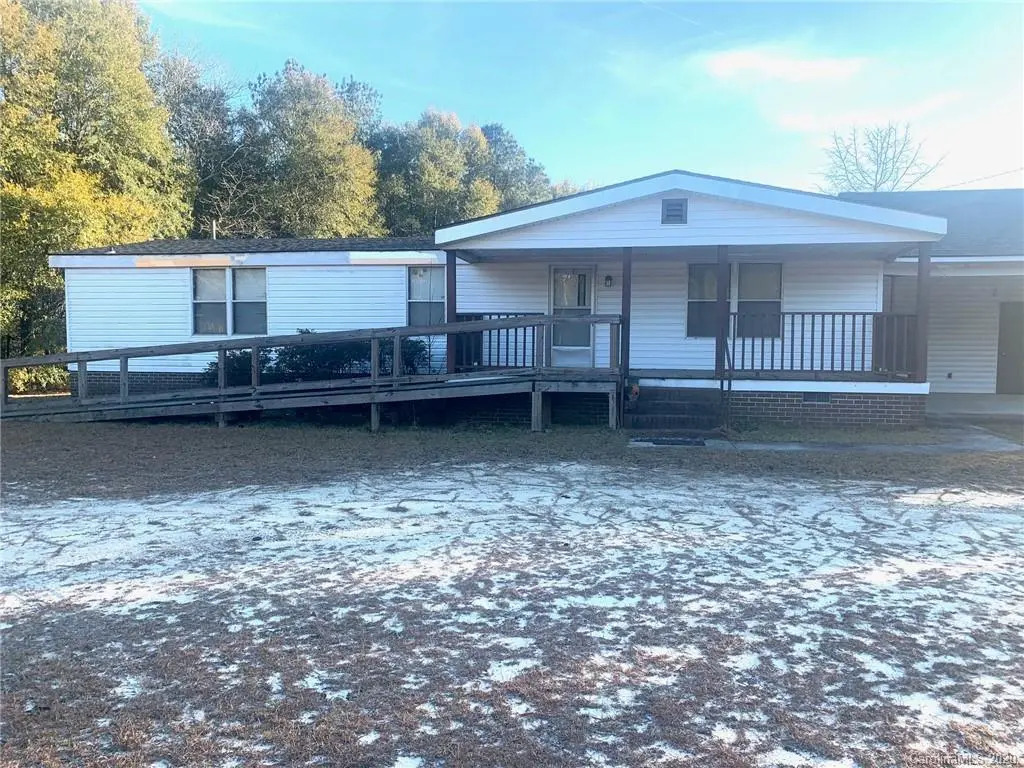
2187 Mcbee Hwy · Jefferson, SC
Flood risk 1/10 · Minimal
- FEMA flood zone
- X (unshaded)
- Chance of flooding over 30 yrs
- 0.0%
- Est. flood insurance / yr
- $507 – $1,088
Fire risk 5/10 · Moderate
- Est. fire insurance / yr
- $783 – $1,453
Heat risk 6/10 · Moderate
- Hot days now (above 107°F)
- 7 days/yr
- Hot days in 30 yrs
- 16 days/yr
Wind risk 6/10 · Moderate
- Chance of severe wind over 30 yrs
- 61.0%
Air-quality risk 2/10 · Minimal
- Unhealthy air days now
- 1 days/yr
- Unhealthy air days in 30 yrs
- 1 days/yr
Risk factors via First Street. Map © Google.
Why this score? — see what drove the D grade
The composite is a weighted blend of 9 inputs, each scored 0–100. Each bar is that input's sub-score; the figure is the points it added to the 100-point composite (weight × sub-score).
- Appreciation +10.0/10.0
- Cash flow +7.7/30.0
- ARV discount +7.5/15.0
- Schools +3.8/10.0
- Livability +3.1/5.0
- Rent growth +2.5/5.0
- Condition / age +2.5/5.0
- 1% rule +2.3/10.0
- DSCR +1.8/10.0
$165,900
🖨 Deal sheet (PDF) 📄 Offer letter ✓ Due diligence
Listing remarks MLS
This 3 bedroom 2 bath fixer upper is nestled in a quiet country setting. Brick under pinning and updated roof add a finished look. Porches on the front and back are perfect for enjoying the nice open lot. All appliances convey. Priced to sell, schedule your viewing today!
Key facts
- 0.83 acre lot
- 2 parking spots
- Built 1983
Property features AI
Finance
- HOA & community: No HOA
Exterior
- Parking: Detached carport (2 spaces); Driveway
- Utilities: County water; Septic system installed
- Home design: Single-family residence; One story; Residential property; Zoned RD-2
- Construction: On-frame modular construction; Vinyl exterior; Crawl space foundation
- Exterior features: Covered front porch; Level and wooded lot; Dirt and concrete road access; Publicly maintained road
Interior
- Kitchen: Electric range
- Bedrooms: 3 bedrooms (all on the main level)
- Flooring: Vinyl flooring
- Bathrooms: 2 full bathrooms (main level)
- Heating & cooling: Electric heating; Central air conditioning
- Interior features: 5 total rooms; Electric range
- Laundry & utility: Laundry closet
Neighborhood map
What this means for you Summary
Snapshot
- This is a 3-bed/2.0-bath other listed at $166k.
Deal economics
- At list price, monthly cash flow is $-194 ($-2k/yr) — negative.
- To cash-flow at today's rent, offer at most $138k (16.9% below list).
- To meet the 1% rule (rent ≥ 1% of price), the offer needs to be $121k (27.3% below list).
- Recommended offer: $121k (27.3% below list) — sets the bar for 1% rule.
Location & tenants
- Location reads 61/100 on livability (#212 in SC) — a middle-class / working-renter tenant base. Strengths: cost of living A+, housing A+, crime A-; Watch: amenities F, commute F, employment F.
- Kershaw 01 (rural): math 38% / reading 51% proficiency, ranked #25 of 80 in SC (top 31%) — families likely to look elsewhere, expect single-tenant / working-renter base with shorter leases.
- Zoned schools: North Central Middle (math 30% / reading 51%, grade F, #75 of 229 statewide, top 33%, 420 students, 100% FRL); North Central High (math 57% / reading 87%, grade B+, #48 of 196 statewide, top 26%, 586 students, 76% FRL) — zoned schools average 88% FRL vs 49% district-wide (39 pts higher); higher-poverty schools than district average — tighter screening recommended.
- Market conditions: 20 active listings in the ZIP; 491 units permitted in Kershaw County in 2024 (0 in 5+ unit buildings).
Forward outlook
- In year one you build about $18k of equity ($1k loan paydown + $17k appreciation (10.0% local appreciation)).
- Kershaw County population projected at +8% by 2050 — modest demand growth; plan on rents tracking national, not racing it.
- By year 3, paydown + projected appreciation supports a ~$45k cash-out refi (75% LTV) — recoverable capital for the next deal without selling this one.
Negotiation context
- It's been on market 85 days — a 6% lower offer ($156k) is reasonable based on typical stale-listing flexibility.
- 2 sale attempts since 6y ago; this cycle's ask has dropped $44k (21%) from the opening price — seller is motivated, your offer sets the floor, not the list.
- Current owner paid $65k; list at $166k implies a 155% gain — meaningful room to come down on a strong offer.
Risks & watch-outs
- Climate carrying-cost: major wind risk, 61% chance of damaging wind over 30y; moderate wildfire risk; extreme-heat days projected 7→16/yr by 2055 (HVAC capex compounding) — expect insurance premiums to compound above CPI over the hold.
Questions for the listing agent
- What do current leases actually rent for vs. the listed asking? Can we see a recent rent roll and the last 12 months of T-12 income?
- It's been on market 85 days. Have you received any prior offers? Is the seller open to a 27% concession, seller financing, or rate buy-down credit?
- Why hasn't it sold? Are there any deal-killer items the seller is aware of (foundation, flood, title, zoning, code violations)?
- Is there a deadline driving the sale (1031 exchange, divorce, estate, relocation)? That informs how much negotiation room exists.
- Schools are F-rated, which usually means shorter tenancies and higher turnover. Who's the typical renter profile here, and what's been the actual vacancy rate?
- The area grade is low — what's the realistic commute time and amenity access for the typical tenant pool here? Any planned neighborhood developments (good or bad) we should know about?
- What's the average days-on-market for RENTAL listings here right now (not sales)? A rising rental-DOM trend means longer vacancies and softer asking-rent achievability than the comps imply.
- What's the recent tenant-quality profile in this submarket — average credit score on applications, eviction rate, late-payment / NSF rate, and stable-employment percentage? A property-management company in the area should have these aggregated.
- How much new for-sale + rental construction is in the pipeline within 1–3 miles? Heavy new supply typically softens prices + rents 12–24 months out; constrained supply supports both.
Investment metrics
- 1% rule
- 0.73% ✗
- Cap rate
- 4.89%
- Cash-on-cash
- -5.02%
- DSCR
- 0.78
- GRM
- 11.5
CMA / ARV
No comps found within radius.
Projected returns pro-forma
10.0% appreciation · 3.0% rent growth · sell at horizon
- IRR
- 20.7%
- Equity multiple
- 2.68×
- Total profit
- $78,007
- Equity at exit
- $149,456
- IRR
- 18.8%
- Equity multiple
- 6.16×
- Total profit
- $239,478
- Equity at exit
- $322,307
Cash invested: $46,452 (down + closing). Projections, not guarantees.
Landlord ↔ Tenant lean methodology
- Overall (STATE)
- 90 Strongly Landlord-Friendly
- State South Carolina
- 90 Strongly Landlord-Friendly · R+6
- County
- — inherits STATE
- City
- — inherits STATE
ZIP-level market 29718
- Home prices YoY
- 4.8%
- Active inventory
- 20
- Price-to-rent
- 11.5×
Monthly cashflow live
- Estimated rent
- $1,206 medium interval (Pro) →
- Mortgage (P&I)
- −$870
- Tax est. 1.5%
- −$207 /mo · $2,488/yr
- Insurance
- −$69
- HOA
- −$0
- Vacancy / Maint / Mgmt
- −$253
- Net cashflow
- $-194
Break-even live
Sensitivity live
| Price | -10% $-79 | -5% $-137 | +0% $-194 | +5% $-251 | +10% $-309 |
|---|---|---|---|---|---|
| Rent | -10% $-289 | -5% $-242 | +0% $-194 | +5% $-147 | +10% $-99 |
| Rate | -1.0pp $-111 | -0.5pp $-152 | base $-194 | +0.5pp $-237 | +1.0pp $-281 |
UW: 25.0% down · 7.5% · 30yr · 1.5% tax · 5.0% vac · 8.0% maint · 8.0% mgmt
Financing live
Cash to close
- Down payment
- $41,475
- Closing costs
- $4,977
- Reserves months
- —
- Total cash needed
- —
Loan-product check · same deal, 3 products live
Conventional
25% down · 7.5% · 30yr
- Down + closing
- —
- Monthly P&I
- —
- Monthly cashflow
- —
- DSCR
- —
- Eligible?
- —
Personal DTI + credit; lowest rate.
DSCR
20% down · 8.5% · 30yr
- Down + closing
- —
- Monthly P&I
- —
- Monthly cashflow
- —
- DSCR
- —
- Eligible?
- —
No personal income docs; deal must DSCR.
Hard money
10% down · 12.0% · 12mo
- Down + closing
- —
- Monthly P&I
- —
- Monthly cashflow
- —
- DSCR
- —
- Eligible?
- —
Short-term bridge; refi at stabilization.
Listing history 15 events
-
2026-06-22days on market $165,900 Active 85 DOM
-
2026-06-18days on market $165,900 Active 82 DOM
-
2026-06-17days on market $165,900 Active 81 DOM
-
2026-06-16days on market $165,900 Active 80 DOM
-
2026-06-15days on market $165,900 Active 79 DOM
-
2026-06-14pricedays on market $165,900 Active 77 DOM
-
2026-05-31days on market $179,900 Active 75 DOM
-
2026-05-12price $195,000
-
2026-03-18$210,000 Active
-
2026-03-17historical $210,000
-
2021-05-24soldstatus $65,000
-
2021-05-21soldstatus $65,000 Closed 272-char remark
Show marketing remark (272 chars)
This 3 bedroom 2 bath fixer upper is nestled in a quiet country setting. Brick under pinning and updated roof add a finished look. Porches on the front and back are perfect for enjoying the nice open lot. All appliances convey. Priced to sell, schedule your viewing today!
-
2021-04-06historical Active Under Contract 272-char remark
Show marketing remark (272 chars)
This 3 bedroom 2 bath fixer upper is nestled in a quiet country setting. Brick under pinning and updated roof add a finished look. Porches on the front and back are perfect for enjoying the nice open lot. All appliances convey. Priced to sell, schedule your viewing today!
-
2020-12-21price $84,500 272-char remark
Show marketing remark (272 chars)
This 3 bedroom 2 bath fixer upper is nestled in a quiet country setting. Brick under pinning and updated roof add a finished look. Porches on the front and back are perfect for enjoying the nice open lot. All appliances convey. Priced to sell, schedule your viewing today!
-
2020-12-21$845,000 Active 272-char remark
Show marketing remark (272 chars)
This 3 bedroom 2 bath fixer upper is nestled in a quiet country setting. Brick under pinning and updated roof add a finished look. Porches on the front and back are perfect for enjoying the nice open lot. All appliances convey. Priced to sell, schedule your viewing today!
ⓘ Source: listings_history table (triggers on properties + properties_extension) + one-shot
backfill from property_details.listing_events for pre-trigger history.
Climate risk First Street
- Flood 1/10 Low FEMA zone X (unshaded) · 0% chance over 30 yrs
- Wildfire 5/10 Major
- Heat 6/10 Major 7 d/yr ≥107°F today · 16 d/yr by 30 yrs out
- Wind 6/10 Major 61% chance of damaging wind over 30 yrs
- Air quality 2/10 Low 1 unhealthy d/yr today · 1 by 30 yrs out
Nearby sold comps map
Loading sold comps map…
Walkable amenities ~0.75 mi
Loading nearby amenities…
Taxation est. · year 1
- Rental income
- $14,466
- − Mortgage interest
- −$9,293
- − Property taxes
- −$2,488
- − Insurance
- −$830
- − Repairs & maintenance
- −$1,157
- − Management
- −$1,157
- − Depreciation
- −$4,826
- Taxable loss
- −$5,286
- Est. tax savings @ 24.0%
- +$1,269
- After-tax cash flow
- $-1,061/yr
For passive investors: Depreciation is non-cash, so a rental often shows a tax loss while cash-flowing — sheltering income. Rental losses are passive: they offset passive income freely, and up to $25,000/yr can offset ordinary (W-2) income if you actively participate and your MAGI is under $100k (phasing out to $0 by $150k); unused losses carry forward. On sale, claimed depreciation is recaptured at up to 25%, and gains may owe capital-gains tax (a 1031 exchange can defer both). Figures are a year-1 estimate at your 24.0% rate — not tax advice; consult a CPA.
Schools (NCES district)
- District
- Kershaw 01
- NCES district ID
- 4502550
- Math proficiency
- 38% ▼ -7.00%
- Reading proficiency
- 51% ▲ 6.00%
- Median HH income
- $44,585
- Composite
- 37.66/100
- National rank
- #4371
- State rank
- #25 of 80 in SC
Livability — Jefferson
- Score
- 61/100
- State rank
- #212
- US rank
- #17840
Category grades
Schools grade is shown separately in the Schools card above.
Census & demographics
- Population (ZIP)
- 4,049
Population outlook (Kershaw County) Hauer SSP2
- Today (2025)
- 67,683 people
- By 2030
- 69,374 · +2.5%
- By 2040
- 71,936 · +6.3%
- By 2050
- 73,292 · +8.3%
- By 2075
- 75,762 · +11.9%
- By 2100
- 72,620 · +7.3%
Race, ethnicity, and origin ACS 2023
- Neighborhood character
- Predominantly White (73%)
- Race & ethnicity
- White 73% Black 22% Hispanic / Latino 3% Two or more races 3%
- Common ancestry
- Slovak 3% Serbian 1%
- Foreign-born
- 1% · Canada
- Languages at home
- 98% English-only · Spanish 2%
Political lean MEDSL · Kershaw
- 2024 margin
- Strong R (+28.2) · D 35.3% · R 63.5% · Other 1.2%
- 2008→2024 swing
- -9.5pp toward R · 2008: -18.7pp · 2024: -28.2pp
- All cycles
- 2024: R+28.2 2020: R+23.1 2016: R+24.8 2012: R+18.6 2008: R+18.7
Not yet ingested
- Civics
- —
Market trends
- HPI YoY
- ▲ 14.53%
- Current HPI
- 316.6672
- Rent YoY
- —
- Metro
- —
- State GDP YoY
- ▲ 4.51%
- F500 in state
- 2
Industry mix (Fortune 500 HQ in SC)
| Industry | F500 HQs | Revenue |
|---|---|---|
| Packaging | 1 | $7B |
|
||
Price history
-76.9% since first listed8 events — show timeline
- 2026-05-12 Price Changed $195,000 CANOPYMLS as Distributed by MLS Grid
- 2026-03-18 Listed $210,000 CANOPYMLS as Distributed by MLS Grid
- 2026-03-17 Coming Soon $210,000 CANOPYMLS as Distributed by MLS Grid
- 2021-05-24 Sold (Public Records) $65,000 Public Records
- 2021-05-21 Sold (MLS) $65,000 CANOPYMLS as Distributed by MLS Grid
- 2021-04-06 Contingent — CANOPYMLS as Distributed by MLS Grid
- 2020-12-21 Price Changed $84,500 CANOPYMLS as Distributed by MLS Grid
- 2020-12-21 Listed $845,000 CANOPYMLS as Distributed by MLS Grid
Property tax history
-1.2%/yrLatest (2025): $55 · -84.9% YoY. Source: county tax records.
Cash-flow waterfall
monthlySold comps — $/sqft
last 12 mo · ≤1 miLoading sold comps…