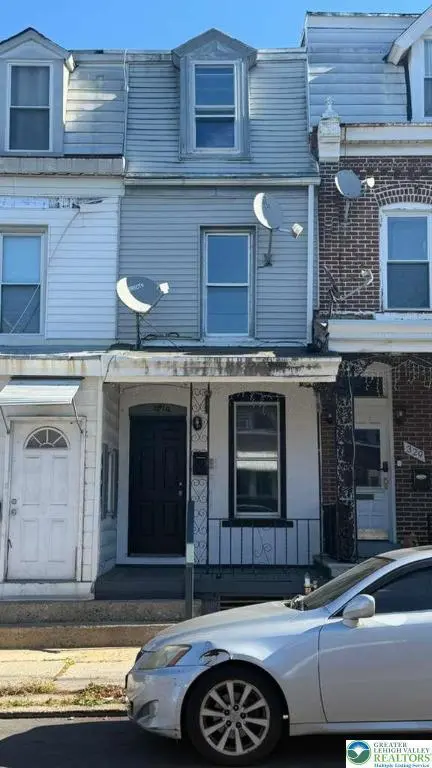
329 N 15th · Allentown, PA
Flood risk 1/10 · Minimal
- FEMA flood zone
- X (unshaded)
- Chance of flooding over 30 yrs
- 0.0%
- Est. flood insurance / yr
- $473 – $860
Fire risk 1/10 · Minimal
- Est. fire insurance / yr
- $511 – $949
Heat risk 5/10 · Moderate
- Hot days now (above 99°F)
- 7 days/yr
- Hot days in 30 yrs
- 15 days/yr
Wind risk 4/10 · Minor
- Chance of severe wind over 30 yrs
- 15.0%
Air-quality risk 3/10 · Minor
- Unhealthy air days now
- 3 days/yr
- Unhealthy air days in 30 yrs
- 4 days/yr
Risk factors via First Street. Map © Google.
Why this score? — see what drove the C+ grade
The composite is a weighted blend of 9 inputs, each scored 0–100. Each bar is that input's sub-score; the figure is the points it added to the 100-point composite (weight × sub-score).
- Cash flow +23.4/30.0
- ARV discount +15.0/15.0
- DSCR +7.5/10.0
- 1% rule +6.1/10.0
- Livability +4.0/5.0
- Rent growth +3.9/5.0
- Condition / age +2.5/5.0
- Schools +1.2/10.0
- Appreciation +0.0/10.0
$210,000
🖨 Deal sheet (PDF) 📄 Offer letter ✓ Due diligence
Listing remarks
Cute as a button! This fully remodeled 4-bedroom, 1-bathroom brick townhouse is move-in ready and beautifully updated throughout. Enjoy the charm of a freshly painted covered front porch and a cozy back porch — perfect for relaxing outdoors. The home features easy-care laminate flooring, a spacious kitchen with matching black appliances, and a low-maintenance lifestyle with no grass to mow! Conveniently located close to shopping, medical facilities, and schools — everything you need is just steps away!
Key facts
- Covered front porch
- Spacious kitchen
- Cozy back porch
Tags
Property features AI
Exterior
- Parking: No garage
- Utilities: Public water service; Public sewer service; Electric water heater
- Home design: Above-grade finished area listed (information available)
- Construction: Brick and vinyl siding exterior; Rubber roof; Rolled/hot mop roof
- Exterior features: Public water; Public sewer; Lot recorded at 0.017 acres (source: public records)
Interior
- Kitchen: Electric oven; Electric range; Refrigerator
- Bedrooms: Bedroom on third level (approx. 10 x 10); Bedroom on third level (approx. 10 x 10); Bedroom on second level (approx. 14 x 10); Bedroom on second level (approx. 14 x 10)
- Bathrooms: 1 full bathroom (approx. 8 x 7) on second level
- Heating & cooling: Oil heating
- Interior features: Dining area; Full basement
- Laundry & utility: Electric water heater
Neighborhood map
What this means for you Summary
Snapshot
- This is a 5-bed/2.0-bath townhouse listed at $210k.
Deal economics
- At list price, monthly cash flow is $389 ($5k/yr) — positive.
- The deal already cash-flows at list — no discount required.
- Meets the 1% rule at list price ($2k rent vs $210k).
- Recommended offer: $207k (1.5% below list) — sets the bar for market timing.
- Cap rate 8.5% vs local median 5.3% in Allentown — top-decile yield for the area; either an underpriced asset or a hidden risk that comps aren't pricing in. Stress-test before assuming the spread holds.
Location & tenants
- Location reads 81/100 on livability (#171 in PA, #1,440 nationally) — a professional / high-income tenant draw. Strengths: commute A+, cost of living A+, housing A+; Watch: schools D+, employment D.
- Allentown City SD (urban): math 10% / reading 20% proficiency, ranked #513 of 539 in PA (top 95%) — low school quality limits family demand, transient renter base, plan for 1-2y turnover; 73% free/reduced lunch — lower-income household profile, screen leases tightly.
- Market conditions: Rents rising fast (+5.5%/yr); 167 active listings in the ZIP; 23 comparable units currently listed for rent nearby; rentals at typical pace (median 15d on market — plan ~3-4 weeks tenant-placement turnaround); lower-income renter base — watch delinquency; 765 units permitted in Lehigh County in 2024 (286 in 5+ unit buildings).
- At $2,332/mo this rent would consume 65% of the median local household income ($43k/yr) (locally 4313% of renters already pay >50% of income on rent) — very limited rent-growth headroom before tenants either downsize or default.
Forward outlook
- Local home prices are declining (-3.0%/yr); year-one equity from $1k of loan paydown is wiped out by about $6k of value loss. Plan a longer hold.
- Lehigh County population projected at +21% by 2050 — long-run rental-demand tailwind backs the buy-and-hold thesis.
- At projected returns (-3.0% appreciation + 5.5% rent growth), your $59k cash investment doubles in ~10 years — after that, you're playing with house money.
Negotiation context
- It's been on market 26 days — a 2% lower offer ($207k) is reasonable based on typical stale-listing flexibility.
- 18 sale attempts since 25y ago with the ask held roughly flat each time — persistent listings suggest the price (not the market) is what's stuck; bring a comps-based counter.
- Current owner paid $111k; list at $210k implies a 89% gain — meaningful room to come down on a strong offer.
Risks & watch-outs
- Watch-outs: built in 1914 — expect roof / HVAC / electrical / plumbing capex.
- Climate carrying-cost: extreme-heat days projected 7→15/yr by 2055 (HVAC capex compounding) — expect insurance premiums to compound above CPI over the hold.
Questions for the listing agent
- Built in 1914 — when were the roof, HVAC, electrical panel, plumbing, and water heater last replaced?
- Is there a deadline driving the sale (1031 exchange, divorce, estate, relocation)? That informs how much negotiation room exists.
- Schools are D-rated, which usually means shorter tenancies and higher turnover. Who's the typical renter profile here, and what's been the actual vacancy rate?
- What's the average days-on-market for RENTAL listings here right now (not sales)? A rising rental-DOM trend means longer vacancies and softer asking-rent achievability than the comps imply.
- What's the recent tenant-quality profile in this submarket — average credit score on applications, eviction rate, late-payment / NSF rate, and stable-employment percentage? A property-management company in the area should have these aggregated.
- How much new for-sale + rental construction is in the pipeline within 1–3 miles? Heavy new supply typically softens prices + rents 12–24 months out; constrained supply supports both.
Investment metrics
- 1% rule
- 1.11% ✓
- Cap rate
- 8.52%
- Cash-on-cash
- 7.94%
- DSCR
- 1.35
- GRM
- 7.5
CMA / ARV
- ARV (on-the-fly)
- $281,480
- Comps found
- 12
Show comp detail 12 sales within ~0.75 mi
| Address | Dist | Beds/Ba | Sqft | Sold | Price | $/sf | Match |
|---|---|---|---|---|---|---|---|
| 1538 W Chew St | 0.12mi | 5/1.5 | 1,874 (+3%) | 1mo | $291,100 | $155 | 86 |
| 225 Fulton St | 0.13mi | 5/2.0 | 1,920 (+6%) | 2mo | $175,000 | $91 | 83 |
| 226 N 16th St | 0.18mi | 4/2.0 (-1) | 1,758 (-3%) | 0mo | $310,000 | $176 | 81 |
| 219 N 17th St | 0.26mi | 5/2.0 | 1,984 (+9%) | 1mo | $320,000 | $161 | 72 |
| 1416 Turner St | 0.19mi | 5/2.0 | 2,048 (+13%) | 2mo | $305,000 | $149 | 68 |
| 519 N 11th St | 0.49mi | 5/2.0 | 1,929 (+6%) | 1mo | $350,000 | $181 | 66 |
| 638 N 12th St | 0.45mi | 4/2.0 (-1) | 1,704 (-6%) | 2mo | $262,000 | $154 | 62 |
| 651 N 16th St | 0.34mi | 5/1.5 | 1,590 (-12%) | 1mo | $260,000 | $164 | 60 |
| 1119 W Green St | 0.57mi | 5/1.0 | 1,699 (-6%) | 1mo | $220,000 | $129 | 58 |
| 32 S Jefferson St | 0.51mi | 5/1.0 | 2,008 (+11%) | 2mo | $156,000 | $78 | 53 |
| 215 N 10th St | 0.58mi | 4/2.0 (-1) | 1,590 (-12%) | 1mo | $267,000 | $168 | 46 |
| 513 N Howard St | 0.54mi | 5/1.0 | 2,069 (+14%) | 2mo | $160,000 | $77 | 46 |
Match score weights: distance 35% · size 25% · config 20% · recency 20%. Top-matched comps best support the ARV.
Projected returns pro-forma
-3.0% appreciation · 5.48% rent growth · sell at horizon
- IRR
- -1.4%
- Equity multiple
- 0.94×
- Total profit
- $-3,253
- Equity at exit
- $31,312
- IRR
- 10.8%
- Equity multiple
- 1.93×
- Total profit
- $54,969
- Equity at exit
- $18,157
Cash invested: $58,800 (down + closing). Projections, not guarantees.
Landlord ↔ Tenant lean methodology
- Overall (STATE)
- 62 Landlord-Friendly
- State Pennsylvania
- 62 Landlord-Friendly · EVEN
- County
- — inherits STATE
- City
- — inherits STATE
ZIP-level market 18102
- Rents YoY
- 5.5%
- Active inventory
- 167
- Price-to-rent
- 7.5×
Monthly cashflow live
- Estimated rent
- $2,332 high interval (Pro) →
- Mortgage (P&I)
- −$1,101
- Tax from tax record
- −$265 /mo · $3,179/yr
- Insurance
- −$88
- HOA
- −$0
- Vacancy / Maint / Mgmt
- −$490
- Net cashflow
- $389
Break-even live
Sensitivity live
| Price | -10% $508 | -5% $448 | +0% $389 | +5% $330 | +10% $270 |
|---|---|---|---|---|---|
| Rent | -10% $205 | -5% $297 | +0% $389 | +5% $481 | +10% $573 |
| Rate | -1.0pp $495 | -0.5pp $442 | base $389 | +0.5pp $335 | +1.0pp $279 |
UW: 25.0% down · 7.5% · 30yr · 1.5% tax · 5.0% vac · 8.0% maint · 8.0% mgmt
Financing live
Cash to close
- Down payment
- $52,500
- Closing costs
- $6,300
- Reserves months
- —
- Total cash needed
- —
Loan-product check · same deal, 3 products live
Conventional
25% down · 7.5% · 30yr
- Down + closing
- —
- Monthly P&I
- —
- Monthly cashflow
- —
- DSCR
- —
- Eligible?
- —
Personal DTI + credit; lowest rate.
DSCR
20% down · 8.5% · 30yr
- Down + closing
- —
- Monthly P&I
- —
- Monthly cashflow
- —
- DSCR
- —
- Eligible?
- —
No personal income docs; deal must DSCR.
Hard money
10% down · 12.0% · 12mo
- Down + closing
- —
- Monthly P&I
- —
- Monthly cashflow
- —
- DSCR
- —
- Eligible?
- —
Short-term bridge; refi at stabilization.
Rent comps 23 comps
| Address | Beds | Baths | Sqft | Rent | $/sqft | DOM | Units | Dist |
|---|---|---|---|---|---|---|---|---|
| 1341 Chew St Allentown, PA | 5.0 | 1.5 | 2139 | $2,500 | $1.17 | 22d | 1 | 0.13mi |
| 1538 Chew St Allentown, PA | 5.0 | 1.0 | 1874 | $2,800 | $1.49 | 19d | 1 | 0.14mi |
| 1348 W Liberty St Allentown, PA | 5.0 | 1.0 | 1561 | $1,900 | $1.22 | 24d | 1 | 0.16mi |
| 1338 W Liberty St Allentown, PA | 4.0 | 1.0 | 1526 | $2,000 | $1.31 | 15d | 1 | 0.18mi |
| 1455 W Tilghman St Allentown, PA | 4.0 | 1.5 | 1520 | $1,850 | $1.22 | 44d | 1 | 0.34mi |
| 41 S Franklin St Allentown, PA | 5.0 | 2.0 | 1897 | $2,500 | $1.32 | 15d | 1 | 0.46mi |
| 626 N 11th St Allentown, PA | 4.0 | 1.5 | 1642 | $2,200 | $1.34 | 3d | 1 | 0.51mi |
| 36 S Jefferson St Allentown, PA | 5.0 | 1.5 | 2128 | $2,500 | $1.17 | 15d | 1 | 0.52mi |
| 138 S 14th St Allentown, PA | 5.0 | 1.0 | 2300 | $2,300 | $1.00 | 15d | 1 | 0.56mi |
| 216 S 14th St Allentown, PA | 4.0 | 1.5 | 1640 | $2,300 | $1.40 | 3d | 1 | 0.60mi |
| 144 S 12th St Allentown, PA | 4.0 | 2.0 | 1242 | $2,000 | $1.61 | 3d | 1 | 0.64mi |
| 828 W Gordon St Allentown, PA | 4.0 | 2.5 | 1628 | $2,250 | $1.38 | 3d | 1 | 0.72mi |
| 948 W Maple St Allentown, PA | 4.0 | 1.0 | 1932 | $2,300 | $1.19 | 44d | 1 | 0.72mi |
| 823 W Washington St Allentown, PA | 4.0 | 1.0 | 1400 | $1,950 | $1.39 | 15d | 1 | 0.86mi |
| 856 N 8th St Allentown, PA | 5.0 | 1.5 | 1499 | $1,975 | $1.32 | 19d | 1 | 0.94mi |
| 631 W Allen St Allentown, PA | 5.0 | 1.5 | 1695 | $2,100 | $1.24 | 44d | 1 | 0.95mi |
| 738 W Cedar St Allentown, PA | 5.0 | 1.5 | 1900 | $2,500 | $1.32 | 44d | 1 | 0.95mi |
| 622 Park St Allentown, PA | 5.0 | 1.5 | 1638 | $2,300 | $1.40 | 3d | 1 | 0.97mi |
| 432 N Law St Allentown, PA | 4.0 | 1.0 | 1328 | $1,500 | $1.13 | 15d | 1 | 1.05mi |
| 535 Tilghman St Unit 2ND Allentown, PA | 4.0 | 2.0 | 1500 | $1,750 | $1.17 | 3d | 1 | 1.09mi |
| 913 N 6th St Allentown, PA | 4.0 | 1.0 | 1476 | $1,698 | $1.15 | 15d | 1 | 1.17mi |
| 389 W Turner St Allentown, PA | 4.0 | 1.5 | 2144 | $2,400 | $1.12 | 3d | 1 | 1.30mi |
| 1304 N 4th St Allentown, PA | 5.0 | 2.0 | 1891 | $2,900 | $1.53 | 44d | 1 | 1.44mi |
Listing history 50 events
-
2026-06-18days on market $210,000 Active 26 DOM
-
2026-06-17days on market $210,000 Active 25 DOM
-
2026-06-16days on market $210,000 Active 24 DOM
-
2026-06-15days on market $210,000 Active 23 DOM
-
2026-06-14days on market $210,000 Active 21 DOM
-
2026-06-10days on market $210,000 Active 18 DOM
-
2026-06-09days on market $210,000 Active 17 DOM
-
2026-06-08days on market $210,000 Active 16 DOM
-
2026-06-07days on market $210,000 Active 15 DOM
-
2026-06-03days on market $210,000 Active 11 DOM
-
2026-06-02days on market $210,000 Active 10 DOM
-
2026-06-01days on market $210,000 Active 9 DOM
-
2026-05-31days on market $210,000 Active 8 DOM
-
2026-05-31days on market $210,000 Active 7 DOM
-
2026-05-23$210,000 Active
-
2026-04-25historical
-
2026-04-24historical
-
2026-01-02price $229,000
-
2026-01-02price $229,000
-
2025-12-08price $249,900
-
2025-12-08price $249,900
-
2025-10-28$260,000 Active
-
2025-10-27$260,000 Active
-
2025-03-26historical
-
2025-02-20$170,000 Active
-
2021-08-15soldstatus $111,000 Sold
-
2021-08-15soldstatus $111,000 Sold
-
2021-07-29status Pending
-
2021-07-29status Pending
-
2021-07-23price $115,000
-
2021-07-23price $115,000
-
2021-07-23status Active
-
2021-07-23status Active
-
2021-06-16historical
-
2021-06-16historical
-
2021-05-06status Active
-
2021-05-05$109,900
-
2021-05-05$109,900 Active
-
2011-01-31historical
-
2010-07-05$117,900
-
2010-06-30historical
-
2010-03-16$124,900
-
2009-12-08historical
-
2009-10-06historical
-
2009-10-06$118,900
-
2009-06-08$119,900
-
2009-05-01historical
-
2009-04-20soldstatus $70,000
-
2008-10-10$104,900
-
2007-05-16historical
ⓘ Source: listings_history table (triggers on properties + properties_extension) + one-shot
backfill from property_details.listing_events for pre-trigger history.
Tax reassessment forecast PA · Partial reset (capped growth)
- Current annual tax
- $3,179 · $265/mo
- Projected year-2 tax
- $3,248 · $271/mo
- Expected delta
- +$70/yr (+$6/mo · 2.2%)
ⓘ Screening estimate from a state-policy table — verify with the county assessor before closing.
Climate risk First Street
- Flood 1/10 Low FEMA zone X (unshaded) · 0% chance over 30 yrs
- Wildfire 1/10 Low
- Heat 5/10 Major 7 d/yr ≥99°F today · 15 d/yr by 30 yrs out
- Wind 4/10 Moderate 15% chance of damaging wind over 30 yrs
- Air quality 3/10 Moderate 3 unhealthy d/yr today · 4 by 30 yrs out
Nearby sold comps map
Loading sold comps map…
Walkable amenities ~0.75 mi
Loading nearby amenities…
Taxation est. · year 1
- Rental income
- $27,990
- − Mortgage interest
- −$11,763
- − Property taxes
- −$3,179
- − Insurance
- −$1,050
- − Repairs & maintenance
- −$2,239
- − Management
- −$2,239
- − Depreciation
- −$6,109
- Taxable income
- $1,410
- Est. tax owed @ 24.0%
- −$338
- After-tax cash flow
- $4,330/yr
For passive investors: Depreciation is non-cash, so a rental often shows a tax loss while cash-flowing — sheltering income. Rental losses are passive: they offset passive income freely, and up to $25,000/yr can offset ordinary (W-2) income if you actively participate and your MAGI is under $100k (phasing out to $0 by $150k); unused losses carry forward. On sale, claimed depreciation is recaptured at up to 25%, and gains may owe capital-gains tax (a 1031 exchange can defer both). Figures are a year-1 estimate at your 24.0% rate — not tax advice; consult a CPA.
Schools (NCES district)
- District
- Allentown City SD
- NCES district ID
- 4202280
- Math proficiency
- 10% ▼ -10.00%
- Reading proficiency
- 20% ▼ -15.00%
- Median HH income
- $36,337
- Composite
- 12.43/100
- National rank
- #9630
- State rank
- #513 of 539 in PA
Livability — Allentown
- Score
- 81/100
- State rank
- #171
- US rank
- #1440
Category grades
Schools grade is shown separately in the Schools card above.
Census & demographics
- Census place
- Allentown, PA
- County
- Lehigh County · 333,019 people
- City population
- 172,996
- Metro
- Allentown-Bethlehem-Easton, PA-NJ
- Population (ZIP)
- 51,001
- Household income
- $43,085
- Rent vs Own
- Severe rent burden
- 4313.0
Population outlook (Lehigh County) Hauer SSP2
- Today (2025)
- 392,957 people
- By 2030
- 408,319 · +3.9%
- By 2040
- 440,007 · +12.0%
- By 2050
- 475,940 · +21.1%
- By 2075
- 590,448 · +50.3%
- By 2100
- 690,314 · +75.7%
Race, ethnicity, and origin ACS 2023
- Neighborhood character
- Predominantly Hispanic (69%)
- Race & ethnicity
- Hispanic / Latino 69% Two or more races 28% White 18% Black 10%
- Hispanic origin (detail)
- Mexican 3% Puerto Rican 38% Dominican 22%
- Common ancestry
- Polish 1% Romanian 1% Hispanic 1%
- Foreign-born
- 22% · Canada, Jamaica
- Languages at home
- 45% English-only · Spanish 52% Arabic 2%
Political lean MEDSL · Lehigh
- 2024 margin
- Toss-up / Even · D 50.7% · R 48.0% · Other 1.2%
- 2008→2024 swing
- -12.9pp toward R · 2008: 15.6pp · 2024: 2.7pp
- All cycles
- 2024: D+2.7 2020: D+7.6 2016: D+4.4 2012: D+7.5 2008: D+15.6
Not yet ingested
- Civics
- —
Market trends
- HPI YoY
- ▼ -227.01%
- Current HPI
- 404.834
- Rent YoY
- ▲ 5.48%
- Metro
- Allentown-Bethlehem-Easton, PA-NJ
- State GDP YoY
- ▲ 1.68%
- F500 in state
- 34
Industry mix (Fortune 500 HQ in PA)
| Industry | F500 HQs | Revenue |
|---|---|---|
| Healthcare | 2 | $309B |
|
||
| Insurance | 2 | $27B |
|
||
| Telecommunications / Media | 1 | $124B |
|
||
| Industrial Distribution | 1 | $22B |
|
||
| Financial Services | 1 | $20B |
|
||
| Chemicals / Materials | 1 | $18B |
|
||
Price history
+988.1% since first listed47 events — show timeline
- 2026-05-23 Listed $210,000 GLVRMLS
- 2026-04-25 Listing Removed — GLVRMLS
- 2026-04-24 Listing Removed — BRIGHT MLS
- 2026-01-02 Price Changed $229,000 BRIGHT MLS
- 2026-01-02 Price Changed $229,000 GLVRMLS
- 2025-12-08 Price Changed $249,900 BRIGHT MLS
- 2025-12-08 Price Changed $249,900 GLVRMLS
- 2025-10-28 Listed $260,000 BRIGHT MLS
- 2025-10-27 Listed $260,000 GLVRMLS
- 2025-03-26 Listing Removed — GLVRMLS
- 2025-02-20 Listed $170,000 GLVRMLS
- 2021-08-15 Sold (MLS) $111,000 GLVRMLS
- 2021-08-15 Sold (MLS) $111,000 GLVRMLS
- 2021-07-29 Pending — GLVRMLS
- 2021-07-29 Pending — GLVRMLS
- 2021-07-23 Price Changed $115,000 GLVRMLS
- 2021-07-23 Price Changed $115,000 GLVRMLS
- 2021-07-23 Relisted — GLVRMLS
- 2021-07-23 Relisted — GLVRMLS
- 2021-06-16 Listing Removed — GLVRMLS
- 2021-06-16 Listing Removed — GLVRMLS
- 2021-05-06 Relisted — GLVRMLS
- 2021-05-05 Listed $109,900 GLVRMLS
- 2021-05-05 Listed $109,900 GLVRMLS
- 2011-01-31 Listing Removed — GLVRMLS
- 2010-07-05 Listed $117,900 GLVRMLS
- 2010-06-30 Listing Removed — GLVRMLS
- 2010-03-16 Listed $124,900 GLVRMLS
- 2009-12-08 Listing Removed — GLVRMLS
- 2009-10-06 Listed $118,900 GLVRMLS
- 2009-10-06 Listing Removed — GLVRMLS
- 2009-06-08 Listed $119,900 GLVRMLS
- 2009-05-01 Listing Removed — GLVRMLS
- 2009-04-20 Sold (Public Records) $70,000 Public Records
- 2008-10-10 Listed $104,900 GLVRMLS
- 2007-05-16 Listing Removed — GLVRMLS
- 2007-03-15 Listed $159,900 GLVRMLS
- 2005-01-28 Sold (MLS) $54,500 GLVRMLS
- 2004-11-16 Listed $54,500 GLVRMLS
- 2002-05-03 Sold (Public Records) $65,000 Public Records
- 2002-04-15 Sold (MLS) $29,050 GLVRMLS
- 2002-02-21 Listed $28,000 GLVRMLS
- 2002-02-01 Sold (Public Records) $43,250 Public Records
- 2002-01-31 Sold (MLS) $43,250 GLVRMLS
- 2001-12-03 Listed $49,900 GLVRMLS
- 1999-12-02 Sold (Public Records) $42,000 Public Records
- 1995-10-01 Sold (Public Records) $19,300 Public Records
Property tax history
-2.0%/yrLatest (2026): $3,179 · +0.7% YoY. Source: county tax records.
Cash-flow waterfall
monthlySold comps — $/sqft
last 12 mo · ≤1 miLoading sold comps…