1204 S 14 1/2 St · McAllen, TX
Flood risk 1/10 · Minimal
- FEMA flood zone
- X (shaded)
- Chance of flooding over 30 yrs
- 0.0%
- Est. flood insurance / yr
- $507 – $1,088
Fire risk 1/10 · Minimal
- Est. fire insurance / yr
- $1,222 – $2,270
Heat risk 9/10 · Severe
- Hot days now (above 111°F)
- 7 days/yr
- Hot days in 30 yrs
- 22 days/yr
Wind risk 8/10 · Major
- Chance of severe wind over 30 yrs
- 99.0%
Air-quality risk 3/10 · Minor
- Unhealthy air days now
- 1 days/yr
- Unhealthy air days in 30 yrs
- 4 days/yr
Risk factors via First Street. Map © Google.
Why this score? — see what drove the B+ grade
The composite is a weighted blend of 9 inputs, each scored 0–100. Each bar is that input's sub-score; the figure is the points it added to the 100-point composite (weight × sub-score).
- Cash flow +30.0/30.0
- ARV discount +15.0/15.0
- 1% rule +10.0/10.0
- DSCR +10.0/10.0
- Livability +3.8/5.0
- Schools +3.3/10.0
- Rent growth +2.9/5.0
- Condition / age +2.5/5.0
- Appreciation +0.0/10.0
$75,000
🖨 Deal sheet 📄 Offer letter ✓ Due diligence
Listing remarks
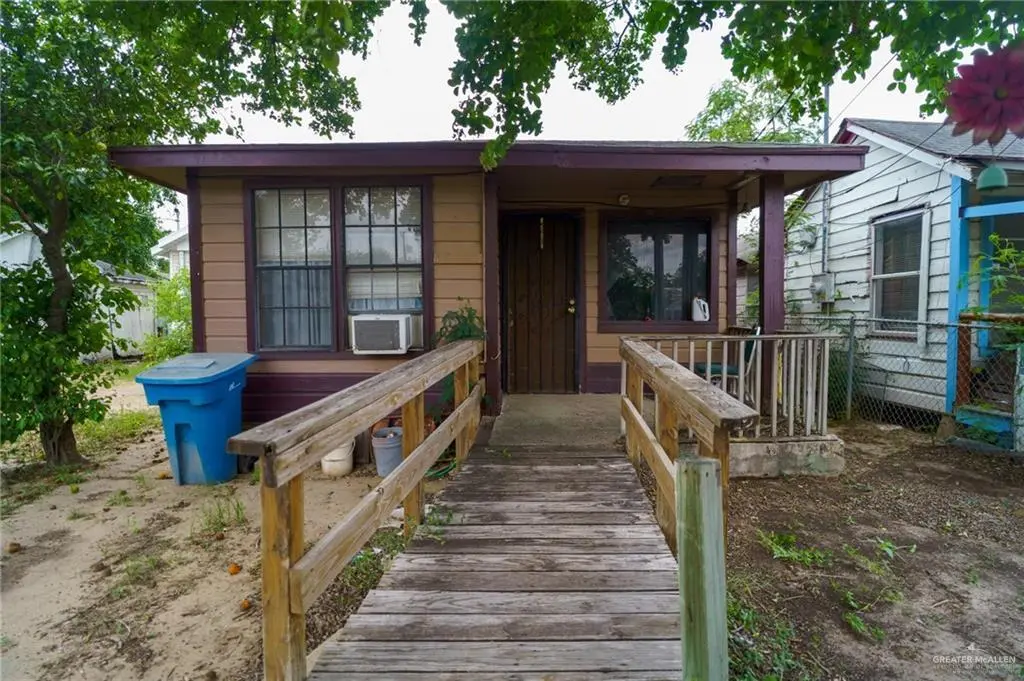
Home for sale in McAllen, TX! Calling all investors to come view this 1 bedroom 1 bath in the heart of McAllen. This potential investment property is ready to be remolded and brought back to life. Perfect for RENTAL INCOME or a FLIP. Conveniently located Downtown with easy access to the Expressway 83. Add to your investment portfolio and schedule your showing today. Motivated seller! Bring all offers.
Key facts
- Easy access
- Investment property
- Downtown mcallen
Tags
Property features AI
Finance
- Other: Lot dimensions approximately 50 x 80 (about 4,000 sq ft)
- HOA & community: No homeowners association
Exterior
- Parking: No garage or carport; No covered parking; No designated parking spaces
- Utilities: Public water; City sewer
- Home design: Single-story frame/wood residence; Shingle roof; Entry on corner lot
- Construction: Frame/wood construction; Pillar/post/pier foundation; Built with shingle roof
- Exterior features: Mature trees; Paved road access; Corner lot
Interior
- Kitchen: No conveying appliances
- Bedrooms: Living area includes bedroom space
- Flooring: Vinyl flooring
- Bathrooms: 1 full bathroom
- Interior features: Laminate countertops; Ceiling fan(s); Double-pane windows; Drapes and mini blinds
- Laundry & utility: Dedicated laundry room; Water heater (other)
Neighborhood map
What this means for you Summary
Snapshot
- This is a 2-bed/1.0-bath single-family listed at $75k.
Deal economics
- At list price, monthly cash flow is $399 ($5k/yr) — positive.
- The deal already cash-flows at list — no discount required.
- Meets the 1% rule at list price ($1k rent vs $75k).
- Recommended offer: $74k (1.5% below list) — sets the bar for market timing.
- Cap rate 12.7% vs local median 3.7% in McAllen — top-decile yield for the area; either an underpriced asset or a hidden risk that comps aren't pricing in. Stress-test before assuming the spread holds.
Location & tenants
- Location reads 76/100 on livability (#119 in TX, #3,771 nationally) — a middle-class / working-renter tenant base. Strengths: cost of living A+, housing A+, health & safety A+; Watch: employment D, amenities F, commute F.
- Mcallen ISD (urban): math 34% / reading 45% proficiency, ranked #440 of 826 in TX (top 53%) — families likely to look elsewhere, expect single-tenant / working-renter base with shorter leases.
- Zoned schools: Alvarez El (math 12% / reading 17%, grade F, #4,048 of 4,322 statewide, top 95%, 461 students, 96% FRL); Brown Middle (math 24% / reading 17%, grade F, #1,407 of 1,662 statewide, top 86%, 585 students, 90% FRL); Rowe H S (math 25% / reading 53%, grade F, #859 of 1,632 statewide, top 53%, 1,944 students, 74% FRL) — zoned schools average 87% FRL vs 50% district-wide (36 pts higher); higher-poverty schools than district average — tighter screening recommended.
- Zoned-school proficiency averages 25% at this address vs 40% district-wide (-15 pts) — the specific schools serving this property underperform the Mcallen ISD average; the district grade overstates school quality for this exact location.
- Market conditions: Rents rising (+1.8%/yr); 385 active listings in the ZIP; 19 comparable units currently listed for rent nearby; rentals lingering (median 44d on market — plan ~5-8 weeks vacancy on turnover, expect pricing pressure); 68% of comp listings sitting > 30 days — soft ceiling on asking rent; 7,378 units permitted in Hidalgo County in 2024 (641 in 5+ unit buildings).
Forward outlook
- Local home prices are declining (-3.0%/yr); year-one equity from $519 of loan paydown is wiped out by about $2k of value loss. Plan a longer hold.
- Hidalgo County population projected at +28% by 2050 — long-run rental-demand tailwind backs the buy-and-hold thesis.
- At projected returns (-3.0% appreciation + 1.8% rent growth), your $21k cash investment doubles in ~6 years — after that, you're playing with house money.
Negotiation context
- It's been on market 22 days — a 2% lower offer ($74k) is reasonable based on typical stale-listing flexibility.
Risks & watch-outs
- Climate carrying-cost: severe wind risk, 99% chance of damaging wind over 30y; extreme-heat days projected 7→22/yr by 2055 (HVAC capex compounding) — expect insurance premiums to compound above CPI over the hold.
Questions for the listing agent
- Is there a deadline driving the sale (1031 exchange, divorce, estate, relocation)? That informs how much negotiation room exists.
- Schools are B-rated — typically a magnet for longer-tenancy family renters. What's the average tenant stay here, and is there a school-zone premium baked into asking?
- What's the average days-on-market for RENTAL listings here right now (not sales)? A rising rental-DOM trend means longer vacancies and softer asking-rent achievability than the comps imply.
- What's the recent tenant-quality profile in this submarket — average credit score on applications, eviction rate, late-payment / NSF rate, and stable-employment percentage? A property-management company in the area should have these aggregated.
- How much new for-sale + rental construction is in the pipeline within 1–3 miles? Heavy new supply typically softens prices + rents 12–24 months out; constrained supply supports both.
Investment metrics
- 1% rule
- 1.52% ✓
- Cap rate
- 12.68%
- Cash-on-cash
- 22.81%
- DSCR
- 2.02
- GRM
- 5.5
CMA / ARV
- ARV (on-the-fly)
- $143,664
- Comps found
- 11
Show comp detail 11 sales within ~0.75 mi
| Address | Dist | Beds/Ba | Sqft | Sold | Price | $/sf | Match |
|---|---|---|---|---|---|---|---|
| 1203 S 19 1/2 St | 0.26mi | 2/2.0 | 1,008 (+2%) | 9mo | $160,000 | $159 | 72 |
| 1205 S 19 1/2 St | 0.26mi | 2/2.0 | 1,008 (+2%) | 11mo | $160,000 | $159 | 71 |
| 1203 S 16th St | 0.06mi | 3/2.0 (+1) | 900 (-8%) | 16mo | $145,000 | $161 | 61 |
| 2013 Newport Ave | 0.41mi | 1/1.0 (-1) | 868 (-12%) | 4mo | $57,000 | $66 | 53 |
| 2112 Newport Ave | 0.49mi | 3/1.0 (+1) | 910 (-8%) | 9mo | $160,000 | $176 | 52 |
| 825 Kennedy Ave | 0.42mi | 2/1.0 | 1,064 (+8%) | 22mo | $125,000 | $117 | 48 |
| 1702 Oakland Ave | 0.20mi | 3/2.0 (+1) | 1,118 (+14%) | 16mo | $163,000 | $146 | 46 |
| 812 Galveston Ave | 0.56mi | 2/1.0 | 1,067 (+8%) | 17mo | $197,000 | $185 | 45 |
| 909 S 17 1/2 St | 0.40mi | 3/2.0 (+1) | 1,080 (+10%) | 14mo | $99,900 | $93 | 44 |
| 2213 Galveston Ave | 0.61mi | 2/2.0 | 1,091 (+11%) | 10mo | $125,000 | $115 | 41 |
| 2016 Dallas Ave | 0.65mi | 2/2.5 | 1,116 (+13%) | 21mo | $128,000 | $115 | 24 |
Match score weights: distance 35% · size 25% · config 20% · recency 20%. Top-matched comps best support the ARV.
Projected returns pro-forma
-3.0% appreciation · 1.78% rent growth · sell at horizon
- IRR
- 14.4%
- Equity multiple
- 1.57×
- Total profit
- $11,899
- Equity at exit
- $11,183
- IRR
- 22.2%
- Equity multiple
- 2.79×
- Total profit
- $37,603
- Equity at exit
- $6,485
Cash invested: $21,000 (down + closing). Projections, not guarantees.
Landlord ↔ Tenant lean methodology
- Overall (STATE)
- 87 Strongly Landlord-Friendly
- State Texas
- 87 Strongly Landlord-Friendly · R+5
- County
- — inherits STATE
- City
- — inherits STATE
ZIP-level market 78501
- Home prices YoY
- -23.3%
- Rents YoY
- 1.8%
- Active inventory
- 385
- Price-to-rent
- 5.5×
Monthly cashflow live
- Estimated rent
- $1,137 high interval (Pro) →
- Mortgage (P&I)
- −$393
- Tax from tax record
- −$74 /mo · $891/yr
- Insurance
- −$31
- HOA
- −$0
- Vacancy / Maint / Mgmt
- −$239
- Net cashflow
- $399
Break-even live
UW: 25.0% down · 7.5% · 30yr · 1.5% tax · 5.0% vac · 8.0% maint · 8.0% mgmt
Financing live
Cash to close
- Down payment
- $18,750
- Closing costs
- $2,250
- Reserves months
- —
- Total cash needed
- —
Loan-product check · same deal, 3 products live
Conventional
25% down · 7.5% · 30yr
- Down + closing
- —
- Monthly P&I
- —
- Monthly cashflow
- —
- DSCR
- —
- Eligible?
- —
Personal DTI + credit; lowest rate.
DSCR
20% down · 8.5% · 30yr
- Down + closing
- —
- Monthly P&I
- —
- Monthly cashflow
- —
- DSCR
- —
- Eligible?
- —
No personal income docs; deal must DSCR.
Hard money
10% down · 12.0% · 12mo
- Down + closing
- —
- Monthly P&I
- —
- Monthly cashflow
- —
- DSCR
- —
- Eligible?
- —
Short-term bridge; refi at stabilization.
Rent comps 19 comps
| Address | Beds | Baths | Sqft | Rent | $/sqft | DOM | Units | Dist |
|---|---|---|---|---|---|---|---|---|
| 1510 Ithaca Ave #2 McAllen, TX | 2.0 | 1.5 | 998 | $1,000 | $1.00 | 23d | 1 | 0.21mi |
| 1515 S 16th St McAllen, TX | 2.0 | 1.0 | 1050 | $975 | $0.93 | 43d | 1 | 0.26mi |
| 1515 W Houston Ave McAllen, TX | 2.0 | 1.0 | 1050 | $1,800 | $1.71 | 43d | 1 | 0.26mi |
| 604 S 16th St Apt 5 McAllen, TX | 1.0 | 1.0 | 760 | $750 | $0.99 | 23d | 1 | 0.39mi |
| 901 Galveston Ave Unit C McAllen, TX | 2.0 | 2.0 | 888 | $950 | $1.07 | 14d | 1 | 0.50mi |
| 2108 Galveston Ave W Unit 4 McAllen, TX | 3.0 | 2.5 | 1064 | $1,500 | $1.41 | 43d | 1 | 0.57mi |
| 2108 Galveston Ave W Unit 5 McAllen, TX | 3.0 | 2.5 | 1064 | $1,350 | $1.27 | 43d | 1 | 0.57mi |
| 2114 Galveston Ave W Unit 3 McAllen, TX | 3.0 | 2.5 | 1064 | $1,350 | $1.27 | 43d | 1 | 0.58mi |
| 601 Kennedy Ave McAllen, TX | 3.0 | 2.0 | 936 | $1,350 | $1.44 | 43d | 1 | 0.59mi |
| 615 W Dallas Ave Apt A-3 McAllen, TX | 1.0 | 1.0 | 843 | $1,850 | $2.19 | 43d | 1 | 0.75mi |
| 615 W Dallas Ave Apt A-16 McAllen, TX | 2.0 | 2.0 | 1069 | $2,350 | $2.20 | 21d | 1 | 0.75mi |
| 1418 Beech Ave #16 McAllen, TX | 3.0 | 2.0 | 980 | $950 | $0.97 | 23d | 1 | 0.91mi |
| 503 N 11th St Apt 6 McAllen, TX | 1.0 | 1.0 | 640 | $700 | $1.09 | 43d | 1 | 1.11mi |
| 503 N 11th St Apt 2 McAllen, TX | 1.0 | 1.0 | 640 | $700 | $1.09 | 23d | 1 | 1.11mi |
| 317 S 28th St Unit 4 McAllen, TX | 2.0 | 1.0 | 800 | $750 | $0.94 | 43d | 1 | 1.21mi |
| 317 S 28th St Unit 3 McAllen, TX | 2.0 | 1.0 | 800 | $800 | $1.00 | 43d | 1 | 1.21mi |
| 601 N 6th St McAllen, TX | 3.0 | 1.5 | 1075 | $1,350 | $1.26 | 43d | 1 | 1.30mi |
| 2401 Gumwood Ave W Unit 8 McAllen, TX | 2.0 | 1.0 | 868 | $525 | $0.60 | 43d | 1 | 1.38mi |
| 917 N 21st St McAllen, TX | 2.0 | 1.0 | 758 | $1,200 | $1.58 | 43d | 1 | 1.47mi |
Listing history 17 events
-
2026-06-18days on market $75,000 Active 22 DOM
-
2026-06-17days on market $75,000 Active 21 DOM
-
2026-06-16days on market $75,000 Active 20 DOM
-
2026-06-15days on market $75,000 Active 19 DOM
-
2026-06-14days on market $75,000 Active 17 DOM
-
2026-06-10days on market $75,000 Active 14 DOM
-
2026-06-09days on market $75,000 Active 13 DOM
-
2026-06-08days on market $75,000 Active 12 DOM
-
2026-06-07days on market $75,000 Active 11 DOM
-
2026-06-05days on market $75,000 Active 8 DOM
-
2026-06-03days on market $75,000 Active 7 DOM
-
2026-06-02days on market $75,000 Active 6 DOM
-
2026-06-01days on market $75,000 Active 5 DOM
-
2026-05-31days on market $75,000 Active 4 DOM
-
2026-05-31days on market $75,000 Active 3 DOM
-
2026-05-27$75,000 Active
-
2025-08-14soldstatus
ⓘ Source: listings_history table (triggers on properties + properties_extension) + one-shot
backfill from property_details.listing_events for pre-trigger history.
Tax reassessment forecast TX · Resets to sale price
- Current annual tax
- $891 · $74/mo
- Projected year-2 tax
- $1,372 · $114/mo
- Expected delta
- +$481/yr (+$40/mo · 54.0%)
ⓘ Screening estimate from a state-policy table — verify with the county assessor before closing.
Climate risk First Street
- Flood 1/10 Low FEMA zone X (shaded) · 0% chance over 30 yrs
- Wildfire 1/10 Low
- Heat 9/10 Extreme 7 d/yr ≥111°F today · 22 d/yr by 30 yrs out
- Wind 8/10 Severe 99% chance of damaging wind over 30 yrs
- Air quality 3/10 Moderate 1 unhealthy d/yr today · 4 by 30 yrs out
Nearby sold comps map
Loading sold comps map…
Walkable amenities ~0.75 mi
Loading nearby amenities…
Taxation est. · year 1
- Rental income
- $13,641
- − Mortgage interest
- −$4,201
- − Property taxes
- −$891
- − Insurance
- −$375
- − Repairs & maintenance
- −$1,091
- − Management
- −$1,091
- − Depreciation
- −$2,182
- Taxable income
- $3,809
- Est. tax owed @ 24.0%
- −$914
- After-tax cash flow
- $3,876/yr
For passive investors: Depreciation is non-cash, so a rental often shows a tax loss while cash-flowing — sheltering income. Rental losses are passive: they offset passive income freely, and up to $25,000/yr can offset ordinary (W-2) income if you actively participate and your MAGI is under $100k (phasing out to $0 by $150k); unused losses carry forward. On sale, claimed depreciation is recaptured at up to 25%, and gains may owe capital-gains tax (a 1031 exchange can defer both). Figures are a year-1 estimate at your 24.0% rate — not tax advice; consult a CPA.
Schools (NCES district)
- District
- Mcallen ISD
- NCES district ID
- 4829670
- Math proficiency
- 34% ▼ -22.00%
- Reading proficiency
- 45% ▼ -5.00%
- Median HH income
- $40,805
- Composite
- 33.16/100
- National rank
- #5551
- State rank
- #440 of 826 in TX
Livability — McAllen
- Score
- 76/100
- State rank
- #119
- US rank
- #3771
Category grades
Schools grade is shown separately in the Schools card above.
Census & demographics
- Census place
- McAllen, TX
- County
- Hidalgo County · 623,128 people
- City population
- 144,650
- Metro
- McAllen-Edinburg-Mission, TX
- Population (ZIP)
- 58,935
- Household income
- $48,071
- Rent vs Own
- Severe rent burden
- 3043.0
Population outlook (Hidalgo County) Hauer SSP2
- Today (2025)
- 955,232 people
- By 2030
- 1,009,774 · +5.7%
- By 2040
- 1,120,332 · +17.3%
- By 2050
- 1,225,036 · +28.2%
- By 2075
- 1,439,189 · +50.7%
- By 2100
- 1,533,429 · +60.5%
Race, ethnicity, and origin ACS 2023
- Neighborhood character
- Predominantly Hispanic (89%)
- Race & ethnicity
- Hispanic / Latino 89% Two or more races 32% White 8% Asian 2%
- Hispanic origin (detail)
- Mexican 85%
- Foreign-born
- 28% · Canada, Vietnam
- Languages at home
- 22% English-only · Spanish 76%
Political lean MEDSL · Hidalgo
- 2024 margin
- Toss-up / Even · D 48.1% · R 51.0%
- 2008→2024 swing
- -41.6pp toward R · 2008: 38.7pp · 2024: -2.9pp
- All cycles
- 2024: R+2.9 2020: D+17.1 2016: D+40.5 2012: D+41.8 2008: D+38.7
Not yet ingested
- Civics
- —
Market trends
- HPI YoY
- ▼ -69.99%
- Current HPI
- 230.0213
- Rent YoY
- ▲ 1.78%
- Metro
- McAllen-Edinburg-Mission, TX
- State GDP YoY
- ▲ 3.95%
- F500 in state
- 110
Industry mix (Fortune 500 HQ in TX)
| Industry | F500 HQs | Revenue |
|---|---|---|
| Energy | 16 | $1,198B |
|
||
| Technology | 5 | $198B |
|
||
| Engineering / Construction | 4 | $72B |
|
||
| Energy Services | 3 | $60B |
|
||
| Utilities | 3 | $41B |
|
||
| Healthcare | 2 | $330B |
|
||
Price history
2 events — show timeline
- 2026-05-27 Listed $75,000 MCALLENMLS
- 2025-08-14 Sold (Public Records) — Public Records
Property tax history
+4.4%/yrLatest (2025): $891 · +7.0% YoY. Source: county tax records.
Cash-flow waterfall
monthlySold comps — $/sqft
last 12 mo · ≤1 miLoading sold comps…