 Triplex
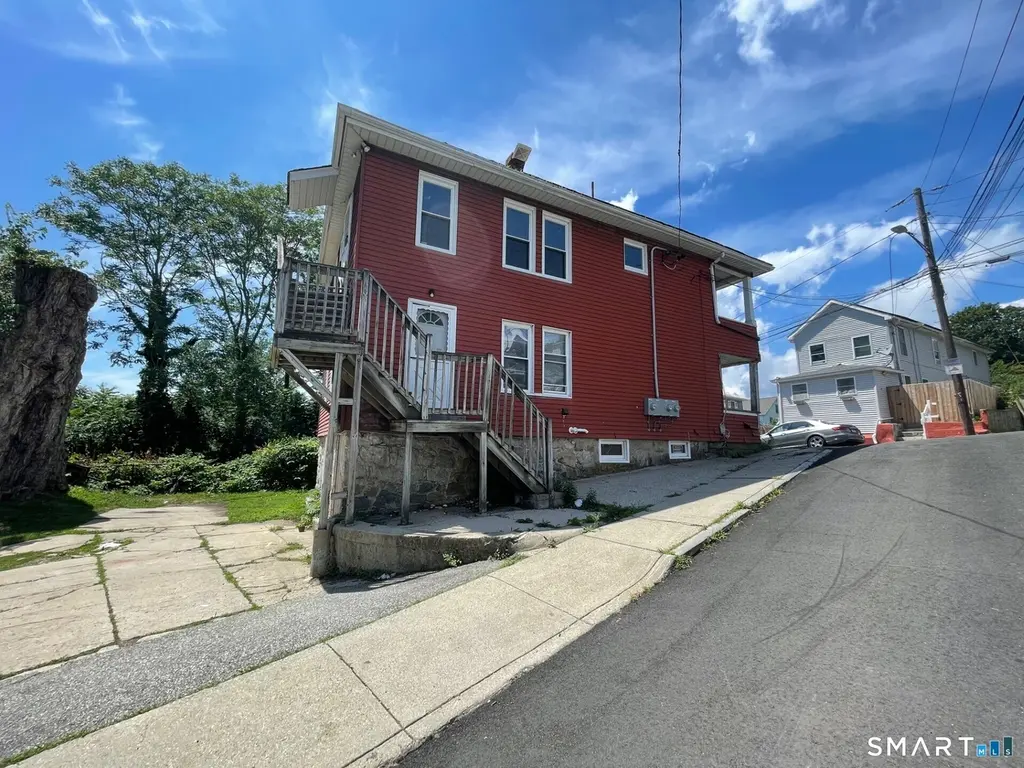
30 Chappell St · New London, CT
Flood risk 1/10 · Minimal
- FEMA flood zone
- X (unshaded)
- Chance of flooding over 30 yrs
- 0.0%
- Est. flood insurance / yr
- $507 – $1,088
Fire risk 1/10 · Minimal
- Est. fire insurance / yr
- $829 – $1,539
Heat risk 6/10 · Moderate
- Hot days now (above 94°F)
- 7 days/yr
- Hot days in 30 yrs
- 16 days/yr
Wind risk 8/10 · Major
- Chance of severe wind over 30 yrs
- 80.0%
Air-quality risk 3/10 · Minor
- Unhealthy air days now
- 3 days/yr
- Unhealthy air days in 30 yrs
- 4 days/yr
Risk factors via First Street. Map © Google.
Why this score? — see what drove the B grade
The composite is a weighted blend of 9 inputs, each scored 0–100. Each bar is that input's sub-score; the figure is the points it added to the 100-point composite (weight × sub-score).
- Cash flow +30.0/30.0
- ARV discount +13.2/15.0
- 1% rule +10.0/10.0
- DSCR +10.0/10.0
- Livability +3.7/5.0
- Rent growth +2.7/5.0
- Condition / age +2.5/5.0
- Schools +1.4/10.0
- Appreciation +0.0/10.0
$278,000
🖨 Deal sheet 📄 Offer letter ✓ Due diligence
Multi-family units
County records classify this as Multi-Family (2-4 Unit). Listing-text estimate: 3 units. confirmed
Listing remarks MLS
INVESTORS TAKE NOTE! Prime 3-Family Property Opportunity. Offers excellent potential for investors or owner-occupants looking to build equity. Featuring separate utilities, the property includes two new natural gas heating systems, updated electrical with three new circuit breaker panels, new PEX plumbing, and new windows. Renovations are already underway with additional materials on-site, including two new shower enclosures, toilets, and more, providing a great head start for the next owner. 1st & 2nd Floors: Each unit features 2 bedrooms, a living room, eat-in kitchen, laundry area, and porch. Basement Unit: 1-bedroom efficiency apartment. Ideally situated near major employers and attractions, including the U.S. Coast Guard Academy, Naval Submarine Base New London, Electric Boat, as well as downtown New London with its shops, restaurants, train station, Ocean Beach Park, and the Cross Sound Ferry. Sold AS-IS. A fantastic opportunity for contractors and seasoned investors to complete the renovation and maximize returns.
Key facts
- Updated electrical
- New pex plumbing
- New toilets
Tags
Neighborhood map
What this means for you Summary
Snapshot
- This is a 2×5bd/3.0ba + 1×1bd/1.0ba units multifamily listed at $278k.
Deal economics
- At list price, monthly cash flow is $3k ($33k/yr) — positive. Per door: $926/mo.
- The deal already cash-flows at list — no discount required.
- Meets the 1% rule at list price ($6k rent vs $278k).
- Recommended offer: $270k (3.0% below list) — sets the bar for market timing.
- Cap rate 18.3% vs local median 4.3% in New London — top-decile yield for the area; either an underpriced asset or a hidden risk that comps aren't pricing in. Stress-test before assuming the spread holds.
Location & tenants
- Location reads 74/100 on livability (#66 in CT, #4,772 nationally) — a middle-class / working-renter tenant base. Strengths: health & safety A+, housing A-, crime B+; Watch: employment D+, schools F, amenities F.
- New London School District (urban): math 11% / reading 21% proficiency, ranked #149 of 153 in CT (top 97%) — low school quality limits family demand, transient renter base, plan for 1-2y turnover; 72% free/reduced lunch — lower-income household profile, screen leases tightly.
- Market conditions: Rents flat; 69 active listings in the ZIP; 3 comparable units currently listed for rent nearby; rentals at typical pace (median 21d on market — plan ~3-4 weeks tenant-placement turnaround); 487 units permitted in Southeastern Connecticut Planning Region in 2024 (244 in 5+ unit buildings).
- At $5,812/mo this rent would consume 118% of the median local household income ($59k/yr) (locally 2014% of renters already pay >50% of income on rent) — very limited rent-growth headroom before tenants either downsize or default.
Forward outlook
- Local home prices are declining (-3.0%/yr); year-one equity from $2k of loan paydown is wiped out by about $8k of value loss. Plan a longer hold.
- At projected returns (-3.0% appreciation + 0.7% rent growth), your $78k cash investment doubles in ~3 years — after that, you're playing with house money.
Negotiation context
- It's been on market 59 days — a 3% lower offer ($270k) is reasonable based on typical stale-listing flexibility.
- 3 sale attempts since 14y ago; this cycle's ask has dropped $20k (7%) from the opening price — seller is motivated, your offer sets the floor, not the list.
- Current owner paid $36k; list at $278k implies a 672% gain — meaningful room to come down on a strong offer.
Risks & watch-outs
- Watch-outs: built in 1890 — expect roof / HVAC / electrical / plumbing capex.
- Climate carrying-cost: severe wind risk, 80% chance of damaging wind over 30y; extreme-heat days projected 7→16/yr by 2055 (HVAC capex compounding) — expect insurance premiums to compound above CPI over the hold.
Questions for the listing agent
- It's been on market 59 days. Have you received any prior offers? Is the seller open to a 3% concession, seller financing, or rate buy-down credit?
- Can we see the unit-by-unit rent roll, current vacancy, and any below-market leases? What's the average tenancy length?
- What capital expenditures (roof, boiler, parking lot, exteriors) have been made in the last 5 years, and what's planned in the next 2?
- Built in 1890 — when were the roof, HVAC, electrical panel, plumbing, and water heater last replaced?
- Is there a deadline driving the sale (1031 exchange, divorce, estate, relocation)? That informs how much negotiation room exists.
- Schools are F-rated, which usually means shorter tenancies and higher turnover. Who's the typical renter profile here, and what's been the actual vacancy rate?
- What's the average days-on-market for RENTAL listings here right now (not sales)? A rising rental-DOM trend means longer vacancies and softer asking-rent achievability than the comps imply.
- What's the recent tenant-quality profile in this submarket — average credit score on applications, eviction rate, late-payment / NSF rate, and stable-employment percentage? A property-management company in the area should have these aggregated.
- How much new apartment / multifamily construction is in the pipeline within 1–3 miles? Heavy new supply (>2% of stock underway) typically softens rents 12–24 months out; light construction supports rent growth.
Investment metrics
- 1% rule
- 2.09% ✓
- Cap rate
- 18.29%
- Cash-on-cash
- 42.84%
- DSCR
- 2.91
- GRM
- 4.0
CMA / ARV
- ARV (median comp)
- $318,682
- List price
- $278,000
- Delta
- -12.77%
- Verdict
- UNDERPRICED
- Comps
- 20 within 1.0 mi
Show comp detail 10 sales within ~0.75 mi
| Address | Dist | Beds/Ba | Sqft | Sold | Price | $/sf | Match |
|---|---|---|---|---|---|---|---|
| 90 Summer St | 0.39mi | 4/3.0 (-1) | 1,536 (-4%) | 1mo | $330,000 | $215 | 70 |
| 31 Grand St | 0.33mi | 4/2.0 (-1) | 1,666 (+4%) | 2mo | $295,000 | $177 | 67 |
| 25 W Coit St | 0.28mi | 4/2.0 (-1) | 1,680 (+5%) | 10mo | $280,000 | $167 | 62 |
| 9 Blackhall Ct | 0.21mi | 4/3.0 (-1) | 1,384 (-14%) | 8mo | $355,000 | $257 | 56 |
| 26 Connecticut Ave | 0.27mi | 5/2.0 | 1,776 (+11%) | 11mo | $330,000 | $186 | 56 |
| 2 Marshall Pl | 0.32mi | 4/2.0 (-1) | 1,687 (+5%) | 16mo | $305,000 | $181 | 53 |
| 42 Spring St | 0.42mi | 4/2.0 (-1) | 1,760 (+10%) | 2mo | $360,000 | $205 | 53 |
| 12 Mountain Ave | 0.26mi | 4/— (-1) | 1,792 (+12%) | 15mo | $350,000 | $195 | 51 |
| 29 Cape Ann Ct | 0.33mi | 4/3.0 (-1) | 1,806 (+13%) | 11mo | $249,900 | $138 | 49 |
| 845 Bank St | 0.51mi | 6/2.0 (+1) | 1,824 (+14%) | 10mo | $390,000 | $214 | 36 |
Match score weights: distance 35% · size 25% · config 20% · recency 20%. Top-matched comps best support the ARV.
Projected returns pro-forma
-3.0% appreciation · 0.7% rent growth · sell at horizon
- IRR
- 37.0%
- Equity multiple
- 2.53×
- Total profit
- $118,796
- Equity at exit
- $41,451
- IRR
- 42.5%
- Equity multiple
- 4.60×
- Total profit
- $279,888
- Equity at exit
- $24,036
Cash invested: $77,840 (down + closing). Projections, not guarantees.
Landlord ↔ Tenant lean methodology
- Overall (STATE)
- 27 Tenant-Leaning
- State Connecticut
- 27 Tenant-Leaning · D+7
- County
- — inherits STATE
- City
- — inherits STATE
ZIP-level market 06320
- Home prices YoY
- -20.7%
- Rents YoY
- 0.7%
- Active inventory
- 69
- Price-to-rent
- 10.7×
Monthly cashflow live
- Estimated rent
- $5,812 medium interval (Pro) →
- Mortgage (P&I)
- −$1,458
- Tax from tax record
- −$239 /mo · $2,870/yr
- Insurance
- −$116
- HOA
- −$0
- Vacancy / Maint / Mgmt
- −$1,221
- Net cashflow
- $2,779
Break-even live
3-unit breakdown (identical units grouped — click to expand)
| Units | Beds | Baths | Est. rent |
|---|---|---|---|
| 2× units | 5 | 3 | $4,346 |
| #1 | 5 | 3 | $2,173 |
| #2 | 5 | 3 | $2,173 |
| 1× unit | 1 | 1 | $1,465 |
| Total (3 units) | $5,812 | ||
UW: 25.0% down · 7.5% · 30yr · 1.5% tax · 5.0% vac · 8.0% maint · 8.0% mgmt
Financing live
Cash to close
- Down payment
- $69,500
- Closing costs
- $8,340
- Reserves months
- —
- Total cash needed
- —
Loan-product check · same deal, 3 products live
Conventional
25% down · 7.5% · 30yr
- Down + closing
- —
- Monthly P&I
- —
- Monthly cashflow
- —
- DSCR
- —
- Eligible?
- —
Personal DTI + credit; lowest rate.
DSCR
20% down · 8.5% · 30yr
- Down + closing
- —
- Monthly P&I
- —
- Monthly cashflow
- —
- DSCR
- —
- Eligible?
- —
No personal income docs; deal must DSCR.
Hard money
10% down · 12.0% · 12mo
- Down + closing
- —
- Monthly P&I
- —
- Monthly cashflow
- —
- DSCR
- —
- Eligible?
- —
Short-term bridge; refi at stabilization.
Rent comps 3 comps
| Address | Beds | Baths | Sqft | Rent | $/sqft | DOM | Units | Dist |
|---|---|---|---|---|---|---|---|---|
| 78 West St Unit 2A New London, CT | 4.0 | 4.0 | 1250 | $1,895 | $1.52 | 21d | 1 | 0.34mi |
| 32 Berkeley Ave Unit 2 New London, CT | 4.0 | 1.0 | 1800 | $2,500 | $1.39 | 44d | 1 | 0.56mi |
| 47 Perry St Unit 2 New London, CT | 4.0 | 2.0 | 1920 | $2,750 | $1.43 | 13d | 1 | 1.13mi |
Listing history 24 events
-
2026-06-19days on market $278,000 Active 59 DOM
-
2026-06-18pricedays on market $278,000 Active 58 DOM
-
2026-06-17days on market $288,000 Active 57 DOM
-
2026-06-16days on market $288,000 Active 56 DOM
-
2026-06-15days on market $288,000 Active 55 DOM
-
2026-06-14days on market $288,000 Active 53 DOM
-
2026-06-13days on market $288,000 Active 52 DOM
-
2026-06-10days on market $288,000 Active 50 DOM
-
2026-06-09days on market $288,000 Active 49 DOM
-
2026-06-08days on market $288,000 Active 48 DOM
-
2026-06-07days on market $288,000 Active 47 DOM
-
2026-06-05days on market $288,000 Active 44 DOM
-
2026-06-03days on market $288,000 Active 43 DOM
-
2026-06-02days on market $288,000 Active 42 DOM
-
2026-06-01days on market $288,000 Active 41 DOM
-
2026-05-31days on market $288,000 Active 40 DOM
-
2026-05-30days on market $288,000 Active 39 DOM
-
2026-04-21$298,000 Active 1041-char remark
Show marketing remark (1041 chars)
INVESTORS TAKE NOTE! Prime 3-Family Property Opportunity. Offers excellent potential for investors or owner-occupants looking to build equity. Featuring separate utilities, the property includes two new natural gas heating systems, updated electrical with three new circuit breaker panels, new PEX plumbing, and new windows. Renovations are already underway with additional materials on-site, including two new shower enclosures, toilets, and more, providing a great head start for the next owner. 1st & 2nd Floors: Each unit features 2 bedrooms, a living room, eat-in kitchen, laundry area, and porch. Basement Unit: 1-bedroom efficiency apartment. Ideally situated near major employers and attractions, including the U.S. Coast Guard Academy, Naval Submarine Base New London, Electric Boat, as well as downtown New London with its shops, restaurants, train station, Ocean Beach Park, and the Cross Sound Ferry. Sold AS-IS. A fantastic opportunity for contractors and seasoned investors to complete the renovation and maximize returns.
-
2015-12-31soldstatus $36,000 360-char remark
Show marketing remark (360 chars)
Perfect opportunity to live in one unit and rent the other. This 2 family is close to commuting and conveniently located. Don't miss out! Employees and family members residing with employees of JPMorgan Chase Bank, N.A, its affiliates or subsidiaries are strictly prohibited from directly or indirectly purchasing any property owned by JPMorgan Chase Bank, N.A
-
2015-12-19historical 360-char remark
Show marketing remark (360 chars)
Perfect opportunity to live in one unit and rent the other. This 2 family is close to commuting and conveniently located. Don't miss out! Employees and family members residing with employees of JPMorgan Chase Bank, N.A, its affiliates or subsidiaries are strictly prohibited from directly or indirectly purchasing any property owned by JPMorgan Chase Bank, N.A
-
2015-11-03$37,500 360-char remark
Show marketing remark (360 chars)
Perfect opportunity to live in one unit and rent the other. This 2 family is close to commuting and conveniently located. Don't miss out! Employees and family members residing with employees of JPMorgan Chase Bank, N.A, its affiliates or subsidiaries are strictly prohibited from directly or indirectly purchasing any property owned by JPMorgan Chase Bank, N.A
-
2012-09-26historical
-
2012-03-27$125,000
-
1988-01-19soldstatus $102,000
ⓘ Source: listings_history table (triggers on properties + properties_extension) + one-shot
backfill from property_details.listing_events for pre-trigger history.
Tax reassessment forecast CT · Partial reset (capped growth)
- Current annual tax
- $2,870 · $239/mo
- Projected year-2 tax
- $4,410 · $367/mo
- Expected delta
- +$1,540/yr (+$128/mo · 53.6%)
ⓘ Screening estimate from a state-policy table — verify with the county assessor before closing.
Climate risk First Street
- Flood 1/10 Low FEMA zone X (unshaded) · 0% chance over 30 yrs
- Wildfire 1/10 Low
- Heat 6/10 Major 7 d/yr ≥94°F today · 16 d/yr by 30 yrs out
- Wind 8/10 Severe 80% chance of damaging wind over 30 yrs
- Air quality 3/10 Moderate 3 unhealthy d/yr today · 4 by 30 yrs out
Nearby sold comps map
Loading sold comps map…
Walkable amenities ~0.75 mi
Loading nearby amenities…
Taxation est. · year 1
- Rental income
- $69,744
- − Mortgage interest
- −$15,572
- − Property taxes
- −$2,870
- − Insurance
- −$1,390
- − Repairs & maintenance
- −$5,580
- − Management
- −$5,580
- − Depreciation
- −$8,087
- Taxable income
- $30,665
- Est. tax owed @ 24.0%
- −$7,360
- After-tax cash flow
- $25,984/yr
For passive investors: Depreciation is non-cash, so a rental often shows a tax loss while cash-flowing — sheltering income. Rental losses are passive: they offset passive income freely, and up to $25,000/yr can offset ordinary (W-2) income if you actively participate and your MAGI is under $100k (phasing out to $0 by $150k); unused losses carry forward. On sale, claimed depreciation is recaptured at up to 25%, and gains may owe capital-gains tax (a 1031 exchange can defer both). Figures are a year-1 estimate at your 24.0% rate — not tax advice; consult a CPA.
Schools (NCES district)
- District
- New London School District
- NCES district ID
- 0902820
- Math proficiency
- 11% ▼ -11.00%
- Reading proficiency
- 21% ▼ -11.00%
- Median HH income
- $40,640
- Composite
- 13.66/100
- National rank
- #9502
- State rank
- #149 of 153 in CT
Livability — New London
- Score
- 74/100
- State rank
- #66
- US rank
- #4772
Category grades
Schools grade is shown separately in the Schools card above.
Census & demographics
- Census place
- New London, CT
- County
- New London County · 147,197 people
- City population
- 27,703
- Metro
- Norwich-New London, CT
- Population (ZIP)
- 27,703
- Household income
- $59,170
- Rent vs Own
- Severe rent burden
- 2014.0
Population outlook (Southeastern Connecticut County) Hauer SSP2
- By 2040
- 293,442
Race, ethnicity, and origin ACS 2023
- Neighborhood character
- Diverse neighborhood (Simpson 0.66)
- Race & ethnicity
- White 45% Hispanic / Latino 34% Black 13% Two or more races 13% Asian 2%
- Hispanic origin (detail)
- Mexican 1% Puerto Rican 17% Dominican 7%
- Common ancestry
- Romanian 3% Hispanic 3% Lithuanian 1%
- Foreign-born
- 19% · Canada, Jamaica
- Languages at home
- 67% English-only · Spanish 27% French/Haitian/Cajun 2% Other Indo-European 1%
Political lean MEDSL · Southeastern Connecticut
- 2024 margin
- D (+13.0) · D 55.6% · R 42.6% · Other 1.8%
- All cycles
- 2024: D+13.0
Not yet ingested
- Civics
- —
Market trends
- HPI YoY
- ▼ -71.39%
- Current HPI
- 273.3024
- Rent YoY
- ▲ 0.70%
- Metro
- Norwich-New London, CT
- State GDP YoY
- ▲ 1.06%
- F500 in state
- 38
Industry mix (Fortune 500 HQ in CT)
| Industry | F500 HQs | Revenue |
|---|---|---|
| Industrial Machinery | 4 | $38B |
|
||
| Insurance | 3 | $71B |
|
||
| Financial Services | 2 | $25B |
|
||
| Transportation / Logistics | 2 | $18B |
|
||
| Healthcare | 1 | $247B |
|
||
| Telecommunications | 1 | $55B |
|
||
Price history
+192.2% since first listed7 events — show timeline
- 2026-04-21 Listed $298,000 Smart MLS
- 2015-12-31 Sold (MLS) $36,000 Smart MLS
- 2015-12-19 Listing Removed — Smart MLS
- 2015-11-03 Listed $37,500 Smart MLS
- 2012-09-26 Listing Removed — Smart MLS
- 2012-03-27 Listed $125,000 Smart MLS
- 1988-01-19 Sold (Public Records) $102,000 Public Records
Property tax history
-0.2%/yrLatest (2023): $2,870 · -0.2% YoY. Source: county tax records.
Cash-flow waterfall
monthlySold comps — $/sqft
last 12 mo · ≤1 miLoading sold comps…