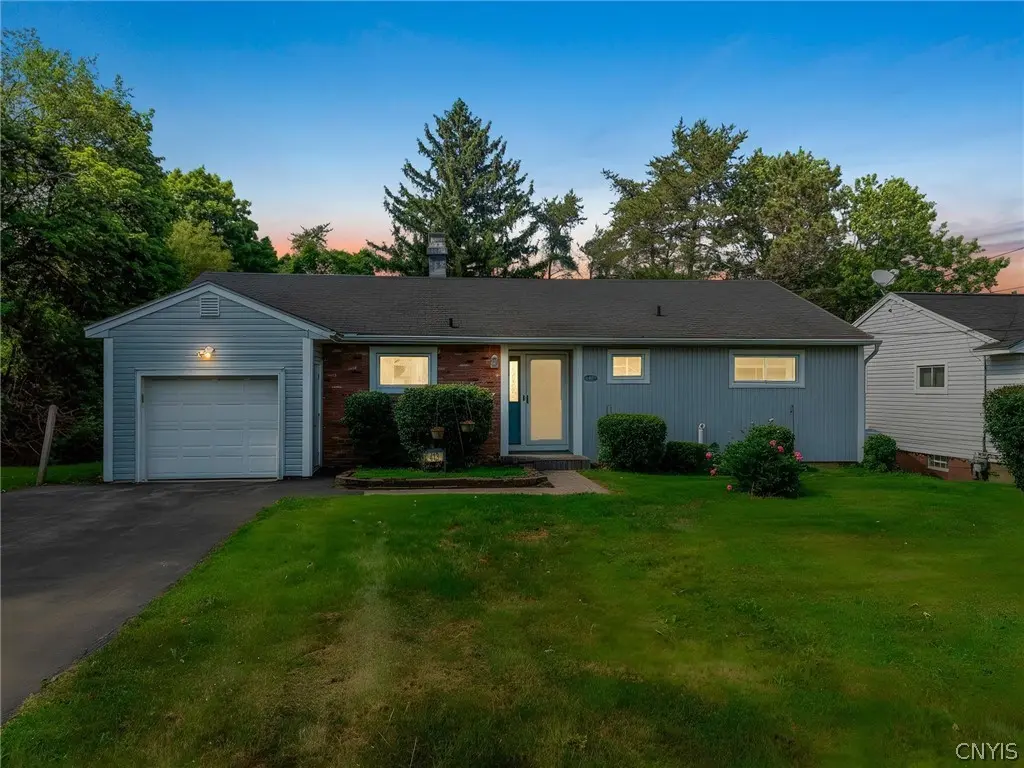
413 Mountainview Ave · Syracuse, NY
Flood risk 1/10 · Minimal
- FEMA flood zone
- X (unshaded)
- Chance of flooding over 30 yrs
- 0.0%
- Est. flood insurance / yr
- $473 – $860
Fire risk 1/10 · Minimal
- Est. fire insurance / yr
- $691 – $1,283
Heat risk 3/10 · Minor
- Hot days now (above 96°F)
- 7 days/yr
- Hot days in 30 yrs
- 16 days/yr
Wind risk 1/10 · Minimal
- Chance of severe wind over 30 yrs
- 1.0%
Air-quality risk 2/10 · Minimal
- Unhealthy air days now
- 0 days/yr
- Unhealthy air days in 30 yrs
- 1 days/yr
Risk factors via First Street. Map © Google.
Why this score? — see what drove the C+ grade
The composite is a weighted blend of 9 inputs, each scored 0–100. Each bar is that input's sub-score; the figure is the points it added to the 100-point composite (weight × sub-score).
- Cash flow +20.0/30.0
- ARV discount +11.5/15.0
- Appreciation +8.6/10.0
- DSCR +6.3/10.0
- 1% rule +4.5/10.0
- Livability +3.9/5.0
- Rent growth +2.5/5.0
- Condition / age +2.5/5.0
- Schools +1.8/10.0
$199,900
🖨 Deal sheet (PDF) 📄 Offer letter ✓ Due diligence
Listing remarks
Owned by the same family since approximately 1977, this ranch offers the convenience of one-level living with plenty of room to spread out, both inside and out. Hardwood floors run throughout much of the main level, while the finished walkout basement provides additional living space ideal for entertaining, game nights, a home office, hobbies, or simply relaxing. Step outside to enjoy the deck overlooking the fully fenced backyard, creating a great setting for summer barbecues, gatherings with friends, or a relaxing evening outdoors. A double-wide driveway provides ample parking, and the home’s convenient location puts you just minutes from Le Moyne College, shopping, restaurants, par
Key facts
- Convenient location
- Double wide driveway
- 7,753 sq ft lot
Tags
Property features AI
Exterior
- Parking: Attached garage with one garage space; Garage with electricity and garage door opener; Driveway; Garage storage
- Security: Owned security system; Radon mitigation system
- Utilities: Electricity connected (circuit breakers and fuses); Public water connected; Sewer connected; High-speed internet available; Cable available
- Home design: Single-story home; Existing structure
- Construction: Vinyl siding; Copper plumbing; Asphalt roof; Poured foundation
- Exterior features: Blacktop driveway; Deck; Fully fenced yard; Private yard; Near public transit; Rectangular residential lot; City street frontage
Interior
- Kitchen: Dishwasher; Free-standing range; Oven; Range hood; Refrigerator; Disposal; Exhaust fan; Water purifier (owned)
- Bedrooms: Three main-level bedrooms; Bedroom on main level
- Flooring: Carpet; Hardwood; Tile; Vinyl; Varied flooring
- Bathrooms: Two full bathrooms; One main-level bathroom
- Heating & cooling: Gas forced-air heating; Central air conditioning
- Interior features: Ceiling fan(s); Separate/formal dining room; Entrance foyer; Eat-in kitchen; Separate/formal living room; Home office; Living/dining room; Sliding glass door(s); Storage; Window treatments; Convertible bedroom; Programmable thermostat; Workshop; Drapes; Sliding doors; Accessible bedroom; No stairs
- Laundry & utility: Washer; Dryer; Laundry in basement
Neighborhood map
What this means for you Summary
Snapshot
- This is a 3-bed/1.0-bath single-family listed at $200k.
Deal economics
- At list price, monthly cash flow is $245 ($3k/yr) — positive.
- The deal already cash-flows at list — no discount required.
- To meet the 1% rule (rent ≥ 1% of price), the offer needs to be $189k (5.5% below list).
- Recommended offer: $189k (5.5% below list) — sets the bar for 1% rule.
Location & tenants
- Location reads 77/100 on livability (#187 in NY, #2,869 nationally) — a middle-class / working-renter tenant base. Strengths: amenities A+, commute A+, cost of living A+; Watch: crime F, employment D-.
- Syracuse City School District (urban): math 18% / reading 26% proficiency, ranked #590 of 590 in NY (top 100%) — low school quality limits family demand, transient renter base, plan for 1-2y turnover; 74% free/reduced lunch — lower-income household profile, screen leases tightly.
- Zoned schools: Hurlbut W Smith K-8 School (math 4% / reading 18%, grade F, #2,061 of 2,108 statewide, top 98%, 776 students, 83% FRL); Expeditionary Learning Middle School (math 17% / reading 32%, grade F, #611 of 729 statewide, top 88%, 170 students, 76% FRL); Nottingham High School (math 75% / reading 77%, grade A-, #616 of 1,100 statewide, top 57%, 1,226 students, 80% FRL).
- Zoned-school proficiency averages 37% at this address vs 22% district-wide (+15 pts) — the actual schools serving this property are materially stronger than the Syracuse City School District average implies; a family-tenant draw the district grade alone would hide.
- Market conditions: 25 active listings in the ZIP; 6 comparable units currently listed for rent nearby; rentals at typical pace (median 23d on market — plan ~3-4 weeks tenant-placement turnaround); solid renter incomes; 616 units permitted in Onondaga County in 2024 (256 in 5+ unit buildings).
Forward outlook
- In year one you build about $16k of equity ($1k loan paydown + $14k appreciation (7.2% local appreciation)).
- Onondaga County population projected to shrink 9% by 2050 — rents likely to lag national; underwrite the cash flow, not the appreciation.
- At projected returns (7.2% appreciation + 3.0% rent growth), your $56k cash investment doubles in ~3 years — after that, you're playing with house money.
- By year 3, paydown + projected appreciation supports a ~$39k cash-out refi (75% LTV) — recoverable capital for the next deal without selling this one.
Negotiation context
- Only 4 days on market — expect competitive offers; lowballing is unlikely to land.
Questions for the listing agent
- Built in 1975 — when were the roof, HVAC, electrical panel, plumbing, and water heater last replaced?
- Is there a deadline driving the sale (1031 exchange, divorce, estate, relocation)? That informs how much negotiation room exists.
- Schools are D-rated, which usually means shorter tenancies and higher turnover. Who's the typical renter profile here, and what's been the actual vacancy rate?
- Crime grade is F in this area — have there been break-ins, vandalism, or insurance claims at this property in the last 3 years? What carrier currently insures it and at what premium?
- What's the average days-on-market for RENTAL listings here right now (not sales)? A rising rental-DOM trend means longer vacancies and softer asking-rent achievability than the comps imply.
- What's the recent tenant-quality profile in this submarket — average credit score on applications, eviction rate, late-payment / NSF rate, and stable-employment percentage? A property-management company in the area should have these aggregated.
- How much new for-sale + rental construction is in the pipeline within 1–3 miles? Heavy new supply typically softens prices + rents 12–24 months out; constrained supply supports both.
Investment metrics
- 1% rule
- 0.95% ✗
- Cap rate
- 7.76%
- Cash-on-cash
- 5.25%
- DSCR
- 1.23
- GRM
- 8.8
CMA / ARV
- ARV (on-the-fly)
- $219,512
- Comps found
- 12
Show comp detail 12 sales within ~0.75 mi
| Address | Dist | Beds/Ba | Sqft | Sold | Price | $/sf | Match |
|---|---|---|---|---|---|---|---|
| 245 Mountainview Ave | 0.23mi | 3/1.0 | 1,196 (+0%) | 8mo | $172,500 | $144 | 82 |
| 501 Mountainview Ave | 0.13mi | 3/1.5 | 1,250 (+5%) | 6mo | $205,000 | $164 | 80 |
| 248 Delray Ave | 0.10mi | 3/1.0 | 1,080 (-10%) | 2mo | $205,000 | $190 | 78 |
| 703 Mountainview Ave | 0.27mi | 2/1.5 (-1) | 1,184 (-1%) | 2mo | $232,720 | $197 | 78 |
| 228 Fayette Blvd | 0.17mi | 3/1.5 | 1,264 (+6%) | 5mo | $172,500 | $136 | 76 |
| 217 Fayette Blvd | 0.16mi | 3/1.5 | 1,310 (+10%) | 7mo | $218,100 | $166 | 68 |
| 117 Foxboro Rd | 0.20mi | 2/1.5 (-1) | 1,259 (+6%) | 8mo | $250,000 | $199 | 68 |
| 318 Seeley Rd | 0.35mi | 4/1.0 (+1) | 1,080 (-10%) | 0mo | $210,000 | $194 | 63 |
| 202 Barrington Rd | 0.72mi | 4/2.0 (+1) | 1,198 (+0%) | 1mo | $220,000 | $184 | 56 |
| 203 Candee Ave | 0.45mi | 2/1.5 (-1) | 1,296 (+9%) | 5mo | $220,000 | $170 | 53 |
| 271 Fenway Dr | 0.73mi | 3/1.0 | 1,256 (+5%) | 8mo | $161,500 | $129 | 50 |
| 218 Arch St | 0.66mi | 4/2.0 (+1) | 1,080 (-10%) | 8mo | $205,000 | $190 | 37 |
Match score weights: distance 35% · size 25% · config 20% · recency 20%. Top-matched comps best support the ARV.
Projected returns pro-forma
7.21% appreciation · 3.0% rent growth · sell at horizon
- IRR
- 22.3%
- Equity multiple
- 2.57×
- Total profit
- $87,920
- Equity at exit
- $141,266
- IRR
- 20.7%
- Equity multiple
- 5.35×
- Total profit
- $243,551
- Equity at exit
- $270,862
Cash invested: $55,972 (down + closing). Projections, not guarantees.
Landlord ↔ Tenant lean methodology
- Overall (STATE)
- 15 Strongly Tenant-Friendly
- State New York
- 15 Strongly Tenant-Friendly · D+10
- County
- — inherits STATE
- City
- — inherits STATE
ZIP-level market 13224
- Home prices YoY
- 2.1%
- Active inventory
- 25
- Price-to-rent
- 8.8×
Monthly cashflow live
- Estimated rent
- $1,890 high interval (Pro) →
- Mortgage (P&I)
- −$1,048
- Tax from tax record
- −$117 /mo · $1,399/yr
- Insurance
- −$83
- HOA
- −$0
- Vacancy / Maint / Mgmt
- −$397
- Net cashflow
- $245
Break-even live
Sensitivity live
| Price | -10% $358 | -5% $301 | +0% $245 | +5% $188 | +10% $132 |
|---|---|---|---|---|---|
| Rent | -10% $96 | -5% $170 | +0% $245 | +5% $319 | +10% $394 |
| Rate | -1.0pp $345 | -0.5pp $296 | base $245 | +0.5pp $193 | +1.0pp $140 |
UW: 25.0% down · 7.5% · 30yr · 1.5% tax · 5.0% vac · 8.0% maint · 8.0% mgmt
Financing live
Cash to close
- Down payment
- $49,975
- Closing costs
- $5,997
- Reserves months
- —
- Total cash needed
- —
Loan-product check · same deal, 3 products live
Conventional
25% down · 7.5% · 30yr
- Down + closing
- —
- Monthly P&I
- —
- Monthly cashflow
- —
- DSCR
- —
- Eligible?
- —
Personal DTI + credit; lowest rate.
DSCR
20% down · 8.5% · 30yr
- Down + closing
- —
- Monthly P&I
- —
- Monthly cashflow
- —
- DSCR
- —
- Eligible?
- —
No personal income docs; deal must DSCR.
Hard money
10% down · 12.0% · 12mo
- Down + closing
- —
- Monthly P&I
- —
- Monthly cashflow
- —
- DSCR
- —
- Eligible?
- —
Short-term bridge; refi at stabilization.
Rent comps 6 comps
| Address | Beds | Baths | Sqft | Rent | $/sqft | DOM | Units | Dist |
|---|---|---|---|---|---|---|---|---|
| 213 Beattie St Syracuse, NY | 2.0 | 1.0 | 975 | $1,370 | $1.41 | 15d | 1 | 0.53mi |
| 118 Niven St Syracuse, NY | 3.0 | 1.0 | 1150 | $1,650 | $1.43 | 22d | 1 | 0.58mi |
| 121 Doll Pkwy Unit A Syracuse, NY | 4.0 | 2.0 | 1400 | $2,800 | $2.00 | 15d | 1 | 0.61mi |
| 99 Alpine Dr Unit 107-2 Syracuse, NY | 3.0 | 1.0 | 1100 | $1,700 | $1.55 | 45d | 1 | 0.90mi |
| 131 Dell St Unit 133 DELL Syracuse, NY | 4.0 | 1.0 | 853 | $450 | $0.53 | 45d | 1 | 1.32mi |
| 204 Mariposa St Unit pvt house Syracuse, NY | 3.0 | 1.0 | 1128 | $2,137 | $1.89 | 15d | 1 | 1.35mi |
Listing history 4 events
-
2026-06-15statusdays on market $199,900 Pending 4 DOM
-
2026-06-14days on market $199,900 Active 3 DOM
-
2026-06-13remarks 693-char remark
-
2026-06-13$199,900 Active 2 DOM
ⓘ Source: listings_history table (triggers on properties + properties_extension) + one-shot
backfill from property_details.listing_events for pre-trigger history.
Tax reassessment forecast NY · Partial reset (capped growth)
- Current annual tax
- $1,399 · $117/mo
- Projected year-2 tax
- $2,389 · $199/mo
- Expected delta
- +$989/yr (+$82/mo · 70.7%)
ⓘ Screening estimate from a state-policy table — verify with the county assessor before closing.
Climate risk First Street
- Flood 1/10 Low FEMA zone X (unshaded) · 0% chance over 30 yrs
- Wildfire 1/10 Low
- Heat 3/10 Moderate 7 d/yr ≥96°F today · 16 d/yr by 30 yrs out
- Wind 1/10 Low 100% chance of damaging wind over 30 yrs
- Air quality 2/10 Low 0 unhealthy d/yr today · 1 by 30 yrs out
Nearby sold comps map
Loading sold comps map…
Walkable amenities ~0.75 mi
Loading nearby amenities…
Taxation est. · year 1
- Rental income
- $22,679
- − Mortgage interest
- −$11,198
- − Property taxes
- −$1,399
- − Insurance
- −$1,000
- − Repairs & maintenance
- −$1,814
- − Management
- −$1,814
- − Depreciation
- −$5,815
- Taxable loss
- −$361
- Est. tax savings @ 24.0%
- +$87
- After-tax cash flow
- $3,025/yr
For passive investors: Depreciation is non-cash, so a rental often shows a tax loss while cash-flowing — sheltering income. Rental losses are passive: they offset passive income freely, and up to $25,000/yr can offset ordinary (W-2) income if you actively participate and your MAGI is under $100k (phasing out to $0 by $150k); unused losses carry forward. On sale, claimed depreciation is recaptured at up to 25%, and gains may owe capital-gains tax (a 1031 exchange can defer both). Figures are a year-1 estimate at your 24.0% rate — not tax advice; consult a CPA.
Schools (NCES district)
- District
- Syracuse City School District
- NCES district ID
- 3628590
- Math proficiency
- 18% ▼ -5.00%
- Reading proficiency
- 26% ▬ 0.00%
- Median HH income
- $32,097
- Composite
- 17.83/100
- National rank
- #9007
- State rank
- #590 of 590 in NY
Livability — Syracuse
- Score
- 77/100
- State rank
- #187
- US rank
- #2869
Category grades
Schools grade is shown separately in the Schools card above.
Census & demographics
- Census place
- Syracuse, NY
- County
- Onondaga County · 247,257 people
- City population
- 152,627
- Metro
- Syracuse, NY
- Population (ZIP)
- 8,659
- Household income
- $76,500
- Rent vs Own
- Severe rent burden
- 423.0
Population outlook (Onondaga County) Hauer SSP2
- Today (2025)
- 467,894 people
- By 2030
- 463,381 · -1.0%
- By 2040
- 447,697 · -4.3%
- By 2050
- 426,399 · -8.9%
- By 2075
- 373,661 · -20.1%
- By 2100
- 307,967 · -34.2%
Race, ethnicity, and origin ACS 2023
- Neighborhood character
- Diverse neighborhood (Simpson 0.67)
- Race & ethnicity
- White 47% Black 32% Two or more races 10% Hispanic / Latino 8% Asian 6%
- Hispanic origin (detail)
- Puerto Rican 3% Cuban 1% Dominican 2%
- Common ancestry
- Romanian 3% Arab 2% Subsaharan African 2%
- Foreign-born
- 16% · Canada, China, Jamaica
- Languages at home
- 84% English-only · Spanish 6% Arabic 4% Other Indo-European 2%
Political lean MEDSL · Onondaga
- 2024 margin
- D (+17.3) · D 58.6% · R 41.4%
- 2008→2024 swing
- -3.0pp toward R · 2008: 20.3pp · 2024: 17.3pp
- All cycles
- 2024: D+17.3 2020: D+20.6 2016: D+12.8 2012: D+21.1 2008: D+20.3
Not yet ingested
- Civics
- —
Market trends
- HPI YoY
- ▲ 7.21%
- Current HPI
- 350.9419
- Rent YoY
- —
- Metro
- Syracuse, NY
- State GDP YoY
- ▲ 2.60%
- F500 in state
- 92
Industry mix (Fortune 500 HQ in NY)
| Industry | F500 HQs | Revenue |
|---|---|---|
| Financial Services | 10 | $950B |
|
||
| Consumer Goods | 9 | $162B |
|
||
| Insurance | 4 | $225B |
|
||
| Telecommunications | 2 | $144B |
|
||
| Pharmaceuticals | 2 | $112B |
|
||
| Media / Entertainment | 2 | $69B |
|
||
Price history
1 event — show timeline
- 2026-06-10 Listed $199,900 CNYIS
Property tax history
+0.6%/yrLatest (2025): $1,399 · +0.0% YoY. Source: county tax records.
Cash-flow waterfall
monthlySold comps — $/sqft
last 12 mo · ≤1 miLoading sold comps…