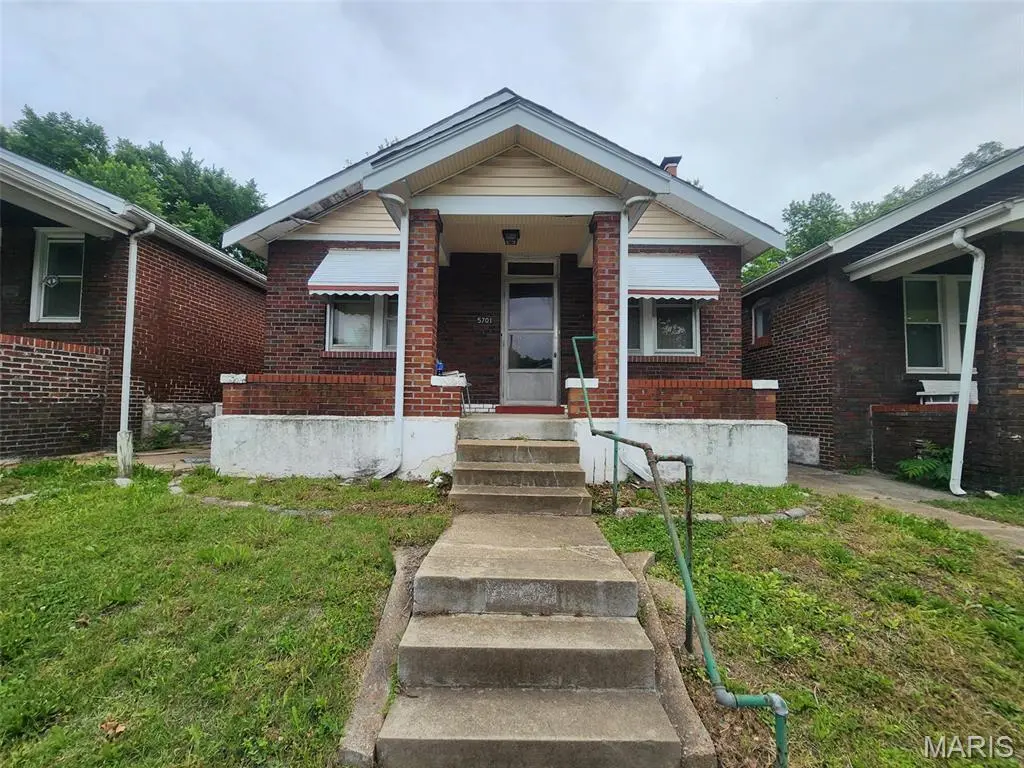
5701 Terry Ave · St. Louis, MO
Flood risk 1/10 · Minimal
- FEMA flood zone
- X (unshaded)
- Chance of flooding over 30 yrs
- 0.0%
- Est. flood insurance / yr
- $473 – $860
Fire risk 1/10 · Minimal
- Est. fire insurance / yr
- $1,054 – $1,958
Heat risk 5/10 · Moderate
- Hot days now (above 107°F)
- 7 days/yr
- Hot days in 30 yrs
- 20 days/yr
Wind risk 2/10 · Minimal
- Chance of severe wind over 30 yrs
- 1.0%
Air-quality risk 4/10 · Minor
- Unhealthy air days now
- 4 days/yr
- Unhealthy air days in 30 yrs
- 5 days/yr
Risk factors via First Street. Map © Google.
Why this score? — see what drove the B+ grade
The composite is a weighted blend of 9 inputs, each scored 0–100. Each bar is that input's sub-score; the figure is the points it added to the 100-point composite (weight × sub-score).
- Cash flow +30.0/30.0
- ARV discount +15.0/15.0
- 1% rule +10.0/10.0
- DSCR +10.0/10.0
- Appreciation +5.3/10.0
- Rent growth +2.5/5.0
- Livability +2.5/5.0
- Condition / age +2.5/5.0
- Schools +1.2/10.0
$30,000
🖨 Deal sheet 📄 Offer letter ✓ Due diligence
Listing remarks
Welcome to 5701 Terry Avenue, a well-maintained 2-bedroom, 1-bath home that has been lovingly owned by the same family for nearly 60 years. This property offers a rare opportunity for investors, first-time buyers, or anyone looking for an affordable home with key updates already completed. Recent improvements include updated plumbing, providing added peace of mind for the next owner. Inside, you'll find a functional floor plan with comfortable living spaces and plenty of potential to make it your own. Outside, the spacious backyard offers room for entertaining, gardening, pets, or future enhancements. Conveniently located just steps from Goodfellow Boulevard, this property provides easy acc
Key facts
- Spacious backyard
- Local amenities
- Updated plumbing
Tags
Property features AI
Finance
- Other: Approximately 900 above-grade finished area (public records)
Exterior
- Utilities: Public water; Public sewer; Electric service (other); No additional utilities listed
- Home design: Single family residence; Multi/split levels; Facing direction not provided
- Construction: Brick / brick veneer and other materials
- Exterior features: Level lot; Brick and brick veneer construction
Interior
- Bedrooms: 2 bedrooms (both on the upper level)
- Bathrooms: 1 full bathroom (on main/upper level)
- Heating & cooling: Forced air heating; Central air conditioning
- Interior features: Decorative ventless fireplace in the living room; Full concrete, walk-out basement
Neighborhood map
What this means for you Summary
Snapshot
- This is a 2-bed/1.0-bath single-family listed at $30k.
Deal economics
- At list price, monthly cash flow is $623 ($7k/yr) — positive.
- The deal already cash-flows at list — no discount required.
- Meets the 1% rule at list price ($1k rent vs $30k).
- Cap rate 31.2% vs local median 5.0% in St. Louis — top-decile yield for the area; either an underpriced asset or a hidden risk that comps aren't pricing in. Stress-test before assuming the spread holds.
Location & tenants
- Location reads: area grade B — affects rentability + tenant quality, not the cash-flow math above.
- St. Louis City (urban): math 10% / reading 18% proficiency, ranked #312 of 324 in MO (top 96%) — low school quality limits family demand, transient renter base, plan for 1-2y turnover; 80% free/reduced lunch — lower-income household profile, screen leases tightly.
- Zoned schools: Sigel Elem. Comm. Ed. Ctr. (math 2% / reading 2%, grade F, #1,099 of 1,115 statewide, top 100%, 219 students, 99% FRL); Sumner High (math 2% / reading 2%, grade F, #520 of 521 statewide, top 100%, 264 students, 99% FRL) — zoned schools average 99% FRL vs 80% district-wide (18 pts higher); higher-poverty schools than district average — tighter screening recommended.
- Market conditions: 20 active listings in the ZIP; 21 comparable units currently listed for rent nearby; rentals at typical pace (median 24d on market — plan ~3-4 weeks tenant-placement turnaround); 48% of comp listings sitting > 30 days — soft ceiling on asking rent; lower-income renter base — watch delinquency; 294 units permitted in St. Louis city in 2024 (227 in 5+ unit buildings).
- This rent runs 35% of the median local income ($35k/yr) — at the standard rent-burdened threshold; future hikes will face affordability resistance.
Forward outlook
- In year one you build about $369 of equity ($207 loan paydown + $162 appreciation (0.5% local appreciation)).
- St. Louis County population projected to shrink 6% by 2050 — rents likely to lag national; underwrite the cash flow, not the appreciation.
- At projected returns (0.5% appreciation + 3.0% rent growth), your $8k cash investment doubles in ~2 years — after that, you're playing with house money.
Negotiation context
- Only 10 days on market — expect competitive offers; lowballing is unlikely to land.
Risks & watch-outs
- Watch-outs: built in 1925 — expect roof / HVAC / electrical / plumbing capex.
- Climate carrying-cost: extreme-heat days projected 7→20/yr by 2055 (HVAC capex compounding) — expect insurance premiums to compound above CPI over the hold.
Questions for the listing agent
- Built in 1925 — when were the roof, HVAC, electrical panel, plumbing, and water heater last replaced?
- Is there a deadline driving the sale (1031 exchange, divorce, estate, relocation)? That informs how much negotiation room exists.
- What's the average days-on-market for RENTAL listings here right now (not sales)? A rising rental-DOM trend means longer vacancies and softer asking-rent achievability than the comps imply.
- What's the recent tenant-quality profile in this submarket — average credit score on applications, eviction rate, late-payment / NSF rate, and stable-employment percentage? A property-management company in the area should have these aggregated.
- How much new for-sale + rental construction is in the pipeline within 1–3 miles? Heavy new supply typically softens prices + rents 12–24 months out; constrained supply supports both.
Investment metrics
- 1% rule
- 3.42% ✓
- Cap rate
- 31.20%
- Cash-on-cash
- 88.96%
- DSCR
- 4.96
- GRM
- 2.4
CMA / ARV
- ARV (on-the-fly)
- $36,000
- Comps found
- 12
Show comp detail 12 sales within ~0.75 mi
| Address | Dist | Beds/Ba | Sqft | Sold | Price | $/sf | Match |
|---|---|---|---|---|---|---|---|
| 5658 Maffitt Ave | 0.08mi | 2/1.0 | 850 (-6%) | 4mo | $25,000 | $29 | 84 |
| 5710 Saint Louis Ave | 0.10mi | 2/1.0 | 1,000 (+11%) | 7mo | $25,000 | $25 | 71 |
| 5559 Cote Brilliante Ave | 0.41mi | 2/1.0 | 900 (0%) | 20mo | $69,900 | $78 | 64 |
| 2810 Arlington Ave | 0.46mi | 2/1.0 | 968 (+8%) | 5mo | $25,000 | $26 | 61 |
| 2806 Union Blvd | 0.66mi | 2/1.0 | 858 (-5%) | 10mo | $15,000 | $17 | 54 |
| 6206 Lorraine Ave | 0.75mi | 3/1.0 (+1) | 918 (+2%) | 6mo | $69,900 | $76 | 52 |
| 34 Blakemore Pl | 0.69mi | 2/1.0 | 988 (+10%) | 2mo | $55,000 | $56 | 50 |
| 1636 Belt Ave | 0.50mi | 2/1.0 | 1,003 (+11%) | 9mo | $19,900 | $20 | 50 |
| 5339 Saint Louis Ave | 0.56mi | 2/1.0 | 946 (+5%) | 21mo | $50,000 | $53 | 48 |
| 1632 Belt Ave | 0.51mi | 2/1.0 | 1,003 (+11%) | 12mo | $37,900 | $38 | 47 |
| 1965 Arlington Ave | 0.50mi | 3/1.0 (+1) | 980 (+9%) | 18mo | $39,000 | $40 | 41 |
| 5232 Highland Ave | 0.75mi | 3/1.5 (+1) | 1,030 (+14%) | 6mo | $65,000 | $63 | 29 |
Match score weights: distance 35% · size 25% · config 20% · recency 20%. Top-matched comps best support the ARV.
Projected returns pro-forma
0.54% appreciation · 3.0% rent growth · sell at horizon
- IRR
- 91.7%
- Equity multiple
- 5.71×
- Total profit
- $39,555
- Equity at exit
- $9,529
- IRR
- 92.7%
- Equity multiple
- 11.76×
- Total profit
- $90,353
- Equity at exit
- $12,129
Cash invested: $8,400 (down + closing). Projections, not guarantees.
Landlord ↔ Tenant lean methodology
- Overall (STATE)
- 81 Strongly Landlord-Friendly
- State Missouri
- 81 Strongly Landlord-Friendly · R+10
- County
- — inherits STATE
- City
- — inherits STATE
ZIP-level market 63120
- Home prices YoY
- 0.4%
- Active inventory
- 20
- Price-to-rent
- 2.4×
Monthly cashflow live
- Estimated rent
- $1,026 high interval (Pro) →
- Mortgage (P&I)
- −$157
- Tax from tax record
- −$18 /mo · $217/yr
- Insurance
- −$12
- HOA
- −$0
- Vacancy / Maint / Mgmt
- −$215
- Net cashflow
- $623
Break-even live
UW: 25.0% down · 7.5% · 30yr · 1.5% tax · 5.0% vac · 8.0% maint · 8.0% mgmt
Financing live
Cash to close
- Down payment
- $7,500
- Closing costs
- $900
- Reserves months
- —
- Total cash needed
- —
Loan-product check · same deal, 3 products live
Conventional
25% down · 7.5% · 30yr
- Down + closing
- —
- Monthly P&I
- —
- Monthly cashflow
- —
- DSCR
- —
- Eligible?
- —
Personal DTI + credit; lowest rate.
DSCR
20% down · 8.5% · 30yr
- Down + closing
- —
- Monthly P&I
- —
- Monthly cashflow
- —
- DSCR
- —
- Eligible?
- —
No personal income docs; deal must DSCR.
Hard money
10% down · 12.0% · 12mo
- Down + closing
- —
- Monthly P&I
- —
- Monthly cashflow
- —
- DSCR
- —
- Eligible?
- —
Short-term bridge; refi at stabilization.
Rent comps 21 comps
| Address | Beds | Baths | Sqft | Rent | $/sqft | DOM | Units | Dist |
|---|---|---|---|---|---|---|---|---|
| 5662 Maffitt Ave Saint Louis, MO | 2.0 | 1.0 | 850 | $895 | $1.05 | 7d | 1 | 0.11mi |
| 5608 Wabada Ave Saint Louis, MO | 2.0 | 1.0 | 910 | $1,300 | $1.43 | 16d | 1 | 0.30mi |
| 2831 Abner Pl Unit 7 St. Louis, MO | 2.0 | 1.0 | 968 | $1,250 | $1.29 | 23d | 1 | 0.53mi |
| 1965 Arlington Ave Saint Louis, MO | 3.0 | 1.0 | 980 | $1,300 | $1.33 | 4d | 1 | 0.53mi |
| 5818 Ferris Ave Saint Louis, MO | 3.0 | 1.0 | 1014 | $1,500 | $1.48 | 43d | 1 | 0.65mi |
| 3720 Darby St Saint Louis, MO | 2.0 | 1.0 | 960 | $1,123 | $1.17 | 43d | 1 | 0.76mi |
| 1420 Union Blvd Unit 2F St. Louis, MO | 2.0 | 1.0 | 1096 | $995 | $0.91 | 43d | 1 | 1.00mi |
| 1266 Amherst Pl Unit 2nd floor St. Louis, MO | 2.0 | 1.0 | 1050 | $1,000 | $0.95 | 43d | 1 | 1.07mi |
| 5989 Julian Ave Unit 37 St. Louis, MO | 2.0 | 1.0 | 780 | $1,200 | $1.54 | 17d | 1 | 1.08mi |
| 1610 Kingshighway Blvd St. Louis, MO | 1.0 | 1.0 | 525 | $779 | $1.48 | 2d | 6 | 1.17mi |
| 5203 Page Blvd Unit 5201 1st Floor St. Louis, MO | 2.0 | 1.0 | 1000 | $750 | $0.75 | 14d | 1 | 1.21mi |
| 1324 Academy Ave Unit C St. Louis, MO | 1.0 | 1.0 | 1000 | $890 | $0.89 | 43d | 1 | 1.23mi |
| 4715 Thrush Ave Unit 24 St. Louis, MO | 2.0 | 1.0 | 900 | $1,350 | $1.50 | 23d | 1 | 1.34mi |
| 4719 Plover Ave Saint Louis, MO | 2.0 | 1.0 | 744 | $995 | $1.34 | 4d | 1 | 1.37mi |
| 5345 Cabanne Ave Unit 5345 Cabanne 3N St. Louis, MO | 1.0 | 1.0 | 630 | $800 | $1.27 | 43d | 1 | 1.37mi |
| 5345 Cabanne Ave Unit 5345 Cabanne 1S St. Louis, MO | 2.0 | 1.0 | 800 | $950 | $1.19 | 43d | 1 | 1.37mi |
| 1131 Hodiamont Ave St. Louis, MO | 2.0 | 1.0 | 700 | $1,050 | $1.50 | 43d | 1 | 1.42mi |
| 1131 Hodiamont Ave Unit 1135-2D St. Louis, MO | 3.0 | 1.0 | 840 | $1,225 | $1.46 | 43d | 1 | 1.42mi |
| 5803 Cabanne Ave Saint Louis, MO | 2.0 | 1.0 | 600 | $1,200 | $2.00 | 4d | 1 | 1.48mi |
| 4935 Alcott Ave Saint Louis, MO | 3.0 | 1.0 | 680 | $705 | $1.04 | 16d | 1 | 1.48mi |
| 5811 Cabanne Ave St. Louis, MO | 2.0 | 1.0 | 800 | $1,250 | $1.56 | 43d | 1 | 1.49mi |
Listing history 7 events
-
2026-06-18days on market $30,000 Active 10 DOM
-
2026-06-17days on market $30,000 Active 9 DOM
-
2026-06-16days on market $30,000 Active 8 DOM
-
2026-06-15days on market $30,000 Active 7 DOM
-
2026-06-13days on market $30,000 Active 5 DOM
-
2026-06-09remarks 699-char remark
-
2026-06-09$30,000 Active 1 DOM
ⓘ Source: listings_history table (triggers on properties + properties_extension) + one-shot
backfill from property_details.listing_events for pre-trigger history.
Tax reassessment forecast MO · Resets to sale price
- Current annual tax
- $217 · $18/mo
- Projected year-2 tax
- $291 · $24/mo
- Expected delta
- +$74/yr (+$6/mo · 33.8%)
ⓘ Screening estimate from a state-policy table — verify with the county assessor before closing.
Climate risk First Street
- Flood 1/10 Low FEMA zone X (unshaded) · 0% chance over 30 yrs
- Wildfire 1/10 Low
- Heat 5/10 Major 7 d/yr ≥107°F today · 20 d/yr by 30 yrs out
- Wind 2/10 Low 100% chance of damaging wind over 30 yrs
- Air quality 4/10 Moderate 4 unhealthy d/yr today · 5 by 30 yrs out
Nearby sold comps map
Loading sold comps map…
Walkable amenities ~0.75 mi
Loading nearby amenities…
Taxation est. · year 1
- Rental income
- $12,314
- − Mortgage interest
- −$1,680
- − Property taxes
- −$217
- − Insurance
- −$150
- − Repairs & maintenance
- −$985
- − Management
- −$985
- − Depreciation
- −$873
- Taxable income
- $7,423
- Est. tax owed @ 24.0%
- −$1,781
- After-tax cash flow
- $5,691/yr
For passive investors: Depreciation is non-cash, so a rental often shows a tax loss while cash-flowing — sheltering income. Rental losses are passive: they offset passive income freely, and up to $25,000/yr can offset ordinary (W-2) income if you actively participate and your MAGI is under $100k (phasing out to $0 by $150k); unused losses carry forward. On sale, claimed depreciation is recaptured at up to 25%, and gains may owe capital-gains tax (a 1031 exchange can defer both). Figures are a year-1 estimate at your 24.0% rate — not tax advice; consult a CPA.
Schools (NCES district)
- District
- St. Louis City
- NCES district ID
- 2929280
- Math proficiency
- 10% ▼ -6.00%
- Reading proficiency
- 18% ▼ -3.00%
- Median HH income
- $35,685
- Composite
- 11.54/100
- National rank
- #9699
- State rank
- #312 of 324 in MO
Livability — St. Louis
No livability data for this city. (Only ~50 U.S. cities are tracked.)
Census & demographics
- Census place
- St. Louis, MO
- County
- Saint Louis City · 254,015 people
- City population
- 283,259
- Metro
- St. Louis, MO-IL
- Population (ZIP)
- 6,790
- Household income
- $35,176
- Rent vs Own
- Severe rent burden
- 555.0
Population outlook (St. Louis County) Hauer SSP2
- Today (2025)
- 315,737 people
- By 2030
- 313,865 · -0.6%
- By 2040
- 305,439 · -3.3%
- By 2050
- 296,529 · -6.1%
- By 2075
- 271,028 · -14.2%
- By 2100
- 255,359 · -19.1%
Race, ethnicity, and origin ACS 2023
- Neighborhood character
- Predominantly Black (90%)
- Race & ethnicity
- Black 90% Two or more races 7% White 2%
- Foreign-born
- 1% · Canada
- Languages at home
- 97% English-only · Spanish 1% French/Haitian/Cajun 1%
Political lean MEDSL · St. Louis
- 2024 margin
- Solid D (+64.7) · D 81.4% · R 16.7% · Other 2.0%
- 2008→2024 swing
- -3.5pp toward R · 2008: 68.2pp · 2024: 64.7pp
- All cycles
- 2024: D+64.7 2020: D+66.2 2016: D+63.7 2012: D+66.6 2008: D+68.2
Not yet ingested
- Civics
- —
Market trends
- HPI YoY
- ▲ 0.54%
- Current HPI
- 141.8177
- Rent YoY
- —
- Metro
- St. Louis, MO-IL
- State GDP YoY
- ▲ 1.84%
- F500 in state
- 20
Industry mix (Fortune 500 HQ in MO)
| Industry | F500 HQs | Revenue |
|---|---|---|
| Healthcare | 1 | $163B |
|
||
| Insurance | 1 | $21B |
|
||
| Industrial Technology | 1 | $17B |
|
||
| Retail | 1 | $16B |
|
||
| Industrial Distribution | 1 | $10B |
|
||
| Utilities | 1 | $9B |
|
||
Price history
1 event — show timeline
- 2026-06-08 Listed $30,000 MARIS as Distributed by MLS Grid
Property tax history
-1.7%/yrLatest (2023): $217 · -1.8% YoY. Source: county tax records.
Cash-flow waterfall
monthlySold comps — $/sqft
last 12 mo · ≤1 miLoading sold comps…