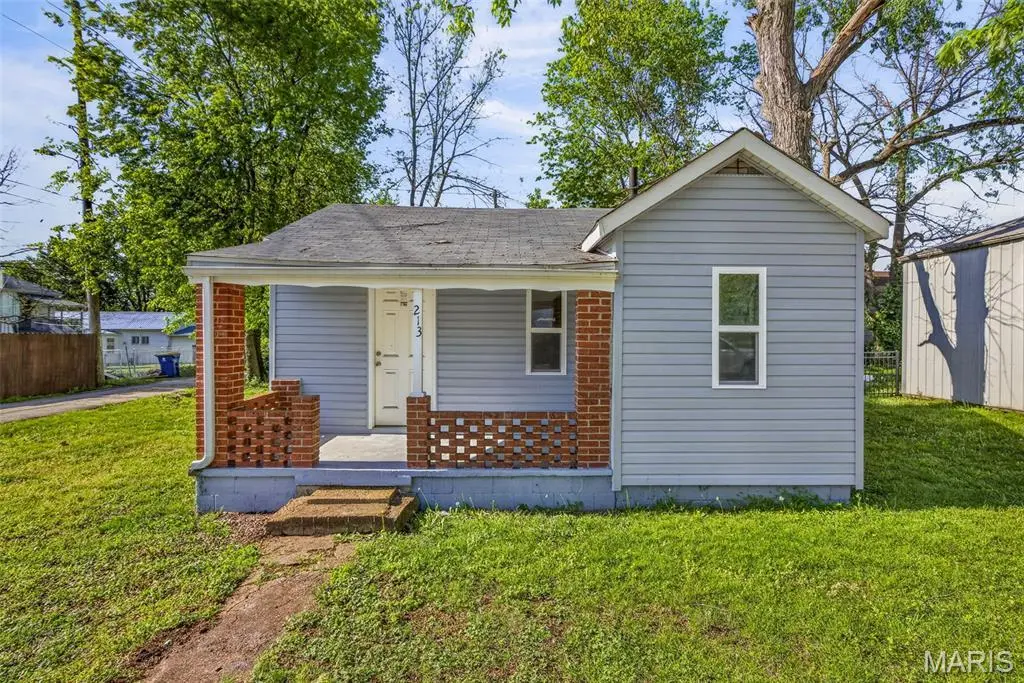
213 Amvets Dr · De Soto, MO
Flood risk 1/10 · Minimal
- FEMA flood zone
- X (unshaded)
- Chance of flooding over 30 yrs
- 0.0%
- Est. flood insurance / yr
- $507 – $1,088
Fire risk 4/10 · Minor
- Est. fire insurance / yr
- $1,054 – $1,958
Heat risk 5/10 · Moderate
- Hot days now (above 106°F)
- 7 days/yr
- Hot days in 30 yrs
- 21 days/yr
Wind risk 2/10 · Minimal
- Chance of severe wind over 30 yrs
- 1.0%
Air-quality risk 2/10 · Minimal
- Unhealthy air days now
- 1 days/yr
- Unhealthy air days in 30 yrs
- 1 days/yr
Risk factors via First Street. Map © Google.
Why this score? — see what drove the B- grade
The composite is a weighted blend of 9 inputs, each scored 0–100. Each bar is that input's sub-score; the figure is the points it added to the 100-point composite (weight × sub-score).
- Cash flow +30.0/30.0
- 1% rule +10.0/10.0
- DSCR +10.0/10.0
- ARV discount +7.5/15.0
- Schools +3.4/10.0
- Livability +3.0/5.0
- Rent growth +2.5/5.0
- Condition / age +2.5/5.0
- Appreciation +0.0/10.0
$50,000
🖨 Deal sheet 📄 Offer letter ✓ Due diligence
Listing remarks MLS
*CALLING all INVESTORS* Cute Bungalow, -or at least it will be when you fix it up! Property is on public sewer and water and within walking distance to schools and shops! Call today for more information, it may be gone tomorrow! This is an as is sale, seller has no knowledge of conditions and warrants no conditions. Buyers must close at sellers chosen title company.
Key facts
- 3,049 sq ft lot
- Built 1947
- Listed 26 days
Property features AI
Finance
- Other: Seller may consider concessions; No home warranty
- Financial info: Lease not considered; No second mortgage reported; Annual tax amount reported (data omitted from features per instructions)
- HOA & community: No HOA information provided
Exterior
- Parking: No parking details provided
- Security: No security features provided
- Utilities: Public water; Public sewer; Electric service: Other
- Home design: Single family residence; One level; Private ownership; Property listed as fixer
- Construction: Vinyl siding; Above-grade finished area reported as 444 (from public records); Year built source: Public Records
- Exterior features: Back yard; Front yard; City lot; No fencing
Interior
- Kitchen: No kitchen appliance details provided
- Bedrooms: 2 bedrooms (both on the main level)
- Flooring: No flooring details provided
- Bathrooms: 1 full bathroom (main level)
- Heating & cooling: No heating; No cooling
- Interior features: No built-in appliances listed
- Laundry & utility: No laundry or utility appliances listed
Neighborhood map
What this means for you Summary
Snapshot
- This is a 2-bed/1.0-bath other listed at $50k.
Deal economics
- At list price, monthly cash flow is $411 ($5k/yr) — positive.
- The deal already cash-flows at list — no discount required.
- Meets the 1% rule at list price ($929 rent vs $50k).
- Recommended offer: $49k (1.5% below list) — sets the bar for market timing.
- Cap rate 16.2% vs local median 3.6% in De Soto — top-decile yield for the area; either an underpriced asset or a hidden risk that comps aren't pricing in. Stress-test before assuming the spread holds.
Location & tenants
- Location reads 59/100 on livability (#523 in MO) — a working-class tenant base; expect higher turnover. Strengths: cost of living A+, housing A+; Watch: crime F, amenities F, commute F.
- Desoto 73 (town): math 36% / reading 43% proficiency, ranked #153 of 324 in MO (top 47%) — families likely to look elsewhere, expect single-tenant / working-renter base with shorter leases.
- Zoned schools: Vineland Elem. (math 40% / reading 44%, grade F, #481 of 1,115 statewide, top 46%, 648 students, 49% FRL); Desoto Sr. High (math 37% / reading 53%, grade D-, #176 of 521 statewide, top 34%, 848 students, 34% FRL) — zoned schools at 42% FRL track the district average.
- Market conditions: 150 active listings in the ZIP; 807 units permitted in Jefferson County in 2024 (104 in 5+ unit buildings).
Forward outlook
- Local home prices are declining (-3.0%/yr); year-one equity from $346 of loan paydown is wiped out by about $2k of value loss. Plan a longer hold.
- At projected returns (-3.0% appreciation + 3.0% rent growth), your $14k cash investment doubles in ~4 years — after that, you're playing with house money.
Negotiation context
- It's been on market 26 days — a 2% lower offer ($49k) is reasonable based on typical stale-listing flexibility.
- 2 sale attempts since 3y ago; this cycle's ask has dropped $5k (9%) from the opening price — seller is motivated, your offer sets the floor, not the list.
Risks & watch-outs
- Watch-outs: built in 1947 — expect roof / HVAC / electrical / plumbing capex.
- Climate carrying-cost: extreme-heat days projected 7→21/yr by 2055 (HVAC capex compounding) — expect insurance premiums to compound above CPI over the hold.
Questions for the listing agent
- Built in 1947 — when were the roof, HVAC, electrical panel, plumbing, and water heater last replaced?
- Is there a deadline driving the sale (1031 exchange, divorce, estate, relocation)? That informs how much negotiation room exists.
- Schools are D-rated, which usually means shorter tenancies and higher turnover. Who's the typical renter profile here, and what's been the actual vacancy rate?
- Crime grade is F in this area — have there been break-ins, vandalism, or insurance claims at this property in the last 3 years? What carrier currently insures it and at what premium?
- What's the average days-on-market for RENTAL listings here right now (not sales)? A rising rental-DOM trend means longer vacancies and softer asking-rent achievability than the comps imply.
- What's the recent tenant-quality profile in this submarket — average credit score on applications, eviction rate, late-payment / NSF rate, and stable-employment percentage? A property-management company in the area should have these aggregated.
- How much new for-sale + rental construction is in the pipeline within 1–3 miles? Heavy new supply typically softens prices + rents 12–24 months out; constrained supply supports both.
Investment metrics
- 1% rule
- 1.86% ✓
- Cap rate
- 16.16%
- Cash-on-cash
- 35.24%
- DSCR
- 2.57
- GRM
- 4.5
CMA / ARV
No comps found within radius.
Projected returns pro-forma
-3.0% appreciation · 3.0% rent growth · sell at horizon
- IRR
- 30.8%
- Equity multiple
- 2.29×
- Total profit
- $18,081
- Equity at exit
- $7,455
- IRR
- 38.0%
- Equity multiple
- 4.53×
- Total profit
- $49,460
- Equity at exit
- $4,323
Cash invested: $14,000 (down + closing). Projections, not guarantees.
Landlord ↔ Tenant lean methodology
- Overall (STATE)
- 81 Strongly Landlord-Friendly
- State Missouri
- 81 Strongly Landlord-Friendly · R+10
- County
- — inherits STATE
- City
- — inherits STATE
ZIP-level market 63020
- Home prices YoY
- -21.9%
- Active inventory
- 150
- Price-to-rent
- 4.5×
Monthly cashflow live
- Estimated rent
- $929 medium interval (Pro) →
- Mortgage (P&I)
- −$262
- Tax from tax record
- −$40 /mo · $480/yr
- Insurance
- −$21
- HOA
- −$0
- Vacancy / Maint / Mgmt
- −$195
- Net cashflow
- $411
Break-even live
UW: 25.0% down · 7.5% · 30yr · 1.5% tax · 5.0% vac · 8.0% maint · 8.0% mgmt
Financing live
Cash to close
- Down payment
- $12,500
- Closing costs
- $1,500
- Reserves months
- —
- Total cash needed
- —
Loan-product check · same deal, 3 products live
Conventional
25% down · 7.5% · 30yr
- Down + closing
- —
- Monthly P&I
- —
- Monthly cashflow
- —
- DSCR
- —
- Eligible?
- —
Personal DTI + credit; lowest rate.
DSCR
20% down · 8.5% · 30yr
- Down + closing
- —
- Monthly P&I
- —
- Monthly cashflow
- —
- DSCR
- —
- Eligible?
- —
No personal income docs; deal must DSCR.
Hard money
10% down · 12.0% · 12mo
- Down + closing
- —
- Monthly P&I
- —
- Monthly cashflow
- —
- DSCR
- —
- Eligible?
- —
Short-term bridge; refi at stabilization.
Listing history 8 events
-
2026-05-14status Pending
-
2026-05-05price $50,000
-
2026-04-18$55,000 Active
-
2023-06-01soldstatus
-
2023-05-26soldstatus Closed 372-char remark
Show marketing remark (372 chars)
*CALLING all INVESTORS* Cute Bungalow, -or at least it will be when you fix it up! Property is on public sewer and water and within walking distance to schools and shops! Call today for more information, it may be gone tomorrow! This is an as is sale, seller has no knowledge of conditions and warrants no conditions. Buyers must close at sellers chosen title company.
-
2023-05-18status Pending 372-char remark
Show marketing remark (372 chars)
*CALLING all INVESTORS* Cute Bungalow, -or at least it will be when you fix it up! Property is on public sewer and water and within walking distance to schools and shops! Call today for more information, it may be gone tomorrow! This is an as is sale, seller has no knowledge of conditions and warrants no conditions. Buyers must close at sellers chosen title company.
-
2023-04-26historical Active Under Contract 372-char remark
Show marketing remark (372 chars)
*CALLING all INVESTORS* Cute Bungalow, -or at least it will be when you fix it up! Property is on public sewer and water and within walking distance to schools and shops! Call today for more information, it may be gone tomorrow! This is an as is sale, seller has no knowledge of conditions and warrants no conditions. Buyers must close at sellers chosen title company.
-
2023-04-18$30,000 Active 372-char remark
Show marketing remark (372 chars)
*CALLING all INVESTORS* Cute Bungalow, -or at least it will be when you fix it up! Property is on public sewer and water and within walking distance to schools and shops! Call today for more information, it may be gone tomorrow! This is an as is sale, seller has no knowledge of conditions and warrants no conditions. Buyers must close at sellers chosen title company.
ⓘ Source: listings_history table (triggers on properties + properties_extension) + one-shot
backfill from property_details.listing_events for pre-trigger history.
Tax reassessment forecast MO · Resets to sale price
- Current annual tax
- $480 · $40/mo
- Projected year-2 tax
- $485 · $40/mo
- Expected delta
- +$5/yr ($0/mo · 1.0%)
ⓘ Screening estimate from a state-policy table — verify with the county assessor before closing.
Climate risk First Street
- Flood 1/10 Low FEMA zone X (unshaded) · 0% chance over 30 yrs
- Wildfire 4/10 Moderate
- Heat 5/10 Major 7 d/yr ≥106°F today · 21 d/yr by 30 yrs out
- Wind 2/10 Low 100% chance of damaging wind over 30 yrs
- Air quality 2/10 Low 1 unhealthy d/yr today · 1 by 30 yrs out
Nearby sold comps map
Loading sold comps map…
Walkable amenities ~0.75 mi
Loading nearby amenities…
Taxation est. · year 1
- Rental income
- $11,152
- − Mortgage interest
- −$2,801
- − Property taxes
- −$480
- − Insurance
- −$250
- − Repairs & maintenance
- −$892
- − Management
- −$892
- − Depreciation
- −$1,455
- Taxable income
- $4,382
- Est. tax owed @ 24.0%
- −$1,052
- After-tax cash flow
- $3,881/yr
For passive investors: Depreciation is non-cash, so a rental often shows a tax loss while cash-flowing — sheltering income. Rental losses are passive: they offset passive income freely, and up to $25,000/yr can offset ordinary (W-2) income if you actively participate and your MAGI is under $100k (phasing out to $0 by $150k); unused losses carry forward. On sale, claimed depreciation is recaptured at up to 25%, and gains may owe capital-gains tax (a 1031 exchange can defer both). Figures are a year-1 estimate at your 24.0% rate — not tax advice; consult a CPA.
Schools (NCES district)
- District
- Desoto 73
- NCES district ID
- 2910500
- Math proficiency
- 36% ▼ -3.00%
- Reading proficiency
- 43% ▲ 3.00%
- Median HH income
- $44,354
- Composite
- 33.52/100
- National rank
- #5434
- State rank
- #153 of 324 in MO
Livability — De Soto
- Score
- 59/100
- State rank
- #523
- US rank
- #19709
Category grades
Schools grade is shown separately in the Schools card above.
Census & demographics
- Census place
- De Soto, MO
- Population (ZIP)
- 20,357
Population outlook (Jefferson County) Hauer SSP2
- Today (2025)
- 235,088 people
- By 2030
- 238,365 · +1.4%
- By 2040
- 240,156 · +2.2%
- By 2050
- 234,651 · -0.2%
- By 2075
- 214,569 · -8.7%
- By 2100
- 179,697 · -23.6%
Race, ethnicity, and origin ACS 2023
- Neighborhood character
- Predominantly White (88%)
- Race & ethnicity
- White 88% Two or more races 10% Hispanic / Latino 1%
- Common ancestry
- Lithuanian 5% Iranian 2% Italian 1%
- Foreign-born
- 1% · Canada
- Languages at home
- 98% English-only · Spanish 1%
Political lean MEDSL · Jefferson
- 2024 margin
- Solid R (+36.7) · D 31.0% · R 67.7% · Other 1.3%
- 2008→2024 swing
- -39.3pp toward R · 2008: 2.5pp · 2024: -36.7pp
- All cycles
- 2024: R+36.7 2020: R+33.9 2016: R+35.3 2012: R+12.7 2008: D+2.5
Not yet ingested
- Civics
- —
Market trends
- HPI YoY
- ▼ -60.90%
- Current HPI
- 217.2807
- Rent YoY
- —
- Metro
- —
- State GDP YoY
- ▲ 1.84%
- F500 in state
- 20
Industry mix (Fortune 500 HQ in MO)
| Industry | F500 HQs | Revenue |
|---|---|---|
| Healthcare | 1 | $163B |
|
||
| Insurance | 1 | $21B |
|
||
| Industrial Technology | 1 | $17B |
|
||
| Retail | 1 | $16B |
|
||
| Industrial Distribution | 1 | $10B |
|
||
| Utilities | 1 | $9B |
|
||
Price history
+66.7% since first listed8 events — show timeline
- 2026-05-14 Pending — MARIS as Distributed by MLS Grid
- 2026-05-05 Price Changed $50,000 MARIS as Distributed by MLS Grid
- 2026-04-18 Listed $55,000 MARIS as Distributed by MLS Grid
- 2023-06-01 Sold (Public Records) — Public Records
- 2023-05-26 Sold (MLS) — MARIS as Distributed by MLS Grid
- 2023-05-18 Pending — MARIS as Distributed by MLS Grid
- 2023-04-26 Contingent — MARIS as Distributed by MLS Grid
- 2023-04-18 Listed $30,000 MARIS as Distributed by MLS Grid
Property tax history
+3.1%/yrLatest (2025): $480 · +5.5% YoY. Source: county tax records.
Cash-flow waterfall
monthlySold comps — $/sqft
last 12 mo · ≤1 miLoading sold comps…