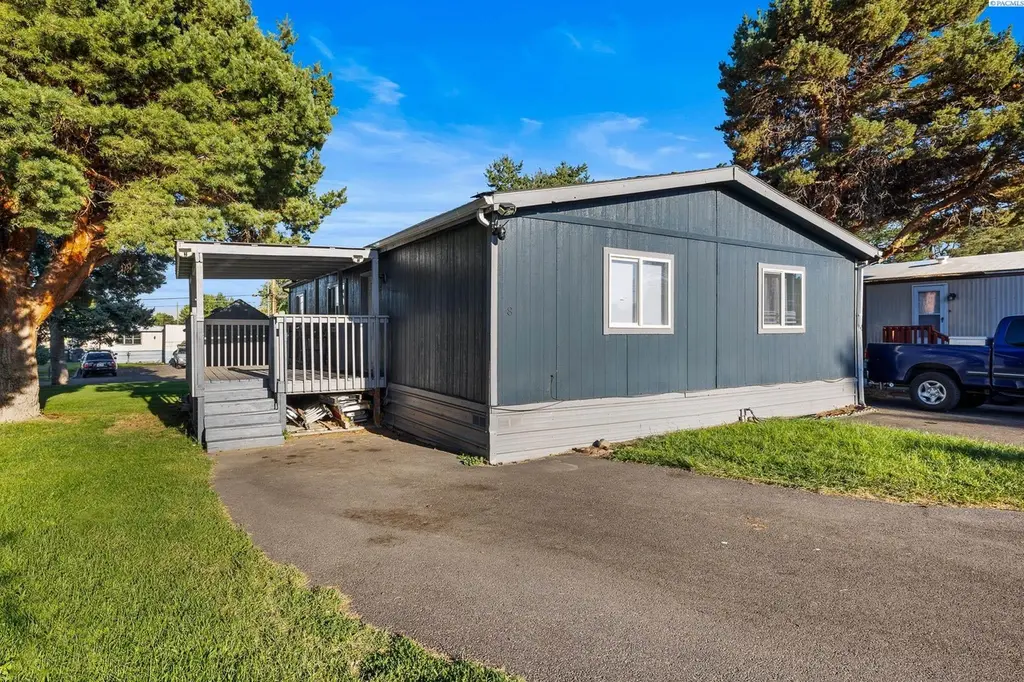
8 Royal Loop · West Richland, WA
Flood risk 1/10 · Minimal
- FEMA flood zone
- X
- Chance of flooding over 30 yrs
- 0.0%
- Est. flood insurance / yr
- $507 – $1,088
Fire risk 5/10 · Moderate
- Est. fire insurance / yr
- $604 – $1,122
Heat risk 5/10 · Moderate
- Hot days now (above 99°F)
- 7 days/yr
- Hot days in 30 yrs
- 15 days/yr
Wind risk 1/10 · Minimal
- Chance of severe wind over 30 yrs
- —
Air-quality risk 7/10 · Major
- Unhealthy air days now
- 11 days/yr
- Unhealthy air days in 30 yrs
- 12 days/yr
Risk factors via First Street. Map © Google.
Why this score? — see what drove the B+ grade
The composite is a weighted blend of 9 inputs, each scored 0–100. Each bar is that input's sub-score; the figure is the points it added to the 100-point composite (weight × sub-score).
- Cash flow +30.0/30.0
- ARV discount +15.0/15.0
- 1% rule +10.0/10.0
- DSCR +10.0/10.0
- Schools +5.3/10.0
- Livability +3.6/5.0
- Rent growth +2.5/5.0
- Condition / age +2.5/5.0
- Appreciation +0.0/10.0
$90,000
🖨 Deal sheet 📄 Offer letter ✓ Due diligence
Listing remarks
MLS# 292437 Discover this roomy double-wide in the heart of West Richland. With 3 bedrooms, 2 full baths, and an open layout, it’s designed for easy living and plenty of natural light. You’ll love the generous storage, dedicated laundry room, and backyard shed for extra space. A comfortable, functional home ready for its next chapter. Schedule your showing today.
Key facts
- Built 1985
- Listed 55 days
Property features AI
Exterior
- Parking: No garage
- Home design: Manufactured home (Residential); One story; New construction
- Construction: Double wide; Manufactured home; 1 story
- Exterior features: Located in the ROYAL CREST subdivision; Residential zoning
Interior
- Kitchen: Dishwasher; Refrigerator; Range; Oven
- Bedrooms: Double wide manufactured home
- Flooring: Carpet; Laminate
- Bathrooms: 2 full bathrooms
- Heating & cooling: Central air conditioning
- Interior features: Dishwasher; Refrigerator; Range; Oven
- Laundry & utility: No basement
Neighborhood map
What this means for you Summary
Snapshot
- This is a 2-bed/2.0-bath manufactured listed at $90k.
Deal economics
- At list price, monthly cash flow is $597 ($7k/yr) — positive.
- The deal already cash-flows at list — no discount required.
- Meets the 1% rule at list price ($2k rent vs $90k).
- Recommended offer: $87k (3.0% below list) — sets the bar for market timing.
- Cap rate 14.3% vs local median 3.2% in West Richland — top-decile yield for the area; either an underpriced asset or a hidden risk that comps aren't pricing in. Stress-test before assuming the spread holds.
Location & tenants
- Location reads 71/100 on livability (#236 in WA) — a middle-class / working-renter tenant base. Strengths: crime A+, employment A+, housing A+; Watch: cost of living D+, amenities F, commute F.
- Richland School District (urban): math 52% / reading 64% proficiency, ranked #61 of 291 in WA (top 21%) — acceptable for families but not a draw, mixed tenant base, ~2y average lease.
- Market conditions: 243 active listings in the ZIP; 5 comparable units currently listed for rent nearby; rentals at typical pace (median 21d on market — plan ~3-4 weeks tenant-placement turnaround); 40% of comp listings sitting > 30 days — soft ceiling on asking rent; high-income renter base; 1,532 units permitted in Benton County in 2024 (389 in 5+ unit buildings).
- This rent is only 15% of the median local income ($122k/yr) — well below the 30% rent-burden line; pricing power to push rent on renewal without tenant pushback.
Forward outlook
- Local home prices are declining (-3.0%/yr); year-one equity from $622 of loan paydown is wiped out by about $3k of value loss. Plan a longer hold.
- Benton County population projected at +32% by 2050 — long-run rental-demand tailwind backs the buy-and-hold thesis.
- At projected returns (-3.0% appreciation + 3.0% rent growth), your $25k cash investment doubles in ~5 years — after that, you're playing with house money.
Negotiation context
- It's been on market 55 days — a 3% lower offer ($87k) is reasonable based on typical stale-listing flexibility.
- 2 sale attempts; this cycle's ask has dropped $8k (8%) from the opening price — seller is motivated, your offer sets the floor, not the list.
Risks & watch-outs
- Climate carrying-cost: moderate wildfire risk; extreme-heat days projected 7→15/yr by 2055 (HVAC capex compounding) — expect insurance premiums to compound above CPI over the hold.
Questions for the listing agent
- It's been on market 55 days. Have you received any prior offers? Is the seller open to a 3% concession, seller financing, or rate buy-down credit?
- Is there a deadline driving the sale (1031 exchange, divorce, estate, relocation)? That informs how much negotiation room exists.
- Schools are B-rated — typically a magnet for longer-tenancy family renters. What's the average tenant stay here, and is there a school-zone premium baked into asking?
- What's the average days-on-market for RENTAL listings here right now (not sales)? A rising rental-DOM trend means longer vacancies and softer asking-rent achievability than the comps imply.
- What's the recent tenant-quality profile in this submarket — average credit score on applications, eviction rate, late-payment / NSF rate, and stable-employment percentage? A property-management company in the area should have these aggregated.
- How much new for-sale + rental construction is in the pipeline within 1–3 miles? Heavy new supply typically softens prices + rents 12–24 months out; constrained supply supports both.
Investment metrics
- 1% rule
- 1.72% ✓
- Cap rate
- 14.26%
- Cash-on-cash
- 28.45%
- DSCR
- 2.27
- GRM
- 4.9
CMA / ARV
- ARV (median comp)
- $110,000
- List price
- $90,000
- Delta
- -18.18%
- Verdict
- UNDERPRICED
- Comps
- 3 within 2.0 mi
Show comp detail 1 sale within ~0.75 mi
| Address | Dist | Beds/Ba | Sqft | Sold | Price | $/sf | Match |
|---|---|---|---|---|---|---|---|
| 21 Royal Crest Loop Pr | 0.02mi | 2/2.0 | 1,056 (-11%) | 18mo | $101,000 | $96 | 65 |
Match score weights: distance 35% · size 25% · config 20% · recency 20%. Top-matched comps best support the ARV.
Projected returns pro-forma
-3.0% appreciation · 3.0% rent growth · sell at horizon
- IRR
- 22.7%
- Equity multiple
- 1.93×
- Total profit
- $23,493
- Equity at exit
- $13,419
- IRR
- 30.7%
- Equity multiple
- 3.76×
- Total profit
- $69,553
- Equity at exit
- $7,782
Cash invested: $25,200 (down + closing). Projections, not guarantees.
Landlord ↔ Tenant lean methodology
- Overall (STATE)
- 28 Tenant-Leaning
- State Washington
- 28 Tenant-Leaning · D+8
- County
- — inherits STATE
- City
- — inherits STATE
ZIP-level market 99353
- Active inventory
- 243
- Price-to-rent
- 4.9×
Monthly cashflow live
- Estimated rent
- $1,544 high interval (Pro) →
- Mortgage (P&I)
- −$472
- Tax est. 1.5%
- −$112 /mo · $1,350/yr
- Insurance
- −$38
- HOA
- −$0
- Vacancy / Maint / Mgmt
- −$324
- Net cashflow
- $597
Break-even live
UW: 25.0% down · 7.5% · 30yr · 1.5% tax · 5.0% vac · 8.0% maint · 8.0% mgmt
Financing live
Cash to close
- Down payment
- $22,500
- Closing costs
- $2,700
- Reserves months
- —
- Total cash needed
- —
Loan-product check · same deal, 3 products live
Conventional
25% down · 7.5% · 30yr
- Down + closing
- —
- Monthly P&I
- —
- Monthly cashflow
- —
- DSCR
- —
- Eligible?
- —
Personal DTI + credit; lowest rate.
DSCR
20% down · 8.5% · 30yr
- Down + closing
- —
- Monthly P&I
- —
- Monthly cashflow
- —
- DSCR
- —
- Eligible?
- —
No personal income docs; deal must DSCR.
Hard money
10% down · 12.0% · 12mo
- Down + closing
- —
- Monthly P&I
- —
- Monthly cashflow
- —
- DSCR
- —
- Eligible?
- —
Short-term bridge; refi at stabilization.
Rent comps 5 comps
| Address | Beds | Baths | Sqft | Rent | $/sqft | DOM | Units | Dist |
|---|---|---|---|---|---|---|---|---|
| 485 S 38th Ave Unit E118 West Richland, WA | 2.0 | 2.0 | 1000 | $1,350 | $1.35 | 21d | 1 | 0.13mi |
| 485 S 38th Ave Unit B207 West Richland, WA | 2.0 | 2.0 | 1001 | $1,350 | $1.35 | 43d | 1 | 0.13mi |
| 526 S 40th Ave Unit C208 West Richland, WA | 1.0 | 1.0 | 756 | $1,450 | $1.92 | 43d | 1 | 0.14mi |
| 531 S 38th Ave West Richland, WA | 1.0–2.0 | 1.0 | 740 | $1,285 | $1.74 | 13d | 3 | 0.16mi |
| 4570 Rosencrans Rd West Richland, WA | 3.0 | 2.0 | 1246 | $1,925 | $1.54 | 13d | 3 | 1.00mi |
Listing history 26 events
-
2026-06-18days on market $90,000 Active 55 DOM
-
2026-06-17days on market $90,000 Active 54 DOM
-
2026-06-16days on market $90,000 Active 53 DOM
-
2026-06-15days on market $90,000 Active 52 DOM
-
2026-06-14days on market $90,000 Active 50 DOM
-
2026-06-13days on market $90,000 Active 49 DOM
-
2026-06-10days on market $90,000 Active 47 DOM
-
2026-06-09days on market $90,000 Active 46 DOM
-
2026-06-09price $90,000 Active 45 DOM
-
2026-06-08days on market $95,000 Active 45 DOM
-
2026-06-07days on market $95,000 Active 44 DOM
-
2026-06-05days on market $95,000 Active 41 DOM
-
2026-06-03days on market $95,000 Active 40 DOM
-
2026-06-02days on market $95,000 Active 39 DOM
-
2026-06-01days on market $95,000 Active 38 DOM
-
2026-05-31days on market $95,000 Active 37 DOM
-
2026-05-30days on market $95,000 Active 36 DOM
-
2026-05-04price $95,000 377-char remark
-
2026-04-23$98,000 Active 377-char remark
-
2025-12-08price $98,000
-
2025-09-11price $105,000
-
2025-04-04price $120,000
-
2025-04-03price $125,000
-
2025-03-28price $127,999
-
2025-03-03price $129,999
-
2025-02-14$135,000 Active
ⓘ Source: listings_history table (triggers on properties + properties_extension) + one-shot
backfill from property_details.listing_events for pre-trigger history.
Climate risk First Street
- Flood 1/10 Low FEMA zone X · 0% chance over 30 yrs
- Wildfire 5/10 Major
- Heat 5/10 Major 7 d/yr ≥99°F today · 15 d/yr by 30 yrs out
- Wind 1/10 Low
- Air quality 7/10 Severe 11 unhealthy d/yr today · 12 by 30 yrs out
Nearby sold comps map
Loading sold comps map…
Walkable amenities ~0.75 mi
Loading nearby amenities…
Taxation est. · year 1
- Rental income
- $18,523
- − Mortgage interest
- −$5,041
- − Property taxes
- −$1,350
- − Insurance
- −$450
- − Repairs & maintenance
- −$1,482
- − Management
- −$1,482
- − Depreciation
- −$2,618
- Taxable income
- $6,100
- Est. tax owed @ 24.0%
- −$1,464
- After-tax cash flow
- $5,706/yr
For passive investors: Depreciation is non-cash, so a rental often shows a tax loss while cash-flowing — sheltering income. Rental losses are passive: they offset passive income freely, and up to $25,000/yr can offset ordinary (W-2) income if you actively participate and your MAGI is under $100k (phasing out to $0 by $150k); unused losses carry forward. On sale, claimed depreciation is recaptured at up to 25%, and gains may owe capital-gains tax (a 1031 exchange can defer both). Figures are a year-1 estimate at your 24.0% rate — not tax advice; consult a CPA.
Schools (NCES district)
- District
- Richland School District
- NCES district ID
- 5307320
- Math proficiency
- 52% ▬ 0.00%
- Reading proficiency
- 64% ▼ -1.00%
- Median HH income
- $70,475
- Composite
- 53.04/100
- National rank
- #3244
- State rank
- #61 of 291 in WA
Livability — West Richland
- Score
- 71/100
- State rank
- #236
- US rank
- #7220
Category grades
Schools grade is shown separately in the Schools card above.
Census & demographics
- Census place
- West Richland, WA
- County
- Benton County · 186,895 people
- City population
- 19,251
- Metro
- Kennewick-Richland, WA
- Population (ZIP)
- 19,251
- Household income
- $121,845
- Rent vs Own
- Severe rent burden
- 254.0
Population outlook (Benton County) Hauer SSP2
- Today (2025)
- 219,421 people
- By 2030
- 233,813 · +6.6%
- By 2040
- 262,134 · +19.5%
- By 2050
- 290,100 · +32.2%
- By 2075
- 363,525 · +65.7%
- By 2100
- 418,667 · +90.8%
Race, ethnicity, and origin ACS 2023
- Neighborhood character
- Predominantly White (74%)
- Race & ethnicity
- White 74% Hispanic / Latino 15% Two or more races 15% Asian 2%
- Hispanic origin (detail)
- Mexican 13%
- Common ancestry
- Portuguese 4% Italian 4% Lithuanian 4%
- Foreign-born
- 7% · Canada, Vietnam, China
- Languages at home
- 87% English-only · Spanish 10% Other Asian/Pacific 1% Arabic 1%
Political lean MEDSL · Benton
- 2024 margin
- Strong R (+21.9) · D 37.7% · R 59.6% · Other 2.7%
- 2008→2024 swing
- +4.2pp toward D · 2008: -26.1pp · 2024: -21.9pp
- All cycles
- 2024: R+21.9 2020: R+21.0 2016: R+26.6 2012: R+27.0 2008: R+26.1
Not yet ingested
- Civics
- —
Market trends
- HPI YoY
- ▼ -218.63%
- Current HPI
- 239.5096
- Rent YoY
- —
- Metro
- Kennewick-Richland, WA
- State GDP YoY
- ▲ 4.65%
- F500 in state
- 22
Industry mix (Fortune 500 HQ in WA)
| Industry | F500 HQs | Revenue |
|---|---|---|
| Retail | 2 | $269B |
|
||
| Technology / Retail | 1 | $638B |
|
||
| Technology | 1 | $245B |
|
||
| Telecommunications | 1 | $38B |
|
||
| Food / Beverage | 1 | $36B |
|
||
| Automotive / Trucks | 1 | $34B |
|
||
Price history
-33.3% since first listed10 events — show timeline
- 2026-06-08 Price Changed $90,000 PACMLS
- 2026-05-04 Price Changed $95,000 PACMLS
- 2026-04-23 Listed $98,000 PACMLS
- 2025-12-08 Price Changed $98,000 PACMLS
- 2025-09-11 Price Changed $105,000 PACMLS
- 2025-04-04 Price Changed $120,000 PACMLS
- 2025-04-03 Price Changed $125,000 PACMLS
- 2025-03-28 Price Changed $127,999 PACMLS
- 2025-03-03 Price Changed $129,999 PACMLS
- 2025-02-14 Listed $135,000 PACMLS
Property tax history
-1.9%/yrLatest (2026): $121 · -18.9% YoY. Source: county tax records.
Cash-flow waterfall
monthlySold comps — $/sqft
last 12 mo · ≤1 miLoading sold comps…