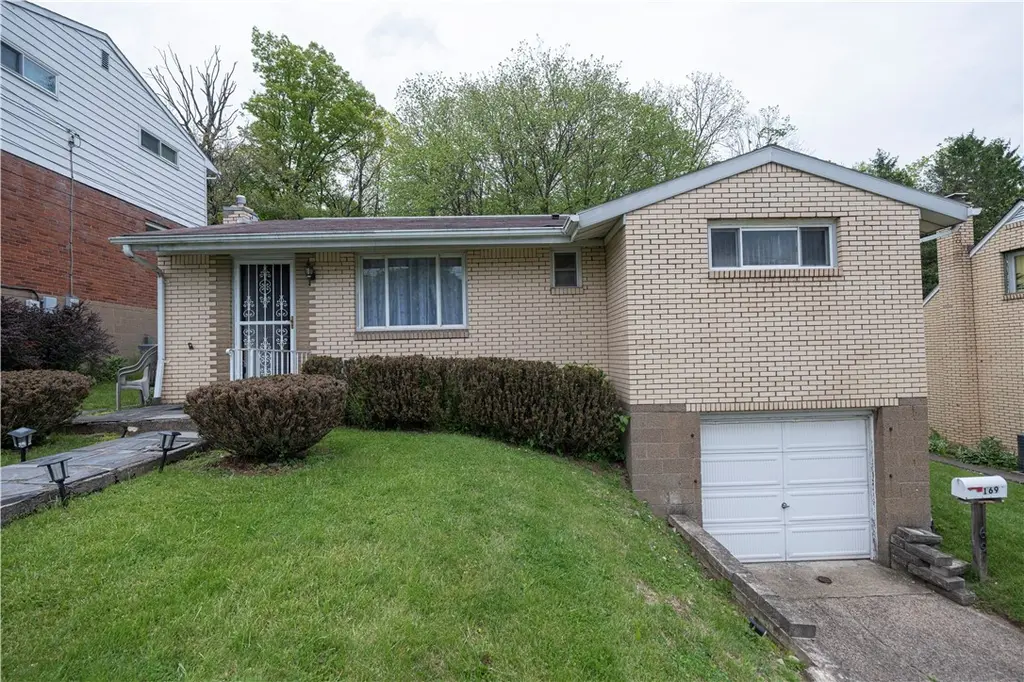
169 Keefer Dr · Monroeville, PA
Flood risk 1/10 · Minimal
- FEMA flood zone
- X (unshaded)
- Chance of flooding over 30 yrs
- 0.0%
- Est. flood insurance / yr
- $473 – $860
Fire risk 2/10 · Minimal
- Est. fire insurance / yr
- $511 – $949
Heat risk 3/10 · Minor
- Hot days now (above 96°F)
- 7 days/yr
- Hot days in 30 yrs
- 17 days/yr
Wind risk 2/10 · Minimal
- Chance of severe wind over 30 yrs
- —
Air-quality risk 4/10 · Minor
- Unhealthy air days now
- 5 days/yr
- Unhealthy air days in 30 yrs
- 7 days/yr
Risk factors via First Street. Map © Google.
Why this score? — see what drove the C grade
The composite is a weighted blend of 9 inputs, each scored 0–100. Each bar is that input's sub-score; the figure is the points it added to the 100-point composite (weight × sub-score).
- Cash flow +24.7/30.0
- DSCR +8.0/10.0
- 1% rule +6.4/10.0
- Rent growth +4.4/5.0
- ARV discount +3.9/15.0
- Livability +3.9/5.0
- Condition / age +2.5/5.0
- Schools +1.6/10.0
- Appreciation +0.0/10.0
$135,000
🖨 Deal sheet 📄 Offer letter ✓ Due diligence
Listing remarks MLS
ALL BRICK RANCH IN MOVE-IN COND!REAR COVERED/ENC. PORCH!LEVEL/TERRACED YARD!CUL- DE-SAC!HOME WARRANTY!
Key facts
- Screened in porch
- Large picture window
- Eat in kitchen
Tags
Property features AI
Exterior
- Parking: Attached garage with built-in features and garage door opener
- Utilities: Public water; Public sewer
- Home design: Single-story home; Resale property; Brick construction
- Construction: Brick exterior; Has home warranty
- Exterior features: Public transportation access
Interior
- Kitchen: Dishwasher; Microwave; Refrigerator; Stove; Some gas appliances
- Bedrooms: Bedroom on main level (12 x 8); Bedroom on main level (12 x 11)
- Flooring: Vinyl flooring; Carpet
- Bathrooms: 2 full bathrooms
- Heating & cooling: Forced air gas heating; Central air conditioning
- Interior features: Window treatments throughout; Interior entry basement
- Laundry & utility: Washer; Dryer
Neighborhood map
What this means for you Summary
Snapshot
- This is a 3-bed/1.0-bath single-family listed at $135k.
Deal economics
- At list price, monthly cash flow is $281 ($3k/yr) — positive.
- The deal already cash-flows at list — no discount required.
- Meets the 1% rule at list price ($2k rent vs $135k).
Location & tenants
- Location reads 77/100 on livability (#358 in PA, #3,140 nationally) — a middle-class / working-renter tenant base. Strengths: schools A+, cost of living A+, housing A+; Watch: health & safety D+, amenities F, commute F.
- Penn Hills SD (suburban): math 13% / reading 24% proficiency, ranked #496 of 539 in PA (top 92%) — low school quality limits family demand, transient renter base, plan for 1-2y turnover.
- Market conditions: Rents rising fast (+7.6%/yr); 129 active listings in the ZIP; 8 comparable units currently listed for rent nearby; rentals at typical pace (median 21d on market — plan ~3-4 weeks tenant-placement turnaround); 2,996 units permitted in Allegheny County in 2024 (1,588 in 5+ unit buildings).
Forward outlook
- Local home prices are declining (-3.0%/yr); year-one equity from $933 of loan paydown is wiped out by about $4k of value loss. Plan a longer hold.
- At projected returns (-3.0% appreciation + 7.6% rent growth), your $38k cash investment doubles in ~8 years — after that, you're playing with house money.
Negotiation context
- Only 5 days on market — expect competitive offers; lowballing is unlikely to land.
- 2 sale attempts since 25y ago with the ask held roughly flat each time — persistent listings suggest the price (not the market) is what's stuck; bring a comps-based counter.
- Current owner paid $58k; list at $135k implies a 131% gain — meaningful room to come down on a strong offer.
Risks & watch-outs
- Watch-outs: built in 1956 — expect roof / HVAC / electrical / plumbing capex.
Questions for the listing agent
- Built in 1956 — when were the roof, HVAC, electrical panel, plumbing, and water heater last replaced?
- Is there a deadline driving the sale (1031 exchange, divorce, estate, relocation)? That informs how much negotiation room exists.
- Schools are A-rated — typically a magnet for longer-tenancy family renters. What's the average tenant stay here, and is there a school-zone premium baked into asking?
- What's the average days-on-market for RENTAL listings here right now (not sales)? A rising rental-DOM trend means longer vacancies and softer asking-rent achievability than the comps imply.
- What's the recent tenant-quality profile in this submarket — average credit score on applications, eviction rate, late-payment / NSF rate, and stable-employment percentage? A property-management company in the area should have these aggregated.
- How much new for-sale + rental construction is in the pipeline within 1–3 miles? Heavy new supply typically softens prices + rents 12–24 months out; constrained supply supports both.
Investment metrics
- 1% rule
- 1.14% ✓
- Cap rate
- 8.79%
- Cash-on-cash
- 8.92%
- DSCR
- 1.40
- GRM
- 7.3
CMA / ARV
- ARV (on-the-fly)
- $124,968
- Comps found
- 12
Show comp detail 12 sales within ~0.75 mi
| Address | Dist | Beds/Ba | Sqft | Sold | Price | $/sf | Match |
|---|---|---|---|---|---|---|---|
| 131 S Joslyn Dr | 0.11mi | 3/1.0 | 988 (+0%) | 2mo | $88,000 | $89 | 93 |
| 115 Keefer Dr | 0.14mi | 3/1.0 | 936 (-5%) | 6mo | $70,000 | $75 | 80 |
| 388 Collins Dr | 0.44mi | 3/1.5 | 972 (-1%) | 3mo | $155,000 | $159 | 73 |
| 204 Keefer Dr | 0.06mi | 2/1.5 (-1) | 936 (-5%) | 12mo | $100,000 | $107 | 72 |
| 951 Universal Rd | 0.44mi | 3/1.0 | 941 (-4%) | 4mo | $105,000 | $112 | 69 |
| 27 N Joslyn | 0.34mi | 2/1.0 (-1) | 934 (-5%) | 13mo | $125,000 | $134 | 60 |
| 308 Anthon Dr | 0.50mi | 2/1.0 (-1) | 950 (-4%) | 11mo | $110,000 | $116 | 56 |
| 230 Idlewood Rd | 0.52mi | 2/1.5 (-1) | 1,062 (+8%) | 2mo | $135,000 | $127 | 54 |
| 220 Idlewood Rd | 0.52mi | 3/1.0 | 1,058 (+8%) | 13mo | $146,000 | $138 | 52 |
| 186 Mckenzie Dr | 0.60mi | 3/2.0 | 1,050 (+7%) | 10mo | $235,000 | $224 | 49 |
| 529 Guylyn Dr | 0.52mi | 3/1.5 | 875 (-11%) | 13mo | $135,000 | $154 | 45 |
| 105 Clay Dr | 0.69mi | 3/2.0 | 1,080 (+10%) | 7mo | $92,500 | $86 | 41 |
Match score weights: distance 35% · size 25% · config 20% · recency 20%. Top-matched comps best support the ARV.
Projected returns pro-forma
-3.0% appreciation · 7.63% rent growth · sell at horizon
- IRR
- 2.3%
- Equity multiple
- 1.09×
- Total profit
- $3,527
- Equity at exit
- $20,129
- IRR
- 16.0%
- Equity multiple
- 2.59×
- Total profit
- $59,978
- Equity at exit
- $11,672
Cash invested: $37,800 (down + closing). Projections, not guarantees.
Landlord ↔ Tenant lean methodology
- Overall (STATE)
- 62 Landlord-Friendly
- State Pennsylvania
- 62 Landlord-Friendly · EVEN
- County
- — inherits STATE
- City
- — inherits STATE
ZIP-level market 15235
- Home prices YoY
- -34.1%
- Rents YoY
- 7.6%
- Active inventory
- 129
- Price-to-rent
- 7.3×
Monthly cashflow live
- Estimated rent
- $1,533 high interval (Pro) →
- Mortgage (P&I)
- −$708
- Tax from tax record
- −$166 /mo · $1,992/yr
- Insurance
- −$56
- HOA
- −$0
- Vacancy / Maint / Mgmt
- −$322
- Net cashflow
- $281
Break-even live
UW: 25.0% down · 7.5% · 30yr · 1.5% tax · 5.0% vac · 8.0% maint · 8.0% mgmt
Financing live
Cash to close
- Down payment
- $33,750
- Closing costs
- $4,050
- Reserves months
- —
- Total cash needed
- —
Loan-product check · same deal, 3 products live
Conventional
25% down · 7.5% · 30yr
- Down + closing
- —
- Monthly P&I
- —
- Monthly cashflow
- —
- DSCR
- —
- Eligible?
- —
Personal DTI + credit; lowest rate.
DSCR
20% down · 8.5% · 30yr
- Down + closing
- —
- Monthly P&I
- —
- Monthly cashflow
- —
- DSCR
- —
- Eligible?
- —
No personal income docs; deal must DSCR.
Hard money
10% down · 12.0% · 12mo
- Down + closing
- —
- Monthly P&I
- —
- Monthly cashflow
- —
- DSCR
- —
- Eligible?
- —
Short-term bridge; refi at stabilization.
Rent comps 8 comps
| Address | Beds | Baths | Sqft | Rent | $/sqft | DOM | Units | Dist |
|---|---|---|---|---|---|---|---|---|
| 279 Hazel Rd Pittsburgh, PA | 3.0 | 1.0 | 1080 | $1,732 | $1.60 | 43d | 1 | 0.50mi |
| 154 Collins Dr Pittsburgh, PA | 3.0 | 1.0 | 986 | $1,295 | $1.31 | 2d | 1 | 0.62mi |
| 1160 Jefferson Rd Pittsburgh, PA | 3.0 | 1.0 | 1066 | $1,295 | $1.21 | 14d | 1 | 0.88mi |
| 261 Universal Rd Unit 261UNIV Pittsburgh, PA | 3.0 | 1.0 | 1100 | $1,225 | $1.11 | 3d | 1 | 0.92mi |
| 127 Stowe Dr Pittsburgh, PA | 3.0 | 1.0 | 948 | $1,495 | $1.58 | 21d | 1 | 0.94mi |
| 325 Poe Dr Pittsburgh, PA | 2.0 | 1.0 | 1056 | $1,599 | $1.51 | 43d | 1 | 0.94mi |
| 213 Tilford Rd Pittsburgh, PA | 4.0 | 1.5 | 1000 | $1,640 | $1.64 | 43d | 1 | 0.98mi |
| 3910 Old William Penn Hwy Penn Hills, PA | 2.0 | 1.0–2.0 | 750 | $1,175 | $1.57 | 2d | 3 | 1.35mi |
Listing history 4 events
-
2026-05-23$135,000 Active
-
2001-03-02soldstatus $58,500
-
2001-02-28soldstatus $58,500 102-char remark
Show marketing remark (102 chars)
ALL BRICK RANCH IN MOVE-IN COND!REAR COVERED/ENC. PORCH!LEVEL/TERRACED YARD!CUL- DE-SAC!HOME WARRANTY!
-
2001-01-22$64,900 102-char remark
Show marketing remark (102 chars)
ALL BRICK RANCH IN MOVE-IN COND!REAR COVERED/ENC. PORCH!LEVEL/TERRACED YARD!CUL- DE-SAC!HOME WARRANTY!
ⓘ Source: listings_history table (triggers on properties + properties_extension) + one-shot
backfill from property_details.listing_events for pre-trigger history.
Tax reassessment forecast PA · Partial reset (capped growth)
- Current annual tax
- $1,992 · $166/mo
- Projected year-2 tax
- $2,063 · $172/mo
- Expected delta
- +$70/yr (+$6/mo · 3.5%)
ⓘ Screening estimate from a state-policy table — verify with the county assessor before closing.
Climate risk First Street
- Flood 1/10 Low FEMA zone X (unshaded) · 0% chance over 30 yrs
- Wildfire 2/10 Low
- Heat 3/10 Moderate 7 d/yr ≥96°F today · 17 d/yr by 30 yrs out
- Wind 2/10 Low
- Air quality 4/10 Moderate 5 unhealthy d/yr today · 7 by 30 yrs out
Nearby sold comps map
Loading sold comps map…
Walkable amenities ~0.75 mi
Loading nearby amenities…
Taxation est. · year 1
- Rental income
- $18,400
- − Mortgage interest
- −$7,562
- − Property taxes
- −$1,992
- − Insurance
- −$675
- − Repairs & maintenance
- −$1,472
- − Management
- −$1,472
- − Depreciation
- −$3,927
- Taxable income
- $1,300
- Est. tax owed @ 24.0%
- −$312
- After-tax cash flow
- $3,062/yr
For passive investors: Depreciation is non-cash, so a rental often shows a tax loss while cash-flowing — sheltering income. Rental losses are passive: they offset passive income freely, and up to $25,000/yr can offset ordinary (W-2) income if you actively participate and your MAGI is under $100k (phasing out to $0 by $150k); unused losses carry forward. On sale, claimed depreciation is recaptured at up to 25%, and gains may owe capital-gains tax (a 1031 exchange can defer both). Figures are a year-1 estimate at your 24.0% rate — not tax advice; consult a CPA.
Schools (NCES district)
- District
- Penn Hills SD
- NCES district ID
- 4218590
- Math proficiency
- 13% ▼ -6.00%
- Reading proficiency
- 24% ▼ -14.00%
- Median HH income
- $47,794
- Composite
- 16.42/100
- National rank
- #9192
- State rank
- #496 of 539 in PA
Livability — Monroeville
- Score
- 77/100
- State rank
- #358
- US rank
- #3140
Category grades
Schools grade is shown separately in the Schools card above.
Census & demographics
- County
- Allegheny County · 1,022,028 people
- City population
- 28,332
- Metro
- Pittsburgh, PA
- Population (ZIP)
- 33,951
- Household income
- $67,240
- Rent vs Own
- Severe rent burden
- 955.0
Population outlook (Allegheny County) Hauer SSP2
- Today (2025)
- 1,250,282 people
- By 2030
- 1,256,482 · +0.5%
- By 2040
- 1,256,318 · +0.5%
- By 2050
- 1,244,169 · -0.5%
- By 2075
- 1,197,693 · -4.2%
- By 2100
- 1,093,187 · -12.6%
Race, ethnicity, and origin ACS 2023
- Neighborhood character
- Diverse neighborhood (Simpson 0.58)
- Race & ethnicity
- White 51% Black 40% Two or more races 7% Hispanic / Latino 2%
- Common ancestry
- Romanian 5% Serbian 2% Slovak 1%
- Foreign-born
- 4% · Canada
- Languages at home
- 97% English-only · Other Indo-European 1% Spanish 1%
Political lean MEDSL · Allegheny
- 2024 margin
- Strong D (+20.3) · D 59.7% · R 39.4%
- 2008→2024 swing
- +4.8pp toward D · 2008: 15.5pp · 2024: 20.3pp
- All cycles
- 2024: D+20.3 2020: D+20.4 2016: D+16.4 2012: D+14.4 2008: D+15.5
Not yet ingested
- Civics
- —
Market trends
- HPI YoY
- ▼ -121.68%
- Current HPI
- 235.4861
- Rent YoY
- ▲ 7.63%
- Metro
- Pittsburgh, PA
- State GDP YoY
- ▲ 1.68%
- F500 in state
- 34
Industry mix (Fortune 500 HQ in PA)
| Industry | F500 HQs | Revenue |
|---|---|---|
| Healthcare | 2 | $309B |
|
||
| Insurance | 2 | $27B |
|
||
| Telecommunications / Media | 1 | $124B |
|
||
| Industrial Distribution | 1 | $22B |
|
||
| Financial Services | 1 | $20B |
|
||
| Chemicals / Materials | 1 | $18B |
|
||
Price history
+108.0% since first listed4 events — show timeline
- 2026-05-23 Listed $135,000 West Penn MLS
- 2001-03-02 Sold (Public Records) $58,500 Public Records
- 2001-02-28 Sold (MLS) $58,500 West Penn MLS
- 2001-01-22 Listed $64,900 West Penn MLS
Property tax history
+1.9%/yrLatest (2026): $1,992 · +0.0% YoY. Source: county tax records.
Cash-flow waterfall
monthlySold comps — $/sqft
last 12 mo · ≤1 miLoading sold comps…