3007 W Briarwood Cir · Port LaBelle, FL
Flood risk 1/10 · Minimal
- FEMA flood zone
- X (unshaded)
- Chance of flooding over 30 yrs
- 0.0%
- Est. flood insurance / yr
- $507 – $1,088
Fire risk 2/10 · Minimal
- Est. fire insurance / yr
- $947 – $1,759
Heat risk 9/10 · Severe
- Hot days now (above 108°F)
- 7 days/yr
- Hot days in 30 yrs
- 25 days/yr
Wind risk 10/10 · Severe
- Chance of severe wind over 30 yrs
- 99.0%
Air-quality risk 2/10 · Minimal
- Unhealthy air days now
- 0 days/yr
- Unhealthy air days in 30 yrs
- 1 days/yr
Risk factors via First Street. Map © Google.
Why this score? — see what drove the A grade
The composite is a weighted blend of 9 inputs, each scored 0–100. Each bar is that input's sub-score; the figure is the points it added to the 100-point composite (weight × sub-score).
- Cash flow +30.0/30.0
- ARV discount +15.0/15.0
- 1% rule +10.0/10.0
- DSCR +10.0/10.0
- Appreciation +10.0/10.0
- Schools +3.1/10.0
- Livability +3.1/5.0
- Rent growth +2.5/5.0
- Condition / age +2.5/5.0
$144,900
🖨 Deal sheet 📄 Offer letter ✓ Due diligence
Listing remarks
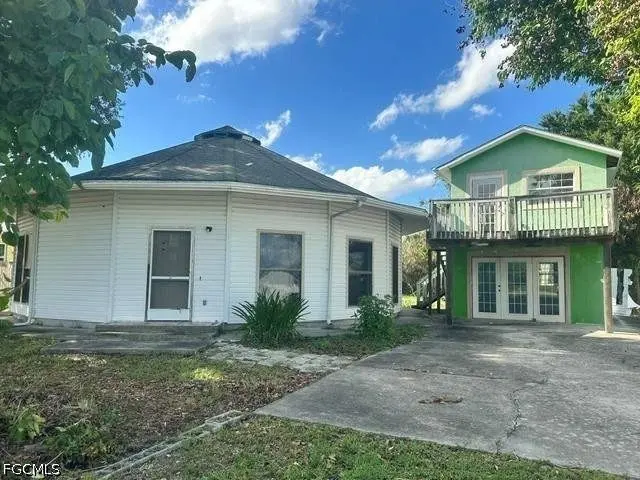
Unique architecture meets comfortable Florida living in this 3-bedroom, 2-bath octagon-style home located in the desirable Port LaBelle community. Nestled on a shady lot surrounded by mature trees, this distinctive residence offers character and functionality throughout. The open-concept design features a spacious living and dining area that flows seamlessly into the kitchen, creating an ideal space for everyday living and entertaining. Abundant windows fill the living areas with natural light, enhancing the home's bright and inviting atmosphere, while French doors provide easy access to the outdoors. The generously sized primary suite offers a peaceful retreat complete with a private bathr
Key facts
- Abundant windows
- French doors
- Open concept design
Tags
Property features AI
Finance
- Financial info: Pets allowed
- HOA & community: No association fee
Exterior
- Parking: Driveway; Paved parking
- Utilities: Cable available; Public water; Public sewer
- Home design: Single-story; Entry level: 1; Faces south; Resale property
- Construction: Shingle roof; Wood siding; Wood frame construction
- Exterior features: Storage; Outbuilding; Irregular lot; Private road frontage; North exposure
Interior
- Kitchen: Kitchen (12 x 15); Pantry
- Bedrooms: Master bedroom (10 x 10)
- Flooring: Tile flooring
- Bathrooms: 2 full bathrooms
- Heating & cooling: Central heating (electric); Central air conditioning (electric)
- Interior features: Single-hung windows; French doors; High ceilings; Living/dining room; Pantry; Tub with shower; Split bedroom layout; Unfurnished
Neighborhood map
What this means for you Summary
Snapshot
- This is a 3-bed/2.0-bath single-family listed at $145k.
Deal economics
- At list price, monthly cash flow is $593 ($7k/yr) — positive.
- The deal already cash-flows at list — no discount required.
- Meets the 1% rule at list price ($2k rent vs $145k).
- Cap rate 11.2% vs local median 5.1% in Port LaBelle — top-decile yield for the area; either an underpriced asset or a hidden risk that comps aren't pricing in. Stress-test before assuming the spread holds.
Location & tenants
- Location reads 62/100 on livability (#750 in FL) — a middle-class / working-renter tenant base. Strengths: cost of living A+, housing A+; Watch: schools F, amenities F, commute F.
- Hendry (town): math 35% / reading 40% proficiency, ranked #65 of 73 in FL (top 89%) — families likely to look elsewhere, expect single-tenant / working-renter base with shorter leases; 75% free/reduced lunch — lower-income household profile, screen leases tightly.
- Market conditions: 942 active listings in the ZIP; 6 comparable units currently listed for rent nearby; rentals at typical pace (median 24d on market — plan ~3-4 weeks tenant-placement turnaround); 557 units permitted in Hendry County in 2024 (45 in 5+ unit buildings).
- At $2,185/mo this rent would consume 46% of the median local household income ($57k/yr) (locally 498% of renters already pay >50% of income on rent) — very limited rent-growth headroom before tenants either downsize or default.
Forward outlook
- In year one you build about $15k of equity ($1k loan paydown + $14k appreciation (10.0% local appreciation)).
- Hendry County population projected to shrink 7% by 2050 — rents likely to lag national; underwrite the cash flow, not the appreciation.
- At projected returns (10.0% appreciation + 3.0% rent growth), your $41k cash investment doubles in ~2 years — after that, you're playing with house money.
- By year 3, paydown + projected appreciation supports a ~$39k cash-out refi (75% LTV) — recoverable capital for the next deal without selling this one.
Negotiation context
- Only 13 days on market — expect competitive offers; lowballing is unlikely to land.
- Current owner paid $16k; list at $145k implies a 811% gain — meaningful room to come down on a strong offer.
Risks & watch-outs
- Watch-outs: property tax is 2.6% of price.
- Climate carrying-cost: severe wind risk, 99% chance of damaging wind over 30y; extreme-heat days projected 7→25/yr by 2055 (HVAC capex compounding) — expect insurance premiums to compound above CPI over the hold.
Questions for the listing agent
- Property tax is high relative to price — has the assessment been appealed recently, and will the sale trigger a re-assessment?
- Is there a deadline driving the sale (1031 exchange, divorce, estate, relocation)? That informs how much negotiation room exists.
- Schools are F-rated, which usually means shorter tenancies and higher turnover. Who's the typical renter profile here, and what's been the actual vacancy rate?
- What's the average days-on-market for RENTAL listings here right now (not sales)? A rising rental-DOM trend means longer vacancies and softer asking-rent achievability than the comps imply.
- What's the recent tenant-quality profile in this submarket — average credit score on applications, eviction rate, late-payment / NSF rate, and stable-employment percentage? A property-management company in the area should have these aggregated.
- How much new for-sale + rental construction is in the pipeline within 1–3 miles? Heavy new supply typically softens prices + rents 12–24 months out; constrained supply supports both.
Investment metrics
- 1% rule
- 1.51% ✓
- Cap rate
- 11.20%
- Cash-on-cash
- 17.54%
- DSCR
- 1.78
- GRM
- 5.5
CMA / ARV
- ARV (on-the-fly)
- $251,900
- Comps found
- 12
Show comp detail 12 sales within ~0.75 mi
| Address | Dist | Beds/Ba | Sqft | Sold | Price | $/sf | Match |
|---|---|---|---|---|---|---|---|
| 2026 Hercules Rd | 0.31mi | 3/2.0 | 1,150 (+0%) | 23mo | $235,000 | $204 | 66 |
| 2041 Schooner Dr | 0.22mi | 2/1.5 (-1) | 1,020 (-11%) | 13mo | $192,900 | $189 | 54 |
| 3010 S Lakewood Rd | 0.23mi | 3/2.0 | 1,304 (+14%) | 20mo | $298,000 | $229 | 50 |
| 3012 S Lakewood Rd | 0.23mi | 3/2.0 | 1,304 (+14%) | 21mo | $280,000 | $215 | 49 |
| 3016 S Beechwood Cir | 0.70mi | 3/2.0 | 1,212 (+6%) | 12mo | $274,900 | $227 | 48 |
| 3027 N Lakewood Rd | 0.32mi | 2/2.0 (-1) | 1,040 (-9%) | 21mo | $265,000 | $255 | 47 |
| 2006 Inglewood Cir | 0.65mi | 3/2.0 | 1,246 (+9%) | 13mo | $265,990 | $213 | 44 |
| 2005 Showboat Ln | 0.28mi | 2/2.0 (-1) | 990 (-14%) | 19mo | $230,000 | $232 | 44 |
| 3055 Adcock Dr | 0.73mi | 3/2.5 | 1,160 (+1%) | 22mo | $255,000 | $220 | 43 |
| 2002 Anchor Ln | 0.40mi | 3/2.0 | 1,314 (+15%) | 17mo | $220,000 | $167 | 42 |
| 2004 Inglewood Cir | 0.66mi | 3/2.0 | 1,246 (+9%) | 18mo | $264,888 | $213 | 39 |
| 2029 Jeronimo Rd | 0.73mi | 3/2.0 | 1,292 (+13%) | 11mo | $299,900 | $232 | 35 |
Match score weights: distance 35% · size 25% · config 20% · recency 20%. Top-matched comps best support the ARV.
Projected returns pro-forma
10.0% appreciation · 3.0% rent growth · sell at horizon
- IRR
- 37.3%
- Equity multiple
- 3.88×
- Total profit
- $116,793
- Equity at exit
- $130,537
- IRR
- 32.2%
- Equity multiple
- 8.75×
- Total profit
- $314,467
- Equity at exit
- $281,509
Cash invested: $40,572 (down + closing). Projections, not guarantees.
Landlord ↔ Tenant lean methodology
- Overall (STATE)
- 87 Strongly Landlord-Friendly
- State Florida
- 87 Strongly Landlord-Friendly · R+3
- County
- — inherits STATE
- City
- — inherits STATE
ZIP-level market 33935
- Home prices YoY
- 16.3%
- Active inventory
- 942
- Price-to-rent
- 5.5×
Monthly cashflow live
- Estimated rent
- $2,185 high interval (Pro) →
- Mortgage (P&I)
- −$760
- Tax from tax record
- −$313 /mo · $3,761/yr
- Insurance
- −$60
- HOA
- −$0
- Vacancy / Maint / Mgmt
- −$459
- Net cashflow
- $593
Break-even live
UW: 25.0% down · 7.5% · 30yr · 1.5% tax · 5.0% vac · 8.0% maint · 8.0% mgmt
Financing live
Cash to close
- Down payment
- $36,225
- Closing costs
- $4,347
- Reserves months
- —
- Total cash needed
- —
Loan-product check · same deal, 3 products live
Conventional
25% down · 7.5% · 30yr
- Down + closing
- —
- Monthly P&I
- —
- Monthly cashflow
- —
- DSCR
- —
- Eligible?
- —
Personal DTI + credit; lowest rate.
DSCR
20% down · 8.5% · 30yr
- Down + closing
- —
- Monthly P&I
- —
- Monthly cashflow
- —
- DSCR
- —
- Eligible?
- —
No personal income docs; deal must DSCR.
Hard money
10% down · 12.0% · 12mo
- Down + closing
- —
- Monthly P&I
- —
- Monthly cashflow
- —
- DSCR
- —
- Eligible?
- —
Short-term bridge; refi at stabilization.
Rent comps 6 comps
| Address | Beds | Baths | Sqft | Rent | $/sqft | DOM | Units | Dist |
|---|---|---|---|---|---|---|---|---|
| 3020 N Lakewood Rd Labelle, FL | 4.0 | 2.0 | 1499 | $1,950 | $1.30 | 23d | 1 | 0.29mi |
| 3051 NW Beechwood Cir Labelle, FL | 4.0 | 2.0 | 1499 | $2,200 | $1.47 | 23d | 1 | 0.87mi |
| 5029 S Rosebud Cir Labelle, FL | 3.0 | 2.0 | 1389 | $1,780 | $1.28 | 23d | 1 | 1.13mi |
| 5029 W Hummingbird Dr Labelle, FL | 3.0 | 2.0 | 1212 | $2,450 | $2.02 | 3d | 1 | 1.21mi |
| 184 Village Cir Labelle, FL | 2.0 | 2.0 | 1239 | $2,000 | $1.61 | 3d | 1 | 1.48mi |
| 174 Village Cir Labelle, FL | 2.0 | 2.0 | 1224 | $1,600 | $1.31 | 23d | 1 | 1.50mi |
Listing history 11 events
-
2026-06-18days on market $144,900 Active 13 DOM
-
2026-06-17days on market $144,900 Active 12 DOM
-
2026-06-16days on market $144,900 Active 11 DOM
-
2026-06-15days on market $144,900 Active 10 DOM
-
2026-06-13days on market $144,900 Active 8 DOM
-
2026-06-13days on market $144,900 Active 7 DOM
-
2026-06-10days on market $144,900 Active 5 DOM
-
2026-06-09days on market $144,900 Active 4 DOM
-
2026-06-08days on market $144,900 Active 3 DOM
-
2026-06-07remarks 699-char remark
-
2026-06-07$144,900 Active 2 DOM
ⓘ Source: listings_history table (triggers on properties + properties_extension) + one-shot
backfill from property_details.listing_events for pre-trigger history.
Tax reassessment forecast FL · Resets to sale price
- Current annual tax
- $3,761 · $313/mo
- Projected year-2 tax
- $3,761 · $313/mo
- Expected delta
- $0/yr ($0/mo · 0.0%)
ⓘ Screening estimate from a state-policy table — verify with the county assessor before closing.
Climate risk First Street
- Flood 1/10 Low FEMA zone X (unshaded) · 0% chance over 30 yrs
- Wildfire 2/10 Low
- Heat 9/10 Extreme 7 d/yr ≥108°F today · 25 d/yr by 30 yrs out
- Wind 10/10 Extreme 99% chance of damaging wind over 30 yrs
- Air quality 2/10 Low 0 unhealthy d/yr today · 1 by 30 yrs out
Nearby sold comps map
Loading sold comps map…
Walkable amenities ~0.75 mi
Loading nearby amenities…
Taxation est. · year 1
- Rental income
- $26,226
- − Mortgage interest
- −$8,117
- − Property taxes
- −$3,761
- − Insurance
- −$724
- − Repairs & maintenance
- −$2,098
- − Management
- −$2,098
- − Depreciation
- −$4,215
- Taxable income
- $5,213
- Est. tax owed @ 24.0%
- −$1,251
- After-tax cash flow
- $5,864/yr
For passive investors: Depreciation is non-cash, so a rental often shows a tax loss while cash-flowing — sheltering income. Rental losses are passive: they offset passive income freely, and up to $25,000/yr can offset ordinary (W-2) income if you actively participate and your MAGI is under $100k (phasing out to $0 by $150k); unused losses carry forward. On sale, claimed depreciation is recaptured at up to 25%, and gains may owe capital-gains tax (a 1031 exchange can defer both). Figures are a year-1 estimate at your 24.0% rate — not tax advice; consult a CPA.
Schools (NCES district)
- District
- Hendry
- NCES district ID
- 1200780
- Math proficiency
- 35% ▼ -11.00%
- Reading proficiency
- 40% ▼ -4.00%
- Median HH income
- $37,043
- Composite
- 31.16/100
- National rank
- #6054
- State rank
- #65 of 73 in FL
Livability — Port LaBelle
- Score
- 62/100
- State rank
- #750
- US rank
- #16264
Category grades
Schools grade is shown separately in the Schools card above.
Census & demographics
- Census place
- Port LaBelle, FL
- County
- Hendry County · 23,186 people
- Metro
- Clewiston, FL
- Population (ZIP)
- 23,186
- Household income
- $57,009
- Rent vs Own
- Severe rent burden
- 498.0
Population outlook (Hendry County) Hauer SSP2
- Today (2025)
- 38,866 people
- By 2030
- 38,558 · -0.8%
- By 2040
- 37,743 · -2.9%
- By 2050
- 36,117 · -7.1%
- By 2075
- 30,070 · -22.6%
- By 2100
- 21,966 · -43.5%
Race, ethnicity, and origin ACS 2023
- Neighborhood character
- Majority Hispanic (56%)
- Race & ethnicity
- Hispanic / Latino 56% White 39% Two or more races 21% Black 2% Native American 2%
- Hispanic origin (detail)
- Mexican 40% Puerto Rican 3% Cuban 5%
- Common ancestry
- Lithuanian 2% Serbian 2% Slovak 1%
- Foreign-born
- 27% · Canada, Jamaica
- Languages at home
- 50% English-only · Spanish 50%
Political lean MEDSL · Hendry
- 2024 margin
- Solid R (+38.3) · D 30.4% · R 68.7%
- 2008→2024 swing
- -31.1pp toward R · 2008: -7.2pp · 2024: -38.3pp
- All cycles
- 2024: R+38.3 2020: R+23.0 2016: R+14.2 2012: R+5.9 2008: R+7.2
Not yet ingested
- Civics
- —
Market trends
- HPI YoY
- ▲ 75.20%
- Current HPI
- 537.4928
- Rent YoY
- —
- Metro
- Clewiston, FL
- State GDP YoY
- ▲ 3.28%
- F500 in state
- 36
Industry mix (Fortune 500 HQ in FL)
| Industry | F500 HQs | Revenue |
|---|---|---|
| Industrial Technology | 2 | $29B |
|
||
| Insurance | 2 | $17B |
|
||
| Retail | 1 | $60B |
|
||
| Technology Distribution | 1 | $58B |
|
||
| Homebuilding | 1 | $35B |
|
||
| Technology Manufacturing | 1 | $35B |
|
||
Price history
+811.3% since first listed2 events — show timeline
- 2026-06-05 Listed $144,900 FORTMLS
- 1999-12-27 Sold (Public Records) $15,900 Public Records
Property tax history
+17.8%/yrLatest (2025): $3,761 · +5.6% YoY. Source: county tax records.
Cash-flow waterfall
monthlySold comps — $/sqft
last 12 mo · ≤1 miLoading sold comps…