 11-Plex
TBD De Moye Ln · Aubrey, TX
Flood risk No data
- FEMA flood zone
- —
- Chance of flooding over 30 yrs
- —
- Est. flood insurance / yr
- —
Fire risk No data
- Est. fire insurance / yr
- —
Heat risk No data
- Hot days now (above threshold)
- —
- Hot days in 30 yrs
- —
Wind risk No data
- Chance of severe wind over 30 yrs
- —
Air-quality risk No data
- Unhealthy air days now
- —
- Unhealthy air days in 30 yrs
- —
Risk factors via First Street. Map © Google.
Why this score? — see what drove the D+ grade
The composite is a weighted blend of 9 inputs, each scored 0–100. Each bar is that input's sub-score; the figure is the points it added to the 100-point composite (weight × sub-score).
- Cash flow +15.0/30.0
- ARV discount +7.5/15.0
- 1% rule +5.0/10.0
- DSCR +5.0/10.0
- Schools +4.6/10.0
- Livability +3.6/5.0
- Condition / age +2.5/5.0
- Rent growth +2.0/5.0
- Appreciation +0.0/10.0
$399,900
🖨 Deal sheet 📄 Offer letter ✓ Due diligence
Multi-family units
County records classify this as Multi-Family (5+ Unit). Listing-text estimate: 11 units. confirmed
5+ unit building — per-unit beds/baths from public records are typically unavailable; the breakdown below (if shown) is an estimate from the listing text.
Listing remarks
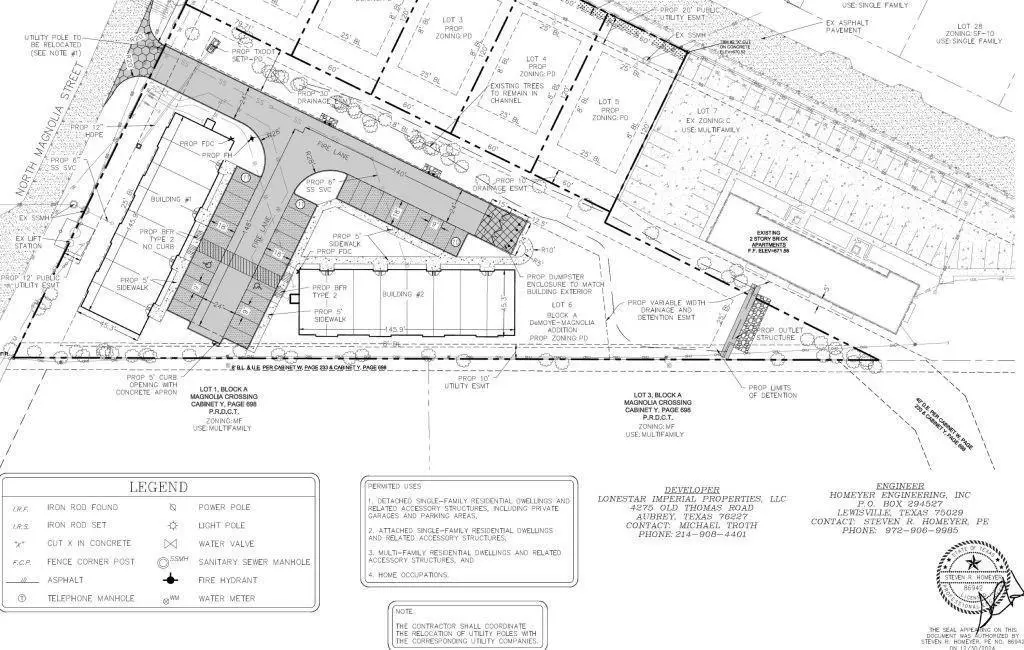
A Shovel-Ready Multifamily Parcel. An entitled 1.63-acre multifamily development site situated in one of North Texas's fastest-growing suburban markets. This parcel — Lot 6, Block A of the De Moye-Magnolia Addition — arrives with City-approved Planned Development zoning designating it for multifamily residential use, entitling a developer to build up to 16 dwelling units without additional zoning action. Updated civil plans included in sale. Begin permitting and construction immediately upon closing. At $399,900 for 16 approved units, land cost per door is $25K - among the lowest available for entitled multifamily in Denton County. All 16 units are approved as 2-bedroom dwelling
Key facts
- 16 dwelling units
- 1.63 acre lot
- Parking
Tags
Property features AI
Finance
- Other: Property subtype: Multi Family; Will not subdivide; Subdivision: DeMoye Magnolia Addition; Parcel number R982282
- Financial info: Listing accepted financing: Cash, Conventional, FHA, VA; No gross annual income/expenses reported for the multi-unit property
- HOA & community: No association
Exterior
- Parking: 1 parking space (assigned, open); No garage or carport spaces specified
- Utilities: City water; City sewer; Not in a municipal utility district
- Home design: Residential income property (multi-family); Two buildings; 16 total units; Proposed year built 2026
- Construction: Composition roof; Construction materials: See remarks; Foundation: Other; Proposed construction (2026)
- Exterior features: Wood fencing; Lot is level and acreage (1.63 acres)
Interior
- Kitchen: No appliances listed
- Bedrooms: 32 total bedrooms
- Flooring: See remarks
- Bathrooms: 16 full bathrooms
- Heating & cooling: Natural gas heating; No cooling
- Interior features: Two levels; Interior features: Other; Flooring: See remarks
- Laundry & utility: No cooling; natural gas heating
Neighborhood map
What this means for you Summary
Snapshot
- This is a 11 × 3-bed/?-bath units multifamily listed at $400k.
Deal economics
- At list price, monthly cash flow is $15k ($176k/yr) — positive. Per door: $1k/mo.
- The deal already cash-flows at list — no discount required.
- Meets the 1% rule at list price ($22k rent vs $400k).
- Recommended offer: $394k (1.5% below list) — sets the bar for market timing.
- Cap rate 50.3% vs local median 3.4% in Aubrey — top-decile yield for the area; either an underpriced asset or a hidden risk that comps aren't pricing in. Stress-test before assuming the spread holds.
Location & tenants
- Location reads 71/100 on livability (#332 in TX) — a middle-class / working-renter tenant base. Strengths: cost of living A+, housing A+, employment B; Watch: crime C-, amenities F, commute F.
- Aubrey ISD (rural): math 50% / reading 52% proficiency, ranked #119 of 826 in TX (top 14%) — acceptable for families but not a draw, mixed tenant base, ~2y average lease.
- Market conditions: Rents soft (-1.9%/yr); 1885 active listings in the ZIP; high-income renter base; 10,531 units permitted in Denton County in 2024 (2,713 in 5+ unit buildings).
- At $22,058/mo this rent would consume 238% of the median local household income ($111k/yr) (locally 959% of renters already pay >50% of income on rent) — very limited rent-growth headroom before tenants either downsize or default.
Forward outlook
- Local home prices are declining (-3.0%/yr); year-one equity from $3k of loan paydown is wiped out by about $12k of value loss. Plan a longer hold.
- Denton County population projected at +66% by 2050 — long-run rental-demand tailwind backs the buy-and-hold thesis.
- At projected returns (-3.0% appreciation + 0.0% rent growth), your $112k cash investment doubles in ~1 year — after that, you're playing with house money.
Negotiation context
- It's been on market 19 days — a 2% lower offer ($394k) is reasonable based on typical stale-listing flexibility.
- 2 sale attempts with the ask held roughly flat each time — persistent listings suggest the price (not the market) is what's stuck; bring a comps-based counter.
Questions for the listing agent
- Can we see the unit-by-unit rent roll, current vacancy, and any below-market leases? What's the average tenancy length?
- What capital expenditures (roof, boiler, parking lot, exteriors) have been made in the last 5 years, and what's planned in the next 2?
- Is there a deadline driving the sale (1031 exchange, divorce, estate, relocation)? That informs how much negotiation room exists.
- The area grade is low — what's the realistic commute time and amenity access for the typical tenant pool here? Any planned neighborhood developments (good or bad) we should know about?
- What's the average days-on-market for RENTAL listings here right now (not sales)? A rising rental-DOM trend means longer vacancies and softer asking-rent achievability than the comps imply.
- What's the recent tenant-quality profile in this submarket — average credit score on applications, eviction rate, late-payment / NSF rate, and stable-employment percentage? A property-management company in the area should have these aggregated.
- How much new apartment / multifamily construction is in the pipeline within 1–3 miles? Heavy new supply (>2% of stock underway) typically softens rents 12–24 months out; light construction supports rent growth.
Investment metrics
- 1% rule
- 5.52% ✓
- Cap rate
- 50.29%
- Cash-on-cash
- 157.13%
- DSCR
- 7.99
- GRM
- 1.5
CMA / ARV
No comps found within radius.
Projected returns pro-forma
-3.0% appreciation · 0.0% rent growth · sell at horizon
- IRR
- —
- Equity multiple
- 8.19×
- Total profit
- $804,732
- Equity at exit
- $59,626
- IRR
- —
- Equity multiple
- 15.78×
- Total profit
- $1,654,750
- Equity at exit
- $34,576
Cash invested: $111,972 (down + closing). Projections, not guarantees.
Landlord ↔ Tenant lean methodology
- Overall (STATE)
- 87 Strongly Landlord-Friendly
- State Texas
- 87 Strongly Landlord-Friendly · R+5
- County
- — inherits STATE
- City
- — inherits STATE
ZIP-level market 76227
- Home prices YoY
- -19.0%
- Rents YoY
- -1.9%
- Active inventory
- 1885
- Price-to-rent
- 16.6×
Monthly cashflow live
- Estimated rent
- $22,058 high interval (Pro) →
- Mortgage (P&I)
- −$2,097
- Tax est. 1.5%
- −$500 /mo · $5,998/yr
- Insurance
- −$167
- HOA
- −$0
- Vacancy / Maint / Mgmt
- −$4,632
- Net cashflow
- $14,662
Break-even live
11-unit breakdown (identical units grouped — click to expand)
| Units | Beds | Baths | Est. rent |
|---|---|---|---|
| 11× units | 3 | — | $22,055 |
| #1 | 3 | — | $2,005 |
| #2 | 3 | — | $2,005 |
| #3 | 3 | — | $2,005 |
| #4 | 3 | — | $2,005 |
| #5 | 3 | — | $2,005 |
| #6 | 3 | — | $2,005 |
| #7 | 3 | — | $2,005 |
| #8 | 3 | — | $2,005 |
| #9 | 3 | — | $2,005 |
| #10 | 3 | — | $2,005 |
| #11 | 3 | — | $2,005 |
| Total (11 units) | $22,058 | ||
UW: 25.0% down · 7.5% · 30yr · 1.5% tax · 5.0% vac · 8.0% maint · 8.0% mgmt
Financing live
Cash to close
- Down payment
- $99,975
- Closing costs
- $11,997
- Reserves months
- —
- Total cash needed
- —
Loan-product check · same deal, 3 products live
Conventional
25% down · 7.5% · 30yr
- Down + closing
- —
- Monthly P&I
- —
- Monthly cashflow
- —
- DSCR
- —
- Eligible?
- —
Personal DTI + credit; lowest rate.
DSCR
20% down · 8.5% · 30yr
- Down + closing
- —
- Monthly P&I
- —
- Monthly cashflow
- —
- DSCR
- —
- Eligible?
- —
No personal income docs; deal must DSCR.
Hard money
10% down · 12.0% · 12mo
- Down + closing
- —
- Monthly P&I
- —
- Monthly cashflow
- —
- DSCR
- —
- Eligible?
- —
Short-term bridge; refi at stabilization.
Listing history 15 events
-
2026-06-18days on market $399,900 Active 19 DOM
-
2026-06-17days on market $399,900 Active 18 DOM
-
2026-06-16days on market $399,900 Active 17 DOM
-
2026-06-15days on market $399,900 Active 16 DOM
-
2026-06-13days on market $399,900 Active 14 DOM
-
2026-06-13days on market $399,900 Active 13 DOM
-
2026-06-09days on market $399,900 Active 10 DOM
-
2026-06-08days on market $399,900 Active 9 DOM
-
2026-06-07days on market $399,900 Active 8 DOM
-
2026-06-04days on market $399,900 Active 5 DOM
-
2026-06-03days on market $399,900 Active 4 DOM
-
2026-06-02days on market $399,900 Active 3 DOM
-
2026-06-01days on market $399,900 Active 2 DOM
-
2026-05-31remarks 687-char remark
-
2026-05-31$399,900 Active 1 DOM
ⓘ Source: listings_history table (triggers on properties + properties_extension) + one-shot
backfill from property_details.listing_events for pre-trigger history.
Nearby sold comps map
Loading sold comps map…
Walkable amenities ~0.75 mi
Loading nearby amenities…
Taxation est. · year 1
- Rental income
- $264,696
- − Mortgage interest
- −$22,401
- − Property taxes
- −$5,998
- − Insurance
- −$2,000
- − Repairs & maintenance
- −$21,176
- − Management
- −$21,176
- − Depreciation
- −$11,633
- Taxable income
- $180,313
- Est. tax owed @ 24.0%
- −$43,275
- After-tax cash flow
- $132,671/yr
For passive investors: Depreciation is non-cash, so a rental often shows a tax loss while cash-flowing — sheltering income. Rental losses are passive: they offset passive income freely, and up to $25,000/yr can offset ordinary (W-2) income if you actively participate and your MAGI is under $100k (phasing out to $0 by $150k); unused losses carry forward. On sale, claimed depreciation is recaptured at up to 25%, and gains may owe capital-gains tax (a 1031 exchange can defer both). Figures are a year-1 estimate at your 24.0% rate — not tax advice; consult a CPA.
Schools (NCES district)
- District
- Aubrey ISD
- NCES district ID
- 4808910
- Math proficiency
- 50% ▼ -9.00%
- Reading proficiency
- 52% ▼ -3.00%
- Median HH income
- $77,154
- Composite
- 46.21/100
- National rank
- #2492
- State rank
- #119 of 826 in TX
Livability — Aubrey
- Score
- 71/100
- State rank
- #332
- US rank
- #7241
Category grades
Schools grade is shown separately in the Schools card above.
Census & demographics
- Census place
- Aubrey, TX
- County
- Denton County · 901,654 people
- City population
- 62,127
- Metro
- Dallas-Fort Worth-Arlington, TX
- Population (ZIP)
- 62,127
- Household income
- $111,402
- Rent vs Own
- Severe rent burden
- 959.0
Population outlook (Denton County) Hauer SSP2
- Today (2025)
- 1,053,010 people
- By 2030
- 1,192,269 · +13.2%
- By 2040
- 1,472,920 · +39.9%
- By 2050
- 1,746,506 · +65.9%
- By 2075
- 2,358,497 · +124.0%
- By 2100
- 2,779,183 · +163.9%
Race, ethnicity, and origin ACS 2023
- Neighborhood character
- Diverse neighborhood (Simpson 0.63)
- Race & ethnicity
- White 55% Black 19% Hispanic / Latino 17% Two or more races 13% Asian 4%
- Hispanic origin (detail)
- Mexican 12% Puerto Rican 1%
- Common ancestry
- Lithuanian 4% Slovak 2% Italian 1%
- Foreign-born
- 11% · Canada, Jamaica
- Languages at home
- 82% English-only · Spanish 10% Other Indo-European 2% Other Asian/Pacific 2%
Political lean MEDSL · Denton
- 2024 margin
- R (+13.2) · D 42.7% · R 55.8% · Other 1.5%
- 2008→2024 swing
- +11.0pp toward D · 2008: -24.2pp · 2024: -13.2pp
- All cycles
- 2024: R+13.2 2020: R+8.1 2016: R+20.2 2012: R+31.7 2008: R+24.2
Not yet ingested
- Civics
- —
Market trends
- HPI YoY
- ▼ -59.76%
- Current HPI
- 254.2895
- Rent YoY
- ▼ -1.88%
- Metro
- Dallas-Fort Worth-Arlington, TX
- State GDP YoY
- ▲ 3.95%
- F500 in state
- 110
Industry mix (Fortune 500 HQ in TX)
| Industry | F500 HQs | Revenue |
|---|---|---|
| Energy | 16 | $1,198B |
|
||
| Technology | 5 | $198B |
|
||
| Engineering / Construction | 4 | $72B |
|
||
| Energy Services | 3 | $60B |
|
||
| Utilities | 3 | $41B |
|
||
| Healthcare | 2 | $330B |
|
||
Price history
-42.8% since first listed7 events — show timeline
- 2026-05-30 Listed $399,900 NTREIS
- 2026-03-15 Listing Removed — NTREIS
- 2026-02-02 Price Changed $479,000 NTREIS
- 2025-12-30 Price Changed $499,000 NTREIS
- 2025-11-13 Price Changed $549,000 NTREIS
- 2025-10-08 Price Changed $599,000 NTREIS
- 2025-09-17 Listed $699,000 NTREIS
Cash-flow waterfall
monthlySold comps — $/sqft
last 12 mo · ≤1 miLoading sold comps…