2393 State Route 80 · Springfield Center, NY
Flood risk 1/10 · Minimal
- FEMA flood zone
- X
- Chance of flooding over 30 yrs
- 0.0%
- Est. flood insurance / yr
- $473 – $860
Fire risk 2/10 · Minimal
- Est. fire insurance / yr
- $691 – $1,283
Heat risk 1/10 · Minimal
- Hot days now (above 89°F)
- 7 days/yr
- Hot days in 30 yrs
- 17 days/yr
Wind risk 2/10 · Minimal
- Chance of severe wind over 30 yrs
- 1.0%
Air-quality risk 1/10 · Minimal
- Unhealthy air days now
- 0 days/yr
- Unhealthy air days in 30 yrs
- 0 days/yr
Risk factors via First Street. Map © Google.
Why this score? — see what drove the D+ grade
The composite is a weighted blend of 9 inputs, each scored 0–100. Each bar is that input's sub-score; the figure is the points it added to the 100-point composite (weight × sub-score).
- Cash flow +15.0/30.0
- ARV discount +7.5/15.0
- 1% rule +5.0/10.0
- DSCR +5.0/10.0
- Appreciation +5.0/10.0
- Schools +4.1/10.0
- Rent growth +2.5/5.0
- Livability +2.5/5.0
- Condition / age +2.5/5.0
$10,000
🖨 Deal sheet 📄 Offer letter ✓ Due diligence
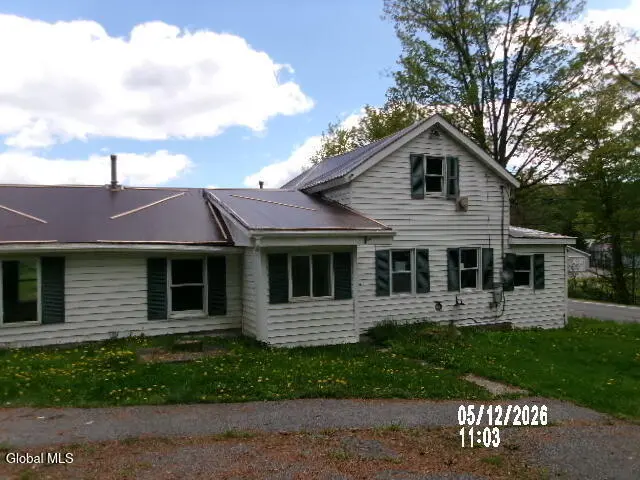
Listing remarks
* * * MULTIPLE OFFERS, HIGHEST AND BEST DUE IN BY 6/4/26 BY 2PM EST * * * Opportunity awaits with this charming 2-bedroom, 2 bath, 1.5-story home situated on a picturesque 1-acre lot in a peaceful suburban setting within the Van Hornesville School District. Built circa 1800, this property offers historic character and endless potential for renovation, restoration, or use as a country getaway. The home features 936 square feet of living space, including a first-floor layout with a kitchen and flexible living areas. A detached feel with plenty of open outdoor space provides room for gardening, recreation, or future improvements. The property also includes a one-car attached garage built
Key facts
- Open outdoor space
- Private sewer system
- Country getaway
Tags
Property features AI
Exterior
- Parking: Attached garage (1 car); Driveway parking; Additional off-street parking (total 4 spaces)
- Utilities: Public water; Septic tank sewer
- Home design: Single family residence; One-acre lot
- Construction: Vinyl siding construction
- Exterior features: Front porch; Shingle (asphalt) roof; Vinyl siding
Interior
- Kitchen: Kitchen on the first floor
- Bedrooms: One bedroom on the second floor; One bedroom on the first floor
- Bathrooms: Two full bathrooms (one on the first floor, one on the second floor)
- Heating & cooling: Electric heating
- Interior features: Partial, unfinished basement; Five total rooms
Neighborhood map
What this means for you Summary
Snapshot
- This is a 2-bed/2.0-bath single-family listed at $10k.
Deal economics
- At list price, monthly cash flow is $659 ($8k/yr) — positive.
- The deal already cash-flows at list — no discount required.
- Meets the 1% rule at list price ($921 rent vs $10k).
Location & tenants
- Location reads: area grade D — affects rentability + tenant quality, not the cash-flow math above.
- Van Hornesville-Owen D Young Central School District (rural): math 40% / reading 50% proficiency, ranked #567 of 755 in NY (top 75%) — families likely to look elsewhere, expect single-tenant / working-renter base with shorter leases.
- Market conditions: 1 active listings in the ZIP; 54 units permitted in Herkimer County in 2024 (0 in 5+ unit buildings).
Forward outlook
- In year one you build about $369 of equity ($69 loan paydown + $300 appreciation (3.0% local appreciation)).
- Herkimer County population projected at -24% by 2050 — secular population decline; favor cash flow + early exit over multi-decade hold.
- At projected returns (3.0% appreciation + 3.0% rent growth), your $3k cash investment doubles in ~1 year — after that, you're playing with house money.
Negotiation context
- Only 12 days on market — expect competitive offers; lowballing is unlikely to land.
Risks & watch-outs
- Watch-outs: built in 1800 — expect roof / HVAC / electrical / plumbing capex.
Questions for the listing agent
- Built in 1800 — when were the roof, HVAC, electrical panel, plumbing, and water heater last replaced?
- Is there a deadline driving the sale (1031 exchange, divorce, estate, relocation)? That informs how much negotiation room exists.
- The area grade is low — what's the realistic commute time and amenity access for the typical tenant pool here? Any planned neighborhood developments (good or bad) we should know about?
- What's the average days-on-market for RENTAL listings here right now (not sales)? A rising rental-DOM trend means longer vacancies and softer asking-rent achievability than the comps imply.
- What's the recent tenant-quality profile in this submarket — average credit score on applications, eviction rate, late-payment / NSF rate, and stable-employment percentage? A property-management company in the area should have these aggregated.
- How much new for-sale + rental construction is in the pipeline within 1–3 miles? Heavy new supply typically softens prices + rents 12–24 months out; constrained supply supports both.
Investment metrics
- 1% rule
- 9.21% ✓
- Cap rate
- 85.32%
- Cash-on-cash
- 282.23%
- DSCR
- 13.56
- GRM
- 0.9
CMA / ARV
No comps found within radius.
Projected returns pro-forma
3.0% appreciation · 3.0% rent growth · sell at horizon
- IRR
- —
- Equity multiple
- 16.41×
- Total profit
- $43,161
- Equity at exit
- $4,496
- IRR
- —
- Equity multiple
- 34.89×
- Total profit
- $94,889
- Equity at exit
- $6,930
Cash invested: $2,800 (down + closing). Projections, not guarantees.
Landlord ↔ Tenant lean methodology
- Overall (STATE)
- 15 Strongly Tenant-Friendly
- State New York
- 15 Strongly Tenant-Friendly · D+10
- County
- — inherits STATE
- City
- — inherits STATE
ZIP-level market 13475
- Active inventory
- 1
- Price-to-rent
- 0.9×
Monthly cashflow live
- Estimated rent
- $921 medium interval (Pro) →
- Mortgage (P&I)
- −$52
- Tax est. 1.5%
- −$12 /mo · $150/yr
- Insurance
- −$4
- HOA
- −$0
- Vacancy / Maint / Mgmt
- −$193
- Net cashflow
- $659
Break-even live
UW: 25.0% down · 7.5% · 30yr · 1.5% tax · 5.0% vac · 8.0% maint · 8.0% mgmt
Financing live
Cash to close
- Down payment
- $2,500
- Closing costs
- $300
- Reserves months
- —
- Total cash needed
- —
Loan-product check · same deal, 3 products live
Conventional
25% down · 7.5% · 30yr
- Down + closing
- —
- Monthly P&I
- —
- Monthly cashflow
- —
- DSCR
- —
- Eligible?
- —
Personal DTI + credit; lowest rate.
DSCR
20% down · 8.5% · 30yr
- Down + closing
- —
- Monthly P&I
- —
- Monthly cashflow
- —
- DSCR
- —
- Eligible?
- —
No personal income docs; deal must DSCR.
Hard money
10% down · 12.0% · 12mo
- Down + closing
- —
- Monthly P&I
- —
- Monthly cashflow
- —
- DSCR
- —
- Eligible?
- —
Short-term bridge; refi at stabilization.
Listing history 10 events
-
2026-06-13status $10,000 Pending 12 DOM
-
2026-06-12days on market $10,000 Active 12 DOM
-
2026-06-09days on market $10,000 Active 9 DOM
-
2026-06-08days on market $10,000 Active 8 DOM
-
2026-06-07days on market $10,000 Active 7 DOM
-
2026-06-07days on market $10,000 Active 6 DOM
-
2026-06-04days on market $10,000 Active 3 DOM
-
2026-06-02days on market $10,000 Active 2 DOM
-
2026-06-01remarks 699-char remark
-
2026-06-01$10,000 Active 1 DOM
ⓘ Source: listings_history table (triggers on properties + properties_extension) + one-shot
backfill from property_details.listing_events for pre-trigger history.
Climate risk First Street
- Flood 1/10 Low FEMA zone X · 0% chance over 30 yrs
- Wildfire 2/10 Low
- Heat 1/10 Low 7 d/yr ≥89°F today · 17 d/yr by 30 yrs out
- Wind 2/10 Low 100% chance of damaging wind over 30 yrs
- Air quality 1/10 Low 0 unhealthy d/yr today · 0 by 30 yrs out
Nearby sold comps map
Loading sold comps map…
Walkable amenities ~0.75 mi
Loading nearby amenities…
Taxation est. · year 1
- Rental income
- $11,053
- − Mortgage interest
- −$560
- − Property taxes
- −$150
- − Insurance
- −$50
- − Repairs & maintenance
- −$884
- − Management
- −$884
- − Depreciation
- −$291
- Taxable income
- $8,233
- Est. tax owed @ 24.0%
- −$1,976
- After-tax cash flow
- $5,926/yr
For passive investors: Depreciation is non-cash, so a rental often shows a tax loss while cash-flowing — sheltering income. Rental losses are passive: they offset passive income freely, and up to $25,000/yr can offset ordinary (W-2) income if you actively participate and your MAGI is under $100k (phasing out to $0 by $150k); unused losses carry forward. On sale, claimed depreciation is recaptured at up to 25%, and gains may owe capital-gains tax (a 1031 exchange can defer both). Figures are a year-1 estimate at your 24.0% rate — not tax advice; consult a CPA.
Schools (NCES district)
- District
- Van Hornesville-Owen D Young Central School District
- NCES district ID
- 3622200
- Math proficiency
- 40% ▬ 0.00%
- Reading proficiency
- 50% ▲ 10.00%
- Median HH income
- $48,116
- Composite
- 40.66/100
- National rank
- #7620
- State rank
- #567 of 755 in NY
Livability — Springfield Center
No livability data for this city. (Only ~50 U.S. cities are tracked.)
Census & demographics
- City population
- 305
- Population (ZIP)
- 49
Population outlook (Herkimer County) Hauer SSP2
- Today (2025)
- 59,340 people
- By 2030
- 56,838 · -4.2%
- By 2040
- 51,098 · -13.9%
- By 2050
- 45,080 · -24.0%
- By 2075
- 32,648 · -45.0%
- By 2100
- 22,266 · -62.5%
Race, ethnicity, and origin ACS 2023
- Neighborhood character
- Predominantly White (84%)
- Race & ethnicity
- White 84% Two or more races 16%
- Common ancestry
- Iranian 14% Portuguese 12% German 6%
- Languages at home
- 93% English-only · Other Indo-European 7%
Political lean MEDSL · Herkimer
- 2024 margin
- Solid R (+36.4) · D 31.8% · R 68.2%
- 2008→2024 swing
- -27.1pp toward R · 2008: -9.3pp · 2024: -36.4pp
- All cycles
- 2024: R+36.4 2020: R+30.5 2016: R+34.5 2012: R+8.4 2008: R+9.3
Not yet ingested
- Civics
- —
Market trends
- HPI YoY
- —
- Current HPI
- —
- Rent YoY
- —
- Metro
- —
- State GDP YoY
- ▲ 2.60%
- F500 in state
- 92
Industry mix (Fortune 500 HQ in NY)
| Industry | F500 HQs | Revenue |
|---|---|---|
| Financial Services | 10 | $950B |
|
||
| Consumer Goods | 9 | $162B |
|
||
| Insurance | 4 | $225B |
|
||
| Telecommunications | 2 | $144B |
|
||
| Pharmaceuticals | 2 | $112B |
|
||
| Media / Entertainment | 2 | $69B |
|
||
Price history
1 event — show timeline
- 2026-05-31 Listed $10,000 Global MLS
Cash-flow waterfall
monthlySold comps — $/sqft
last 12 mo · ≤1 miLoading sold comps…