 Duplex
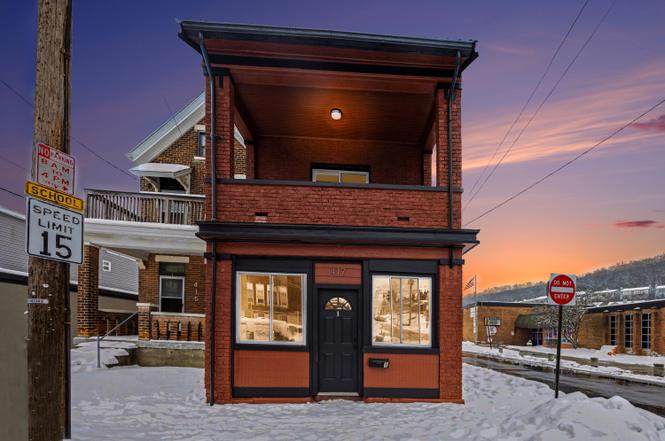
417 W 19th St · Covington, KY
Flood risk 5/10 · Moderate
- FEMA flood zone
- X (unshaded)
- Chance of flooding over 30 yrs
- 0.24%
- Est. flood insurance / yr
- $507 – $1,088
Fire risk 1/10 · Minimal
- Est. fire insurance / yr
- $839 – $1,559
Heat risk 5/10 · Moderate
- Hot days now (above 102°F)
- 7 days/yr
- Hot days in 30 yrs
- 20 days/yr
Wind risk 2/10 · Minimal
- Chance of severe wind over 30 yrs
- 1.0%
Air-quality risk 3/10 · Minor
- Unhealthy air days now
- 2 days/yr
- Unhealthy air days in 30 yrs
- 3 days/yr
Risk factors via First Street. Map © Google.
Why this score? — see what drove the D+ grade
The composite is a weighted blend of 9 inputs, each scored 0–100. Each bar is that input's sub-score; the figure is the points it added to the 100-point composite (weight × sub-score).
- Cash flow +19.3/30.0
- DSCR +6.1/10.0
- ARV discount +6.1/15.0
- 1% rule +4.3/10.0
- Livability +4.3/5.0
- Rent growth +3.8/5.0
- Condition / age +2.5/5.0
- Schools +1.5/10.0
- Appreciation +0.0/10.0
$269,000
🖨 Deal sheet (PDF) 📄 Offer letter ✓ Due diligence
Multi-family units
County records classify this as Multi-Family (2-4 Unit). Listing-text estimate: 2 units. confirmed
Listing remarks MLS
Duplex in a great location with detached garage ready to rent or use. Up stairs/2nd floor unit has recently been renovated and features covered balcony, 1 bed, 1 bath, with W/D hook ups, basement storage, private side entrance. butcher block countertops, tall ceilings, gas range, and LVT Flooring. 1st floor unit is a 2 bedroom 1.5 bath with private front and rear entrance featuring fenced in private patio. Building is vacant and ready for it's new owner. Separate meters.
Key facts
- 1,307 sq ft lot
- Parking
- Built 1917
Property features AI
Finance
- Financial info: Two total units (multi-family)
Exterior
- Parking: On-street parking
- Utilities: Public water; Public sewer
- Home design: Two-story multi-family property; Built in 1917
- Construction: Brick exterior; Concrete perimeter and stone foundation; Shingle roof; Built in 1917
- Exterior features: Shingle roof; Brick construction; Lot approximately 0.03 acres
Interior
- Kitchen: Electric range, Gas range, Dishwasher, Microwave, Refrigerator
- Heating & cooling: Central air conditioning; Forced air heating
- Interior features: Full basement; Electric range, Gas range, Dishwasher, Microwave, Refrigerator
Neighborhood map
What this means for you Summary
Snapshot
- This is a 1×1bd/1.0ba + 1×2bd/1.0ba units multifamily listed at $269k.
Deal economics
- At list price, monthly cash flow is $294 ($4k/yr) — positive. Per door: $147/mo.
- The deal already cash-flows at list — no discount required.
- To meet the 1% rule (rent ≥ 1% of price), the offer needs to be $250k (7.0% below list).
- Recommended offer: $250k (7.0% below list) — sets the bar for 1% rule.
- Cap rate 7.6% vs local median 5.3% in Covington — top-decile yield for the area; either an underpriced asset or a hidden risk that comps aren't pricing in. Stress-test before assuming the spread holds.
Location & tenants
- Location reads 86/100 on livability (#40 in KY, #376 nationally) — a professional / high-income tenant draw. Strengths: amenities A+, commute A+, cost of living A+; Watch: employment D+.
- Covington Independent (suburban): math 10% / reading 27% proficiency, ranked #162 of 165 in KY (top 98%) — low school quality limits family demand, transient renter base, plan for 1-2y turnover; 78% free/reduced lunch — lower-income household profile, screen leases tightly.
- Zoned schools: Glenn O Swing Elementary (math 29% / reading 50%, grade F, #208 of 676 statewide, top 34%, 407 students, 78% FRL); Holmes Middle School (math 8% / reading 26%, grade F, #211 of 217 statewide, top 97%, 656 students, 84% FRL); Holmes High School (math 12% / reading 17%, grade F, #227 of 254 statewide, top 89%, 878 students, 80% FRL) — zoned schools at 81% FRL track the district average.
- Market conditions: Rents rising fast (+5.1%/yr); 60 active listings in the ZIP; 29 comparable units currently listed for rent nearby; rentals leasing fast (median 10d on market — plan ~1-2 weeks tenant-placement turnaround); 699 units permitted in Kenton County in 2024 (287 in 5+ unit buildings).
- At $2,503/mo this rent would consume 49% of the median local household income ($61k/yr) (locally 511% of renters already pay >50% of income on rent) — very limited rent-growth headroom before tenants either downsize or default.
Forward outlook
- Local home prices are declining (-3.0%/yr); year-one equity from $2k of loan paydown is wiped out by about $8k of value loss. Plan a longer hold.
- Kenton County population projected at +5% by 2050 — modest demand growth; plan on rents tracking national, not racing it.
Negotiation context
- Only 5 days on market — expect competitive offers; lowballing is unlikely to land.
- 10 sale attempts since 30y ago with the ask held roughly flat each time — persistent listings suggest the price (not the market) is what's stuck; bring a comps-based counter.
- Current owner paid $189k; 42% above their basis — modest negotiation headroom, anchor on the comps not their cost.
Risks & watch-outs
- Watch-outs: built in 1917 — expect roof / HVAC / electrical / plumbing capex.
- Climate carrying-cost: moderate flood risk; extreme-heat days projected 7→20/yr by 2055 (HVAC capex compounding) — expect insurance premiums to compound above CPI over the hold.
Questions for the listing agent
- Can we see the unit-by-unit rent roll, current vacancy, and any below-market leases? What's the average tenancy length?
- What capital expenditures (roof, boiler, parking lot, exteriors) have been made in the last 5 years, and what's planned in the next 2?
- Built in 1917 — when were the roof, HVAC, electrical panel, plumbing, and water heater last replaced?
- Is there a deadline driving the sale (1031 exchange, divorce, estate, relocation)? That informs how much negotiation room exists.
- The area grade is low — what's the realistic commute time and amenity access for the typical tenant pool here? Any planned neighborhood developments (good or bad) we should know about?
- What's the average days-on-market for RENTAL listings here right now (not sales)? A rising rental-DOM trend means longer vacancies and softer asking-rent achievability than the comps imply.
- What's the recent tenant-quality profile in this submarket — average credit score on applications, eviction rate, late-payment / NSF rate, and stable-employment percentage? A property-management company in the area should have these aggregated.
- How much new apartment / multifamily construction is in the pipeline within 1–3 miles? Heavy new supply (>2% of stock underway) typically softens rents 12–24 months out; light construction supports rent growth.
Investment metrics
- 1% rule
- 0.93% ✗
- Cap rate
- 7.60%
- Cash-on-cash
- 4.68%
- DSCR
- 1.21
- GRM
- 9.0
CMA / ARV
- ARV (on-the-fly)
- $260,834
- Comps found
- 2
Show comp detail 2 sales within ~0.75 mi
| Address | Dist | Beds/Ba | Sqft | Sold | Price | $/sf | Match |
|---|---|---|---|---|---|---|---|
| 417 W 19th St | 0.00mi | 3/2.0 | 1,202 (0%) | 7mo | $189,000 | $157 | 94 |
| 1823 Russell St | 0.20mi | 3/2.0 | 1,240 (+3%) | 19mo | $269,000 | $217 | 70 |
Match score weights: distance 35% · size 25% · config 20% · recency 20%. Top-matched comps best support the ARV.
Projected returns pro-forma
-3.0% appreciation · 5.13% rent growth · sell at horizon
- IRR
- -6.8%
- Equity multiple
- 0.74×
- Total profit
- $-19,454
- Equity at exit
- $40,109
- IRR
- 5.0%
- Equity multiple
- 1.40×
- Total profit
- $30,371
- Equity at exit
- $23,258
Cash invested: $75,320 (down + closing). Projections, not guarantees.
Landlord ↔ Tenant lean methodology
- Overall (STATE)
- 83 Strongly Landlord-Friendly
- State Kentucky
- 83 Strongly Landlord-Friendly · R+16
- County
- — inherits STATE
- City
- — inherits STATE
ZIP-level market 41014
- Rents YoY
- 5.1%
- Active inventory
- 60
- Price-to-rent
- 18.9×
Monthly cashflow live
- Estimated rent
- $2,503 high interval (Pro) →
- Mortgage (P&I)
- −$1,411
- Tax from tax record
- −$161 /mo · $1,927/yr
- Insurance
- −$112
- HOA
- −$0
- Vacancy / Maint / Mgmt
- −$526
- Net cashflow
- $294
Break-even live
Sensitivity live
| Price | -10% $446 | -5% $370 | +0% $294 | +5% $218 | +10% $142 |
|---|---|---|---|---|---|
| Rent | -10% $96 | -5% $195 | +0% $294 | +5% $393 | +10% $492 |
| Rate | -1.0pp $430 | -0.5pp $362 | base $294 | +0.5pp $224 | +1.0pp $153 |
2-unit breakdown (identical units grouped — click to expand)
| Units | Beds | Baths | Est. rent |
|---|---|---|---|
| 1× unit | 1 | 1 | $1,189 |
| 1× unit | 2 | 1 | $1,315 |
| Total (2 units) | $2,503 | ||
UW: 25.0% down · 7.5% · 30yr · 1.5% tax · 5.0% vac · 8.0% maint · 8.0% mgmt
Financing live
Cash to close
- Down payment
- $67,250
- Closing costs
- $8,070
- Reserves months
- —
- Total cash needed
- —
Loan-product check · same deal, 3 products live
Conventional
25% down · 7.5% · 30yr
- Down + closing
- —
- Monthly P&I
- —
- Monthly cashflow
- —
- DSCR
- —
- Eligible?
- —
Personal DTI + credit; lowest rate.
DSCR
20% down · 8.5% · 30yr
- Down + closing
- —
- Monthly P&I
- —
- Monthly cashflow
- —
- DSCR
- —
- Eligible?
- —
No personal income docs; deal must DSCR.
Hard money
10% down · 12.0% · 12mo
- Down + closing
- —
- Monthly P&I
- —
- Monthly cashflow
- —
- DSCR
- —
- Eligible?
- —
Short-term bridge; refi at stabilization.
Rent comps 29 comps
| Address | Beds | Baths | Sqft | Rent | $/sqft | DOM | Units | Dist |
|---|---|---|---|---|---|---|---|---|
| 2307 Center St Covington, KY | 3.0 | 1.5 | 1216 | $1,950 | $1.60 | 9d | 1 | 0.30mi |
| 1551 Holman Ave Covington, KY | 3.0 | 1.0 | 1379 | $1,425 | $1.03 | 0d | 1 | 0.45mi |
| 310 E 16th St Covington, KY | 3.0 | 1.0 | 1300 | $1,295 | $1.00 | 0d | 1 | 0.78mi |
| 1209 Holman St Unit 2 Covington, KY | 1.0 | 1.0 | 980 | $1,225 | $1.25 | 0d | 1 | 0.80mi |
| 1205 Lee St Unit 2 Covington, KY | 1.0 | 1.0 | 800 | $1,500 | $1.88 | 25d | 1 | 0.80mi |
| 1215 Elberta Cir Park Hills, KY | 2.0 | 1.0 | 825 | $1,122 | $1.36 | 0d | 3 | 0.81mi |
| 512 Wallace Ave Unit 512/18 Covington, KY | 2.0 | 2.0 | 900 | $1,299 | $1.44 | 9d | 1 | 0.81mi |
| 1914 Eastern Ave Apt 3 Covington, KY | 1.0 | 1.0 | 900 | $995 | $1.11 | 16d | 1 | 0.82mi |
| 1914 Eastern Ave Apt 1 Covington, KY | 2.0 | 1.0 | 750 | $1,200 | $1.60 | 25d | 1 | 0.82mi |
| 1431 Dixie Hwy Park Hills, KY | 1.0–2.0 | 1.0–2.0 | 920 | $2,553 | $2.77 | 0d | 10 | 0.84mi |
| 1222 E Henry Clay Ave Fort Wright, KY | 3.0 | 1.5 | 1200 | $1,548 | $1.29 | 25d | 1 | 0.84mi |
| 2220 Cityscape Dr Covington, KY | 1.0–2.0 | 1.0–2.0 | 932 | $2,030 | $2.18 | 0d | 8 | 0.84mi |
| 1002 Parkvale Ct Unit 1002 3 Park Hills, KY | 1.0 | 1.0 | 750 | $925 | $1.23 | 9d | 1 | 1.05mi |
| 1002 Parkvale Ct Unit 1004 1 Park Hills, KY | 2.0 | 1.0 | 850 | $995 | $1.17 | 45d | 1 | 1.05mi |
| 1000 Parkvale Ct Park Hills, KY | 2.0 | 1.0 | 850 | $1,495 | $1.76 | 45d | 1 | 1.05mi |
| 344 E 13th St Unit 1 Covington, KY | 2.0 | 1.0 | 1000 | $1,275 | $1.27 | 25d | 1 | 1.07mi |
| 1025 Scott St Unit 2 Covington, KY | 2.0 | 2.0 | 1100 | $1,800 | $1.64 | 5d | 1 | 1.08mi |
| 119 W 33rd St Unit 1 Latonia, KY | 1.0 | 1.0 | 900 | $1,075 | $1.19 | 25d | 1 | 1.10mi |
| 701 Madison Ave Unit 705 1 Covington, KY | 1.0 | 1.0 | 775 | $995 | $1.28 | 0d | 1 | 1.26mi |
| 437 W 6th St Covington, KY | 2.0 | 1.0–2.0 | 741 | $2,799 | $3.77 | 0d | 11 | 1.35mi |
| 634 Greenup St Covington, KY | 1.0 | 1.5 | 1050 | $1,595 | $1.52 | 9d | 1 | 1.37mi |
| 515 Main St Covington, KY | 1.0–2.0 | 1.0–2.0 | 907 | $2,215 | $2.44 | 0d | 11 | 1.41mi |
| 218 W 5th St Covington, KY | 1.0 | 1.0 | 800 | $1,595 | $1.99 | 16d | 1 | 1.42mi |
| 521 Garrard St Apt 4 Covington, KY | 1.0 | 1.0 | 725 | $1,695 | $2.34 | 19d | 1 | 1.47mi |
| 521 Garrard St Apt 2 Covington, KY | 1.0 | 1.0 | 725 | $1,595 | $2.20 | 19d | 1 | 1.47mi |
| 521 Garrard St Apt 1 Covington, KY | 1.0 | 1.5 | 825 | $1,895 | $2.30 | 19d | 1 | 1.47mi |
| 521 Garrard St Apt 6 Covington, KY | 1.0 | 1.0 | 775 | $1,995 | $2.57 | 18d | 1 | 1.47mi |
| 521 Garrard St Apt 3 Covington, KY | 1.0 | 1.0 | 875 | $1,996 | $2.28 | 16d | 1 | 1.47mi |
| 508 Greenup St Unit 508-02 Covington, KY | 2.0 | 1.0 | 1220 | $1,800 | $1.48 | 4d | 1 | 1.49mi |
Listing history 4 events
-
2026-06-21days on market $269,000 Active 5 DOM
-
2026-06-18days on market $269,000 Active 2 DOM
-
2026-06-17remarks 181-char remark
-
2026-06-17$269,000 Active 1 DOM
ⓘ Source: listings_history table (triggers on properties + properties_extension) + one-shot
backfill from property_details.listing_events for pre-trigger history.
Tax reassessment forecast KY · Resets to sale price
- Current annual tax
- $1,927 · $161/mo
- Projected year-2 tax
- $2,313 · $193/mo
- Expected delta
- +$387/yr (+$32/mo · 20.1%)
ⓘ Screening estimate from a state-policy table — verify with the county assessor before closing.
Climate risk First Street
- Flood 5/10 Major FEMA zone X (unshaded) · 24% chance over 30 yrs
- Wildfire 1/10 Low
- Heat 5/10 Major 7 d/yr ≥102°F today · 20 d/yr by 30 yrs out
- Wind 2/10 Low 100% chance of damaging wind over 30 yrs
- Air quality 3/10 Moderate 2 unhealthy d/yr today · 3 by 30 yrs out
Nearby sold comps map
Loading sold comps map…
Walkable amenities ~0.75 mi
Loading nearby amenities…
Taxation est. · year 1
- Rental income
- $30,036
- − Mortgage interest
- −$15,068
- − Property taxes
- −$1,927
- − Insurance
- −$1,345
- − Repairs & maintenance
- −$2,403
- − Management
- −$2,403
- − Depreciation
- −$7,825
- Taxable loss
- −$935
- Est. tax savings @ 24.0%
- +$224
- After-tax cash flow
- $3,753/yr
For passive investors: Depreciation is non-cash, so a rental often shows a tax loss while cash-flowing — sheltering income. Rental losses are passive: they offset passive income freely, and up to $25,000/yr can offset ordinary (W-2) income if you actively participate and your MAGI is under $100k (phasing out to $0 by $150k); unused losses carry forward. On sale, claimed depreciation is recaptured at up to 25%, and gains may owe capital-gains tax (a 1031 exchange can defer both). Figures are a year-1 estimate at your 24.0% rate — not tax advice; consult a CPA.
Schools (NCES district)
- District
- Covington Independent
- NCES district ID
- 2101350
- Math proficiency
- 10% ▼ -20.00%
- Reading proficiency
- 27% ▼ -14.00%
- Median HH income
- $33,681
- Composite
- 15.04/100
- National rank
- #9353
- State rank
- #162 of 165 in KY
Livability — Covington
- Score
- 86/100
- State rank
- #40
- US rank
- #376
Category grades
Schools grade is shown separately in the Schools card above.
Census & demographics
- Census place
- Covington, KY
- County
- Kenton County · 142,881 people
- City population
- 34,373
- Metro
- Cincinnati, OH-KY-IN
- Population (ZIP)
- 7,392
- Household income
- $61,382
- Rent vs Own
- Severe rent burden
- 511.0
Population outlook (Kenton County) Hauer SSP2
- Today (2025)
- 174,205 people
- By 2030
- 177,897 · +2.1%
- By 2040
- 182,671 · +4.9%
- By 2050
- 183,543 · +5.4%
- By 2075
- 178,977 · +2.7%
- By 2100
- 159,920 · -8.2%
Race, ethnicity, and origin ACS 2023
- Neighborhood character
- Predominantly White (71%)
- Race & ethnicity
- White 71% Two or more races 11% Hispanic / Latino 10% Black 8% Asian 2%
- Hispanic origin (detail)
- Mexican 1%
- Common ancestry
- Romanian 2% Lithuanian 1% Italian 1%
- Foreign-born
- 6% · Canada, China
- Languages at home
- 91% English-only · Spanish 8%
Political lean MEDSL · Kenton
- 2024 margin
- Strong R (+21.7) · D 38.2% · R 59.9% · Other 1.9%
- 2008→2024 swing
- -0.9pp no change · 2008: -20.9pp · 2024: -21.7pp
- All cycles
- 2024: R+21.7 2020: R+19.3 2016: R+26.1 2012: R+24.3 2008: R+20.9
Not yet ingested
- Civics
- —
Market trends
- HPI YoY
- ▼ -172.77%
- Current HPI
- 233.8216
- Rent YoY
- ▲ 5.13%
- Metro
- Cincinnati, OH-KY-IN
- State GDP YoY
- ▲ 1.81%
- F500 in state
- 4
Industry mix (Fortune 500 HQ in KY)
| Industry | F500 HQs | Revenue |
|---|---|---|
| Healthcare | 1 | $118B |
|
||
| Food / Beverage | 1 | $7B |
|
||
Price history
+668.6% since first listed29 events — show timeline
- 2026-06-16 Listed $269,000 NKMLS
- 2025-11-26 Sold (Public Records) $189,000 Public Records
- 2025-11-25 Sold (MLS) $189,000 NKMLS
- 2025-09-11 Pending — NKMLS
- 2025-09-08 Listed $189,900 NKMLS
- 2025-08-05 Listing Removed — NKMLS
- 2025-07-23 Listing Removed — NKMLS
- 2025-07-23 Listed $189,900 NKMLS
- 2025-05-15 Listed $199,000 NKMLS
- 2025-04-30 Pending — NKMLS
- 2025-04-30 Listing Removed — NKMLS
- 2025-04-22 Listed $209,900 NKMLS
- 2021-05-17 Sold (MLS) $143,000 NKMLS
- 2021-04-07 Pending — NKMLS
- 2021-03-22 Listed $150,000 NKMLS
- 2019-08-05 Sold (Public Records) $127,500 Public Records
- 2019-07-30 Sold (MLS) $127,500 NKMLS
- 2019-05-29 Listed $135,000 NKMLS
- 2018-12-03 Sold (MLS) $114,500 NKMLS
- 2018-10-03 Listed $119,900 NKMLS
- 2006-03-07 Sold (Public Records) $366,000 Public Records
- 2005-02-08 Sold (Public Records) $55,000 Public Records
- 2005-02-07 Sold (MLS) $55,000 NKMLS
- 2004-08-09 Listed $70,000 NKMLS
- 1996-10-07 Sold (Public Records) $30,000 Public Records
- 1996-10-01 Sold (MLS) $30,000 NKMLS
- 1996-03-29 Listed $30,000 NKMLS
- 1993-08-30 Sold (Public Records) $37,000 Public Records
- 1990-02-05 Sold (Public Records) $35,000 Public Records
Property tax history
+6.1%/yrLatest (2025): $1,927 · +0.7% YoY. Source: county tax records.
Cash-flow waterfall
monthlySold comps — $/sqft
last 12 mo · ≤1 miLoading sold comps…