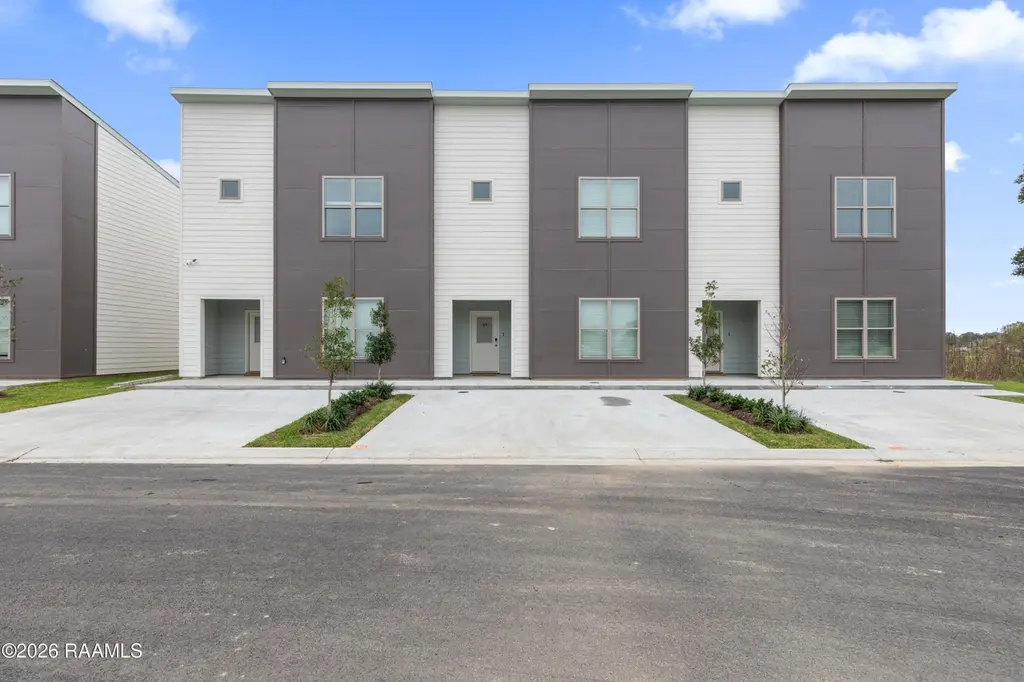
203 Firethorn Dr · Youngsville, LA
Flood risk No data
- FEMA flood zone
- —
- Chance of flooding over 30 yrs
- —
- Est. flood insurance / yr
- —
Fire risk No data
- Est. fire insurance / yr
- —
Heat risk No data
- Hot days now (above threshold)
- —
- Hot days in 30 yrs
- —
Wind risk No data
- Chance of severe wind over 30 yrs
- —
Air-quality risk No data
- Unhealthy air days now
- —
- Unhealthy air days in 30 yrs
- —
Risk factors via First Street. Map © Google.
Why this score? — see what drove the D grade
The composite is a weighted blend of 9 inputs, each scored 0–100. Each bar is that input's sub-score; the figure is the points it added to the 100-point composite (weight × sub-score).
- ARV discount +14.4/15.0
- Cash flow +7.7/30.0
- Condition / age +5.0/5.0
- Livability +3.9/5.0
- Schools +3.6/10.0
- Rent growth +2.9/5.0
- 1% rule +2.8/10.0
- DSCR +1.8/10.0
- Appreciation +0.0/10.0
$239,900
🖨 Deal sheet (PDF) 📄 Offer letter ✓ Due diligence
Listing remarks MLS
Discover Your Dream Home!Welcome to this beautifully furnished 2-bedroom, 2.5-bathroom residence, perfectly situated in a prime location. This home offers everything you need for comfortable living, all within easy reach.Key Features: Convenience at Your Doorstep: Enjoy proximity to shopping centers, restaurants, pharmacies, and urgent care facilities, ensuring all your daily needs are met. Educational Opportunities: Located near reputable schools, making it an ideal choice for families. Entertainment Galore: Explore a variety of entertainment options, including a nearby sports complex and attractions that cater to all ages. Festive Spirit: Experience the vibrant atmosphere of Mardi Gras, celebrated just around the corner, adding an extra layer of excitement to your community.Experience the best of both comfort and convenience in one place! Don't miss out on this fantastic opportunity.
Key facts
- Prime location
- Parking
- Built 2024
Tags
Neighborhood map
What this means for you Summary
Snapshot
- This is a 2-bed/2.5-bath single-family listed at $240k. Condition is rated excellent.
Deal economics
- At list price, monthly cash flow is $-281 ($-3k/yr) — negative.
- To cash-flow at today's rent, offer at most $199k (16.9% below list).
- To meet the 1% rule (rent ≥ 1% of price), the offer needs to be $187k (22.1% below list).
- Recommended offer: $187k (22.1% below list) — sets the bar for 1% rule.
Location & tenants
- Location reads 78/100 on livability (#8 in LA, #2,614 nationally) — a middle-class / working-renter tenant base. Strengths: employment A+, housing A+, health & safety A+; Watch: amenities F, commute F.
- Lafayette Parish (urban): math 38% / reading 46% proficiency, ranked #19 of 98 in LA (top 19%) — families likely to look elsewhere, expect single-tenant / working-renter base with shorter leases.
- Zoned schools: J. Wallace James Elementary School (math 46% / reading 49%, grade D, #147 of 646 statewide, top 23%, 939 students, 64% FRL); Youngsville Middle School (math 42% / reading 52%, grade D+, #37 of 218 statewide, top 18%, 646 students, 49% FRL); O. Comeaux High School (math 38% / reading 40%, grade F, #86 of 265 statewide, top 33%, 1,098 students, 56% FRL) — zoned schools at 56% FRL track the district average.
- Market conditions: Rents rising (+1.6%/yr); 684 active listings in the ZIP; 15 comparable units currently listed for rent nearby; rentals at typical pace (median 23d on market — plan ~3-4 weeks tenant-placement turnaround); 47% of comp listings sitting > 30 days — soft ceiling on asking rent; solid renter incomes; 1,585 units permitted in Lafayette Parish in 2024 (10 in 5+ unit buildings).
Forward outlook
- Local home prices are declining (-3.0%/yr); year-one equity from $2k of loan paydown is wiped out by about $7k of value loss. Plan a longer hold.
- Lafayette County population projected at +34% by 2050 — long-run rental-demand tailwind backs the buy-and-hold thesis.
Negotiation context
- It's been on market 76 days — a 6% lower offer ($226k) is reasonable based on typical stale-listing flexibility.
Questions for the listing agent
- What do current leases actually rent for vs. the listed asking? Can we see a recent rent roll and the last 12 months of T-12 income?
- It's been on market 76 days. Have you received any prior offers? Is the seller open to a 22% concession, seller financing, or rate buy-down credit?
- What does the HOA fee cover, when was the last increase, and are there any pending special assessments or reserve-fund shortfalls?
- Why hasn't it sold? Are there any deal-killer items the seller is aware of (foundation, flood, title, zoning, code violations)?
- Is there a deadline driving the sale (1031 exchange, divorce, estate, relocation)? That informs how much negotiation room exists.
- Schools are A-rated — typically a magnet for longer-tenancy family renters. What's the average tenant stay here, and is there a school-zone premium baked into asking?
- The area grade is low — what's the realistic commute time and amenity access for the typical tenant pool here? Any planned neighborhood developments (good or bad) we should know about?
- What's the average days-on-market for RENTAL listings here right now (not sales)? A rising rental-DOM trend means longer vacancies and softer asking-rent achievability than the comps imply.
- What's the recent tenant-quality profile in this submarket — average credit score on applications, eviction rate, late-payment / NSF rate, and stable-employment percentage? A property-management company in the area should have these aggregated.
- How much new for-sale + rental construction is in the pipeline within 1–3 miles? Heavy new supply typically softens prices + rents 12–24 months out; constrained supply supports both.
Investment metrics
- 1% rule
- 0.78% ✗
- Cap rate
- 4.89%
- Cash-on-cash
- -5.02%
- DSCR
- 0.78
- GRM
- 10.7
CMA / ARV
- ARV (median comp)
- $282,990
- List price
- $239,900
- Delta
- -15.23%
- Verdict
- UNDERPRICED
- Comps
- 20 within 1.0 mi
Show comp detail 12 sales within ~0.75 mi
| Address | Dist | Beds/Ba | Sqft | Sold | Price | $/sf | Match |
|---|---|---|---|---|---|---|---|
| 118 Canvasback Dr | 0.04mi | 2/2.5 | 1,305 (-2%) | 1mo | $240,000 | $184 | 95 |
| 106 Gadwall Dr | 0.05mi | 2/2.5 | 1,308 (-1%) | 9mo | $220,000 | $168 | 88 |
| 122 Stonehurst Dr | 0.26mi | 2/2.0 | 1,268 (-4%) | 1mo | $272,000 | $215 | 78 |
| 207 Palfrey Pkwy | 0.56mi | 2/2.0 | 1,319 (-0%) | 8mo | $300,000 | $227 | 64 |
| 108 Laurel Grove Blvd | 0.52mi | 3/2.0 (+1) | 1,397 (+5%) | 9mo | $222,000 | $159 | 52 |
| 135 Windermere Cir | 0.64mi | 3/2.0 (+1) | 1,424 (+7%) | 2mo | $233,000 | $164 | 50 |
| 121 Pettigrove Dr | 0.61mi | 3/2.0 (+1) | 1,429 (+8%) | 7mo | $232,000 | $162 | 46 |
| 116 Laurel Grove Blvd | 0.53mi | 3/2.0 (+1) | 1,485 (+12%) | 4mo | $239,000 | $161 | 45 |
| 202 Parker Ln | 0.64mi | 3/2.0 (+1) | 1,466 (+11%) | 4mo | $245,000 | $167 | 42 |
| 110 Long Cay Dr | 0.61mi | 3/2.0 (+1) | 1,499 (+13%) | 8mo | $280,000 | $187 | 36 |
| 502 Oceans Blvd | 0.75mi | 3/2.0 (+1) | 1,470 (+11%) | 6mo | $387,960 | $264 | 35 |
| 204 E Weeks Dr | 0.71mi | 3/2.0 (+1) | 1,524 (+15%) | 6mo | $217,500 | $143 | 30 |
Match score weights: distance 35% · size 25% · config 20% · recency 20%. Top-matched comps best support the ARV.
Projected returns pro-forma
-3.0% appreciation · 1.65% rent growth · sell at horizon
- IRR
- -26.4%
- Equity multiple
- 0.12×
- Total profit
- $-59,174
- Equity at exit
- $35,770
- IRR
- -28.9%
- Equity multiple
- -0.25×
- Total profit
- $-84,199
- Equity at exit
- $20,742
Cash invested: $67,172 (down + closing). Projections, not guarantees.
Landlord ↔ Tenant lean methodology
- Overall (STATE)
- 90 Strongly Landlord-Friendly
- State Louisiana
- 90 Strongly Landlord-Friendly · R+12
- County
- — inherits STATE
- City
- — inherits STATE
ZIP-level market 70592
- Home prices YoY
- -23.4%
- Rents YoY
- 1.6%
- Active inventory
- 684
- Price-to-rent
- 10.7×
Monthly cashflow live
- Estimated rent
- $1,870 high interval (Pro) →
- Mortgage (P&I)
- −$1,258
- Tax est. 1.5%
- −$300 /mo · $3,598/yr
- Insurance
- −$100
- HOA
- −$100
- Vacancy / Maint / Mgmt
- −$393
- Net cashflow
- $-281
Break-even live
Sensitivity live
| Price | -10% $-115 | -5% $-198 | +0% $-281 | +5% $-364 | +10% $-447 |
|---|---|---|---|---|---|
| Rent | -10% $-428 | -5% $-355 | +0% $-281 | +5% $-207 | +10% $-133 |
| Rate | -1.0pp $-160 | -0.5pp $-220 | base $-281 | +0.5pp $-343 | +1.0pp $-406 |
UW: 25.0% down · 7.5% · 30yr · 1.5% tax · 5.0% vac · 8.0% maint · 8.0% mgmt
Financing live
Cash to close
- Down payment
- $59,975
- Closing costs
- $7,197
- Reserves months
- —
- Total cash needed
- —
Loan-product check · same deal, 3 products live
Conventional
25% down · 7.5% · 30yr
- Down + closing
- —
- Monthly P&I
- —
- Monthly cashflow
- —
- DSCR
- —
- Eligible?
- —
Personal DTI + credit; lowest rate.
DSCR
20% down · 8.5% · 30yr
- Down + closing
- —
- Monthly P&I
- —
- Monthly cashflow
- —
- DSCR
- —
- Eligible?
- —
No personal income docs; deal must DSCR.
Hard money
10% down · 12.0% · 12mo
- Down + closing
- —
- Monthly P&I
- —
- Monthly cashflow
- —
- DSCR
- —
- Eligible?
- —
Short-term bridge; refi at stabilization.
Rent comps 15 comps
| Address | Beds | Baths | Sqft | Rent | $/sqft | DOM | Units | Dist |
|---|---|---|---|---|---|---|---|---|
| 105 Firethorn Dr Youngsville, LA | 2.0 | 2.5 | 1453 | $1,695 | $1.17 | 23d | 1 | 0.03mi |
| 119 Gadwall Dr Youngsville, LA | 2.0 | 2.5 | 1453 | $1,795 | $1.24 | 45d | 1 | 0.05mi |
| 510 Annaberg Dr Youngsville, LA | 3.0 | 2.0 | 1825 | $2,550 | $1.40 | 45d | 1 | 0.22mi |
| 117 Harvey Cay Ln Youngsville, LA | 3.0 | 2.0 | 1499 | $1,950 | $1.30 | 45d | 1 | 0.51mi |
| 1931 Chemin Metairie Pkwy Youngsville, LA | 1.0–3.0 | 1.0–2.0 | 1132 | $1,599 | $1.41 | 15d | 69 | 0.52mi |
| 115 Gaunt Ln Unit 204 Youngsville, LA | 2.0 | 2.5 | 1575 | $2,095 | $1.33 | 15d | 1 | 0.57mi |
| 130 Windermere Cir Youngsville, LA | 3.0 | 2.0 | 1493 | $4,500 | $3.01 | 45d | 1 | 0.63mi |
| 201 Prescott Blvd Youngsville, LA | 1.0–2.0 | 1.0–2.0 | 829 | $1,956 | $2.36 | 15d | 14 | 0.67mi |
| 805 Broyles St Unit 102 Youngsville, LA | 3.0 | 2.5 | 1600 | $2,495 | $1.56 | 45d | 1 | 0.74mi |
| 200 Crick Point WAY Youngsville, LA | 2.0–3.0 | 2.0 | 1134 | $1,815 | $1.60 | 15d | 6 | 0.75mi |
| 136 Kirkwood Ln Youngsville, LA | 3.0 | 2.0 | 1600 | $1,500 | $0.94 | 15d | 1 | 0.88mi |
| 118 Village Green Dr Youngsville, LA | 3.0 | 2.0 | 1410 | $1,800 | $1.28 | 15d | 1 | 0.93mi |
| 407 Copper Ridge Dr Youngsville, LA | 3.0 | 2.0 | 1564 | $2,100 | $1.34 | 45d | 1 | 0.93mi |
| 127 Santa Marta Dr Youngsville, LA | 3.0 | 2.0 | 1305 | $1,800 | $1.38 | 23d | 1 | 1.13mi |
| 110 Fourth St Youngsville, LA | 3.0 | 2.5 | 1700 | $1,800 | $1.06 | 45d | 1 | 1.46mi |
HOA detail
- Monthly dues
- $100 · $1,200/yr
Listing history 18 events
-
2026-06-21days on market $239,900 Active 76 DOM
-
2026-06-18days on market $239,900 Active 73 DOM
-
2026-06-17days on market $239,900 Active 72 DOM
-
2026-06-16days on market $239,900 Active 71 DOM
-
2026-06-15days on market $239,900 Active 70 DOM
-
2026-06-14days on market $239,900 Active 68 DOM
-
2026-06-13days on market $239,900 Active 67 DOM
-
2026-06-10days on market $239,900 Active 65 DOM
-
2026-06-09days on market $239,900 Active 64 DOM
-
2026-06-08days on market $239,900 Active 63 DOM
-
2026-06-07days on market $239,900 Active 62 DOM
-
2026-06-05days on market $239,900 Active 59 DOM
-
2026-06-03days on market $239,900 Active 58 DOM
-
2026-06-02days on market $239,900 Active 57 DOM
-
2026-06-01days on market $239,900 Active 56 DOM
-
2026-05-31days on market $239,900 Active 55 DOM
-
2026-05-30days on market $239,900 Active 54 DOM
-
2026-04-06$239,900 Active 898-char remark
Show marketing remark (898 chars)
Discover Your Dream Home!Welcome to this beautifully furnished 2-bedroom, 2.5-bathroom residence, perfectly situated in a prime location. This home offers everything you need for comfortable living, all within easy reach.Key Features: Convenience at Your Doorstep: Enjoy proximity to shopping centers, restaurants, pharmacies, and urgent care facilities, ensuring all your daily needs are met. Educational Opportunities: Located near reputable schools, making it an ideal choice for families. Entertainment Galore: Explore a variety of entertainment options, including a nearby sports complex and attractions that cater to all ages. Festive Spirit: Experience the vibrant atmosphere of Mardi Gras, celebrated just around the corner, adding an extra layer of excitement to your community.Experience the best of both comfort and convenience in one place! Don't miss out on this fantastic opportunity.
ⓘ Source: listings_history table (triggers on properties + properties_extension) + one-shot
backfill from property_details.listing_events for pre-trigger history.
Nearby sold comps map
Loading sold comps map…
Walkable amenities ~0.75 mi
Loading nearby amenities…
Taxation est. · year 1
- Rental income
- $22,437
- − Mortgage interest
- −$13,438
- − Property taxes
- −$3,598
- − Insurance
- −$1,200
- − Repairs & maintenance
- −$1,795
- − Management
- −$1,795
- − HOA
- −$1,200
- − Depreciation
- −$6,979
- Taxable loss
- −$7,568
- Est. tax savings @ 24.0%
- +$1,816
- After-tax cash flow
- $-1,553/yr
For passive investors: Depreciation is non-cash, so a rental often shows a tax loss while cash-flowing — sheltering income. Rental losses are passive: they offset passive income freely, and up to $25,000/yr can offset ordinary (W-2) income if you actively participate and your MAGI is under $100k (phasing out to $0 by $150k); unused losses carry forward. On sale, claimed depreciation is recaptured at up to 25%, and gains may owe capital-gains tax (a 1031 exchange can defer both). Figures are a year-1 estimate at your 24.0% rate — not tax advice; consult a CPA.
Condition & rehab AI · 6 photos
This beautifully maintained single-family home is in excellent condition with no visible repairs or maintenance needed. It offers a prime location and is ready for immediate occupancy.
Value-add opportunities
- Both Painting the exterior — Fresh paint can enhance curb appeal and property value.
- Both Landscaping improvements — Enhanced landscaping can improve curb appeal and attract more potential buyers/tenants.
- Both Interior touch-ups — Fresh paint and minor touch-ups can improve the home's appearance and attract more potential buyers/tenants.
Renovation cost estimate screening
Value-add ROI direction
- Both Painting the exterior — Fresh paint can enhance curb appeal and property value. ↑
- Both Landscaping improvements — Enhanced landscaping can improve curb appeal and attract more potential buyers/tenants. ↑
- Both Interior touch-ups — Fresh paint and minor touch-ups can improve the home's appearance and attract more potential buyers/tenants. ↑
ⓘ Cost ranges are severity-bucket heuristics (US national rule-of-thumb). Get contractor quotes + a written scope before underwriting a rehab budget.
Schools (NCES district)
- District
- Lafayette Parish
- NCES district ID
- 2200870
- Math proficiency
- 38% ▼ -32.00%
- Reading proficiency
- 46% ▼ -24.00%
- Median HH income
- $50,238
- Composite
- 36.15/100
- National rank
- #4741
- State rank
- #19 of 98 in LA
Livability — Youngsville
- Score
- 78/100
- State rank
- #8
- US rank
- #2614
Category grades
Schools grade is shown separately in the Schools card above.
Census & demographics
- Census place
- Youngsville, LA
- County
- Lafayette Parish · 207,544 people
- City population
- 32,167
- Metro
- Lafayette, LA
- Population (ZIP)
- 32,167
- Household income
- $93,204
- Rent vs Own
- Severe rent burden
- 424.0
Population outlook (Lafayette County) Hauer SSP2
- Today (2025)
- 280,930 people
- By 2030
- 301,092 · +7.2%
- By 2040
- 339,456 · +20.8%
- By 2050
- 375,156 · +33.5%
- By 2075
- 451,672 · +60.8%
- By 2100
- 497,203 · +77.0%
Race, ethnicity, and origin ACS 2023
- Neighborhood character
- Predominantly White (82%)
- Race & ethnicity
- White 82% Black 10% Two or more races 5% Hispanic / Latino 4% Asian 1%
- Common ancestry
- Lithuanian 24% Romanian 3% Italian 1%
- Foreign-born
- 3% · Canada
- Languages at home
- 94% English-only · French/Haitian/Cajun 3% Spanish 2%
Political lean MEDSL · Lafayette
- 2024 margin
- Solid R (+31.4) · D 33.5% · R 64.8% · Other 1.7%
- 2008→2024 swing
- -0.1pp no change · 2008: -31.3pp · 2024: -31.4pp
- All cycles
- 2024: R+31.4 2020: R+28.7 2016: R+33.6 2012: R+33.7 2008: R+31.3
Not yet ingested
- Civics
- —
Market trends
- HPI YoY
- ▼ -41.24%
- Current HPI
- 135.2825
- Rent YoY
- ▲ 1.65%
- Metro
- Lafayette, LA
- State GDP YoY
- ▲ 3.29%
- F500 in state
- 10
Industry mix (Fortune 500 HQ in LA)
| Industry | F500 HQs | Revenue |
|---|---|---|
| Telecommunications | 2 | $23B |
|
||
| Utilities | 1 | $12B |
|
||
| Wholesale / Distribution | 1 | $5B |
|
||
| Advertising | 1 | $2B |
|
||
Price history
1 event — show timeline
- 2026-04-06 Listed $239,900 AcadianaMLS
Cash-flow waterfall
monthlySold comps — $/sqft
last 12 mo · ≤1 miLoading sold comps…