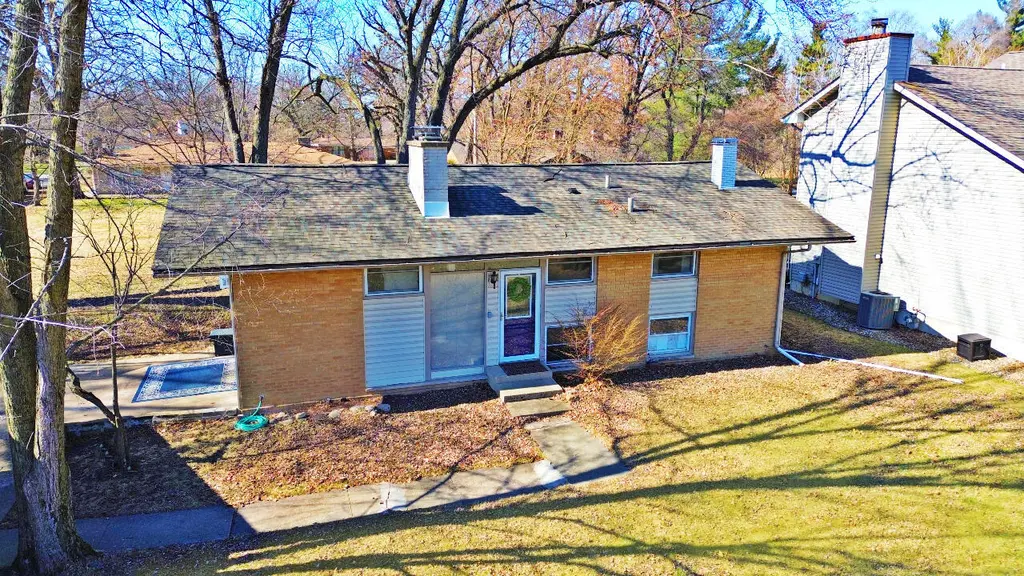
6318 Garfield St · Merrillville, IN
Flood risk 1/10 · Minimal
- FEMA flood zone
- X (unshaded)
- Chance of flooding over 30 yrs
- 0.0%
- Est. flood insurance / yr
- $507 – $1,088
Fire risk 1/10 · Minimal
- Est. fire insurance / yr
- $717 – $1,331
Heat risk 2/10 · Minimal
- Hot days now (above 101°F)
- 7 days/yr
- Hot days in 30 yrs
- 15 days/yr
Wind risk 2/10 · Minimal
- Chance of severe wind over 30 yrs
- 1.0%
Air-quality risk 3/10 · Minor
- Unhealthy air days now
- 2 days/yr
- Unhealthy air days in 30 yrs
- 3 days/yr
Risk factors via First Street. Map © Google.
Why this score? — see what drove the B grade
The composite is a weighted blend of 9 inputs, each scored 0–100. Each bar is that input's sub-score; the figure is the points it added to the 100-point composite (weight × sub-score).
- Cash flow +30.0/30.0
- ARV discount +13.0/15.0
- DSCR +10.0/10.0
- 1% rule +8.8/10.0
- Livability +3.8/5.0
- Rent growth +3.5/5.0
- Schools +2.6/10.0
- Condition / age +2.5/5.0
- Appreciation +0.0/10.0
$259,900
🖨 Deal sheet (PDF) 📄 Offer letter ✓ Due diligence
Listing remarks MLS
4 bedroom reverse bi-level home situated on almost a HALF ACRE in Brookwood Subdivision near Turkey Creek Golf Course! Enjoy the OPEN CONCEPT eat-in kitchen and living room (with FIREPLACE!) on the lower level. There is also space for a more FORMAL DINING ROOM area. Laundry is tucked away in its own room and there are also two large storage closets on this level. Large picture windows keep everything bright. The upper level features HARDWOOD FLOORING with vaulted ceilings in all the bedrooms. The large primary bedroom features DOUBLE CLOSETS and another fireplace! Bathrooms on both levels. Some newer mechanicals as well! Roof fully replaced (2018), new water heater (2016), and new sump pump (2025). The 2.5 car garage is EXTRA DEEP for additional storage. There is also a fire pit area in the back yard and a LARGE PATIO AREA and FENCED PET RUN AREA in the side yard perfect for enjoying summer days!
Key facts
- Hardwood flooring
- Formal dining room
- Fireplace
Tags
Neighborhood map
What this means for you Summary
Snapshot
- This is a 4-bed/2.0-bath single-family listed at $260k.
Deal economics
- At list price, monthly cash flow is $1k ($15k/yr) — positive.
- The deal already cash-flows at list — no discount required.
- Meets the 1% rule at list price ($4k rent vs $260k).
- Recommended offer: $237k (9.0% below list) — sets the bar for market timing.
- Cap rate 12.0% vs local median 4.7% in Merrillville — top-decile yield for the area; either an underpriced asset or a hidden risk that comps aren't pricing in. Stress-test before assuming the spread holds.
Location & tenants
- Location reads 76/100 on livability (#50 in IN, #3,393 nationally) — a middle-class / working-renter tenant base. Strengths: commute A+, cost of living A+, housing A+; Watch: amenities F, health & safety D-.
- Merrillville Community School Corporation (suburban): math 22% / reading 36% proficiency, ranked #240 of 301 in IN (top 80%) — low school quality limits family demand, transient renter base, plan for 1-2y turnover.
- Zoned schools: Henry P Fieler Elementary School (math 12% / reading 17%, grade F, #862 of 994 statewide, top 88%, 447 students, 80% FRL); Pierce Middle School (math 18% / reading 37%, grade F, #230 of 330 statewide, top 71%, 919 students, 70% FRL); Merrillville High School (math 19% / reading 55%, grade F, #247 of 369 statewide, top 70%, 2,042 students, 64% FRL) — zoned schools average 71% FRL vs 50% district-wide (22 pts higher); higher-poverty schools than district average — tighter screening recommended.
- Market conditions: Rents rising fast (+4.1%/yr); 272 active listings in the ZIP; 4 comparable units currently listed for rent nearby; rentals leasing fast (median 6d on market — plan ~1-2 weeks tenant-placement turnaround); 1,642 units permitted in Lake County in 2024 (14 in 5+ unit buildings).
- At $3,599/mo this rent would consume 67% of the median local household income ($64k/yr) (locally 1644% of renters already pay >50% of income on rent) — very limited rent-growth headroom before tenants either downsize or default.
Forward outlook
- Local home prices are declining (-3.0%/yr); year-one equity from $2k of loan paydown is wiped out by about $8k of value loss. Plan a longer hold.
- Lake County population projected to shrink 7% by 2050 — rents likely to lag national; underwrite the cash flow, not the appreciation.
- At projected returns (-3.0% appreciation + 4.1% rent growth), your $73k cash investment doubles in ~6 years — after that, you're playing with house money.
Negotiation context
- It's been on market 114 days — a 9% lower offer ($237k) is reasonable based on typical stale-listing flexibility.
- 11 sale attempts since 28y ago with the ask held roughly flat each time — persistent listings suggest the price (not the market) is what's stuck; bring a comps-based counter.
- Current owner paid $121k; list at $260k implies a 116% gain — meaningful room to come down on a strong offer.
Risks & watch-outs
- Watch-outs: built in 1956 — expect roof / HVAC / electrical / plumbing capex.
Questions for the listing agent
- It's been on market 114 days. Have you received any prior offers? Is the seller open to a 9% concession, seller financing, or rate buy-down credit?
- Built in 1956 — when were the roof, HVAC, electrical panel, plumbing, and water heater last replaced?
- Why hasn't it sold? Are there any deal-killer items the seller is aware of (foundation, flood, title, zoning, code violations)?
- Is there a deadline driving the sale (1031 exchange, divorce, estate, relocation)? That informs how much negotiation room exists.
- Schools are D-rated, which usually means shorter tenancies and higher turnover. Who's the typical renter profile here, and what's been the actual vacancy rate?
- What's the average days-on-market for RENTAL listings here right now (not sales)? A rising rental-DOM trend means longer vacancies and softer asking-rent achievability than the comps imply.
- What's the recent tenant-quality profile in this submarket — average credit score on applications, eviction rate, late-payment / NSF rate, and stable-employment percentage? A property-management company in the area should have these aggregated.
- How much new for-sale + rental construction is in the pipeline within 1–3 miles? Heavy new supply typically softens prices + rents 12–24 months out; constrained supply supports both.
Investment metrics
- 1% rule
- 1.38% ✓
- Cap rate
- 12.00%
- Cash-on-cash
- 20.39%
- DSCR
- 1.91
- GRM
- 6.0
CMA / ARV
- ARV (median comp)
- $296,427
- List price
- $259,900
- Delta
- -12.32%
- Verdict
- UNDERPRICED
- Comps
- 20 within 1.0 mi
Show comp detail 12 sales within ~0.75 mi
| Address | Dist | Beds/Ba | Sqft | Sold | Price | $/sf | Match |
|---|---|---|---|---|---|---|---|
| 6344 Garfield St | 0.05mi | 3/2.0 (-1) | 2,151 (+1%) | 2mo | $289,900 | $135 | 90 |
| 2257 W 60th Dr | 0.48mi | 5/2.0 (+1) | 2,210 (+4%) | 8mo | $144,000 | $65 | 60 |
| 6380 Ellsworth Pl | 0.61mi | 4/2.0 | 2,005 (-6%) | 9mo | $280,000 | $140 | 54 |
| 920 W 63rd Ave | 0.55mi | 3/1.5 (-1) | 2,250 (+6%) | 11mo | $253,000 | $112 | 49 |
| 2400 W 59th Pl | 0.65mi | 3/2.0 (-1) | 1,938 (-9%) | 3mo | $283,000 | $146 | 47 |
| 1308 W 61st Pl | 0.39mi | 4/2.0 | 1,824 (-14%) | 14mo | $250,000 | $137 | 46 |
| 1109 W 62nd Pl | 0.46mi | 3/2.0 (-1) | 1,840 (-14%) | 8mo | $250,000 | $136 | 44 |
| 2684 W 61st Ave | 0.70mi | 4/2.5 | 1,850 (-13%) | 3mo | $275,000 | $149 | 40 |
| 5955 Mckinley St | 0.47mi | 3/1.0 (-1) | 1,880 (-12%) | 12mo | $230,000 | $122 | 39 |
| 6450 Marshall St | 0.67mi | 3/2.5 (-1) | 1,920 (-10%) | 12mo | $349,900 | $182 | 35 |
| 2707 W 60th Dr | 0.75mi | 4/2.5 | 2,386 (+12%) | 10mo | $279,900 | $117 | 35 |
| 988 W 61st Ave | 0.62mi | 3/2.0 (-1) | 1,848 (-13%) | 15mo | $210,000 | $114 | 31 |
Match score weights: distance 35% · size 25% · config 20% · recency 20%. Top-matched comps best support the ARV.
Projected returns pro-forma
-3.0% appreciation · 4.1% rent growth · sell at horizon
- IRR
- 13.8%
- Equity multiple
- 1.56×
- Total profit
- $40,608
- Equity at exit
- $38,752
- IRR
- 23.4%
- Equity multiple
- 3.11×
- Total profit
- $153,420
- Equity at exit
- $22,471
Cash invested: $72,772 (down + closing). Projections, not guarantees.
Landlord ↔ Tenant lean methodology
- Overall (STATE)
- 90 Strongly Landlord-Friendly
- State Indiana
- 90 Strongly Landlord-Friendly · R+11
- County
- — inherits STATE
- City
- — inherits STATE
ZIP-level market 46410
- Rents YoY
- 4.1%
- Active inventory
- 272
- Price-to-rent
- 6.0×
Monthly cashflow live
- Estimated rent
- $3,599 medium interval (Pro) →
- Mortgage (P&I)
- −$1,363
- Tax from tax record
- −$136 /mo · $1,626/yr
- Insurance
- −$108
- HOA
- −$0
- Vacancy / Maint / Mgmt
- −$756
- Net cashflow
- $1,237
Break-even live
Sensitivity live
| Price | -10% $1,384 | -5% $1,310 | +0% $1,237 | +5% $1,163 | +10% $1,089 |
|---|---|---|---|---|---|
| Rent | -10% $952 | -5% $1,094 | +0% $1,237 | +5% $1,379 | +10% $1,521 |
| Rate | -1.0pp $1,367 | -0.5pp $1,303 | base $1,237 | +0.5pp $1,169 | +1.0pp $1,101 |
UW: 25.0% down · 7.5% · 30yr · 1.5% tax · 5.0% vac · 8.0% maint · 8.0% mgmt
Financing live
Cash to close
- Down payment
- $64,975
- Closing costs
- $7,797
- Reserves months
- —
- Total cash needed
- —
Loan-product check · same deal, 3 products live
Conventional
25% down · 7.5% · 30yr
- Down + closing
- —
- Monthly P&I
- —
- Monthly cashflow
- —
- DSCR
- —
- Eligible?
- —
Personal DTI + credit; lowest rate.
DSCR
20% down · 8.5% · 30yr
- Down + closing
- —
- Monthly P&I
- —
- Monthly cashflow
- —
- DSCR
- —
- Eligible?
- —
No personal income docs; deal must DSCR.
Hard money
10% down · 12.0% · 12mo
- Down + closing
- —
- Monthly P&I
- —
- Monthly cashflow
- —
- DSCR
- —
- Eligible?
- —
Short-term bridge; refi at stabilization.
Rent comps 4 comps
| Address | Beds | Baths | Sqft | Rent | $/sqft | DOM | Units | Dist |
|---|---|---|---|---|---|---|---|---|
| 1865 W 64th Pl Merrillville, IN | 4.0 | 2.0 | 2034 | $4,900 | $2.41 | 45d | 1 | 0.18mi |
| 3023 W 63rd Ln Merrillville, IN | 4.0 | 3.0 | 2500 | $2,800 | $1.12 | 5d | 1 | 0.89mi |
| 3190 W 63rd Ln Merrillville, IN | 3.0 | 2.0 | 1667 | $2,600 | $1.56 | 5d | 1 | 0.93mi |
| 910 W 56th Ave Merrillville, IN | 4.0 | 1.5 | 1431 | $1,825 | $1.28 | 0d | 1 | 1.12mi |
Listing history 36 events
-
2026-06-21days on market $259,900 Active 114 DOM
-
2026-06-18days on market $259,900 Active 111 DOM
-
2026-06-17days on market $259,900 Active 110 DOM
-
2026-06-16days on market $259,900 Active 109 DOM
-
2026-06-15days on market $259,900 Active 108 DOM
-
2026-06-13days on market $259,900 Active 106 DOM
-
2026-06-13days on market $259,900 Active 105 DOM
-
2026-06-09days on market $259,900 Active 102 DOM
-
2026-06-08days on market $259,900 Active 101 DOM
-
2026-06-07days on market $259,900 Active 100 DOM
-
2026-06-04days on market $259,900 Active 97 DOM
-
2026-06-03days on market $259,900 Active 96 DOM
-
2026-06-02days on market $259,900 Active 95 DOM
-
2026-06-01days on market $259,900 Active 94 DOM
-
2026-05-31days on market $259,900 Active 93 DOM
-
2026-02-27$259,900 Active 909-char remark
Show marketing remark (909 chars)
4 bedroom reverse bi-level home situated on almost a HALF ACRE in Brookwood Subdivision near Turkey Creek Golf Course! Enjoy the OPEN CONCEPT eat-in kitchen and living room (with FIREPLACE!) on the lower level. There is also space for a more FORMAL DINING ROOM area. Laundry is tucked away in its own room and there are also two large storage closets on this level. Large picture windows keep everything bright. The upper level features HARDWOOD FLOORING with vaulted ceilings in all the bedrooms. The large primary bedroom features DOUBLE CLOSETS and another fireplace! Bathrooms on both levels. Some newer mechanicals as well! Roof fully replaced (2018), new water heater (2016), and new sump pump (2025). The 2.5 car garage is EXTRA DEEP for additional storage. There is also a fire pit area in the back yard and a LARGE PATIO AREA and FENCED PET RUN AREA in the side yard perfect for enjoying summer days!
-
2023-05-26historical
-
2023-04-12$249,900 Active
-
2018-04-19historical
-
2017-10-11soldstatus $120,600
-
2017-07-07$119,900
-
2017-03-20$134,900
-
2015-07-01historical
-
2014-12-15historical
-
2014-12-15historical
-
2014-12-15historical
-
2014-10-01$109,900
-
2014-05-28$119,000
-
2014-04-03$123,900
-
2013-07-31$129,900
-
2013-05-02soldstatus $43,500
-
2013-04-24soldstatus $43,500
-
2013-01-22$48,500
-
2003-04-14$115,000
-
1999-09-20historical
-
1998-07-30$108,000
ⓘ Source: listings_history table (triggers on properties + properties_extension) + one-shot
backfill from property_details.listing_events for pre-trigger history.
Tax reassessment forecast IN · Partial reset (capped growth)
- Current annual tax
- $1,626 · $136/mo
- Projected year-2 tax
- $1,918 · $160/mo
- Expected delta
- +$292/yr (+$24/mo · 17.9%)
ⓘ Screening estimate from a state-policy table — verify with the county assessor before closing.
Climate risk First Street
- Flood 1/10 Low FEMA zone X (unshaded) · 0% chance over 30 yrs
- Wildfire 1/10 Low
- Heat 2/10 Low 7 d/yr ≥101°F today · 15 d/yr by 30 yrs out
- Wind 2/10 Low 100% chance of damaging wind over 30 yrs
- Air quality 3/10 Moderate 2 unhealthy d/yr today · 3 by 30 yrs out
Nearby sold comps map
Loading sold comps map…
Walkable amenities ~0.75 mi
Loading nearby amenities…
Taxation est. · year 1
- Rental income
- $43,190
- − Mortgage interest
- −$14,558
- − Property taxes
- −$1,626
- − Insurance
- −$1,300
- − Repairs & maintenance
- −$3,455
- − Management
- −$3,455
- − Depreciation
- −$7,561
- Taxable income
- $11,234
- Est. tax owed @ 24.0%
- −$2,696
- After-tax cash flow
- $12,143/yr
For passive investors: Depreciation is non-cash, so a rental often shows a tax loss while cash-flowing — sheltering income. Rental losses are passive: they offset passive income freely, and up to $25,000/yr can offset ordinary (W-2) income if you actively participate and your MAGI is under $100k (phasing out to $0 by $150k); unused losses carry forward. On sale, claimed depreciation is recaptured at up to 25%, and gains may owe capital-gains tax (a 1031 exchange can defer both). Figures are a year-1 estimate at your 24.0% rate — not tax advice; consult a CPA.
Schools (NCES district)
- District
- Merrillville Community School Corporation
- NCES district ID
- 1809690
- Math proficiency
- 22% ▼ -17.00%
- Reading proficiency
- 36% ▼ -8.00%
- Median HH income
- $54,401
- Composite
- 25.74/100
- National rank
- #7375
- State rank
- #240 of 301 in IN
Livability — Merrillville
- Score
- 76/100
- State rank
- #50
- US rank
- #3393
Category grades
Schools grade is shown separately in the Schools card above.
Census & demographics
- Census place
- Merrillville, IN
- County
- Lake County · 422,878 people
- City population
- 39,243
- Metro
- Chicago-Naperville-Elgin, IL-IN-WI
- Population (ZIP)
- 39,243
- Household income
- $64,127
- Rent vs Own
- Severe rent burden
- 1644.0
Population outlook (Lake County) Hauer SSP2
- Today (2025)
- 484,026 people
- By 2030
- 478,091 · -1.2%
- By 2040
- 462,974 · -4.3%
- By 2050
- 449,894 · -7.1%
- By 2075
- 436,169 · -9.9%
- By 2100
- 426,607 · -11.9%
Race, ethnicity, and origin ACS 2023
- Neighborhood character
- Diverse neighborhood (Simpson 0.66)
- Race & ethnicity
- Black 46% White 32% Hispanic / Latino 16% Two or more races 9% Asian 2%
- Hispanic origin (detail)
- Mexican 11% Puerto Rican 3%
- Common ancestry
- Romanian 4% Iranian 2% Italian 1%
- Foreign-born
- 7% · Canada
- Languages at home
- 88% English-only · Spanish 7% Other Indo-European 2%
Political lean MEDSL · Lake
- 2024 margin
- Lean D (+5.6) · D 52.1% · R 46.5% · Other 1.5%
- 2008→2024 swing
- -28.6pp toward R · 2008: 34.3pp · 2024: 5.6pp
- All cycles
- 2024: D+5.6 2020: D+15.1 2016: D+20.6 2012: D+31.0 2008: D+34.3
Not yet ingested
- Civics
- —
Market trends
- HPI YoY
- ▼ -180.11%
- Current HPI
- 240.8833
- Rent YoY
- ▲ 4.10%
- Metro
- Chicago-Naperville-Elgin, IL-IN-WI
- State GDP YoY
- ▲ 2.90%
- F500 in state
- 18
Industry mix (Fortune 500 HQ in IN)
| Industry | F500 HQs | Revenue |
|---|---|---|
| Industrial Machinery | 2 | $37B |
|
||
| Healthcare | 1 | $177B |
|
||
| Pharmaceuticals | 1 | $45B |
|
||
| Metals / Steel | 1 | $18B |
|
||
| Agriculture | 1 | $17B |
|
||
| Packaging | 1 | $12B |
|
||
Price history
+140.6% since first listed21 events — show timeline
- 2026-02-27 Listed $259,900 NIRA MLS as Distributed by MLS Grid
- 2023-05-26 Listing Removed — NIRA MLS as Distributed by MLS Grid
- 2023-04-12 Listed $249,900 NIRA MLS as Distributed by MLS Grid
- 2018-04-19 Listing Removed — NIRA MLS as Distributed by MLS Grid
- 2017-10-11 Sold (MLS) $120,600 NIRA MLS as Distributed by MLS Grid
- 2017-07-07 Listed $119,900 NIRA MLS as Distributed by MLS Grid
- 2017-03-20 Listed $134,900 NIRA MLS as Distributed by MLS Grid
- 2015-07-01 Listing Removed — NIRA MLS as Distributed by MLS Grid
- 2014-12-15 Listing Removed — NIRA MLS as Distributed by MLS Grid
- 2014-12-15 Listing Removed — NIRA MLS as Distributed by MLS Grid
- 2014-12-15 Listing Removed — NIRA MLS as Distributed by MLS Grid
- 2014-10-01 Listed $109,900 NIRA MLS as Distributed by MLS Grid
- 2014-05-28 Listed $119,000 NIRA MLS as Distributed by MLS Grid
- 2014-04-03 Listed $123,900 NIRA MLS as Distributed by MLS Grid
- 2013-07-31 Listed $129,900 NIRA MLS as Distributed by MLS Grid
- 2013-05-02 Sold (Public Records) $43,500 Public Records
- 2013-04-24 Sold (MLS) $43,500 NIRA MLS as Distributed by MLS Grid
- 2013-01-22 Listed $48,500 NIRA MLS as Distributed by MLS Grid
- 2003-04-14 Listed $115,000 NIRA MLS as Distributed by MLS Grid
- 1999-09-20 Listing Removed — NIRA MLS as Distributed by MLS Grid
- 1998-07-30 Listed $108,000 NIRA MLS as Distributed by MLS Grid
Property tax history
-6.4%/yrLatest (2024): $1,626 · +6.3% YoY. Source: county tax records.
Cash-flow waterfall
monthlySold comps — $/sqft
last 12 mo · ≤1 miLoading sold comps…