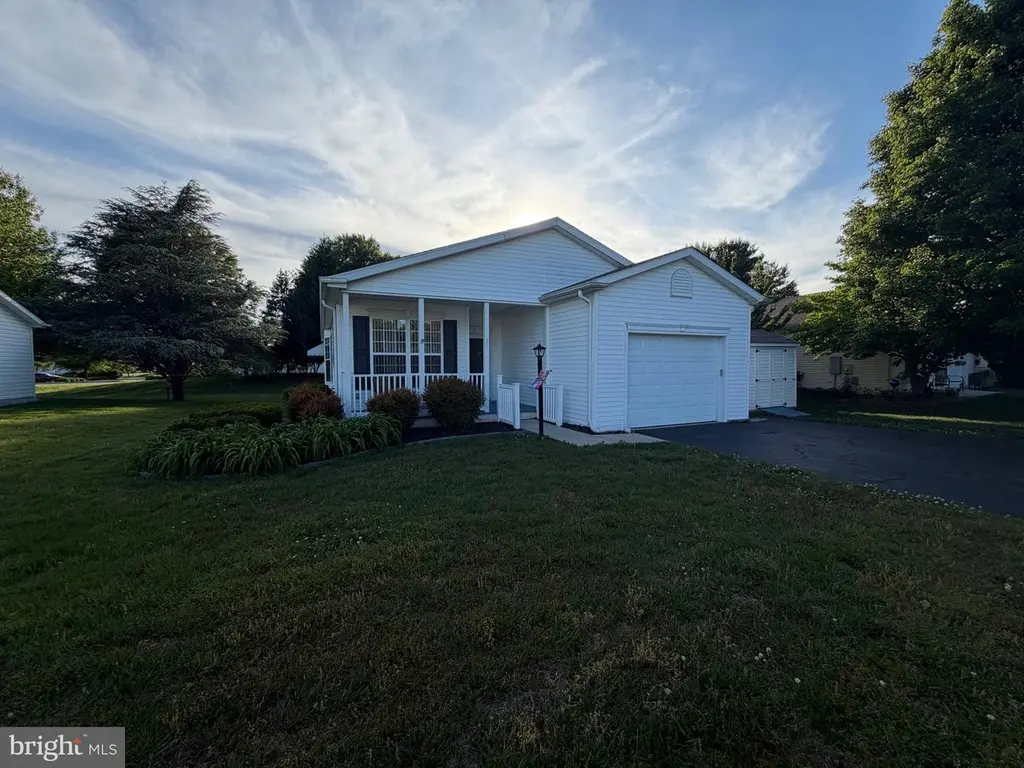
21 Whitby Ln #195 · Camden, DE
Flood risk 1/10 · Minimal
- FEMA flood zone
- X (unshaded)
- Chance of flooding over 30 yrs
- 0.0%
- Est. flood insurance / yr
- $507 – $1,088
Fire risk 1/10 · Minimal
- Est. fire insurance / yr
- $476 – $884
Heat risk 8/10 · Major
- Hot days now (above 102°F)
- 7 days/yr
- Hot days in 30 yrs
- 17 days/yr
Wind risk 6/10 · Moderate
- Chance of severe wind over 30 yrs
- 77.0%
Air-quality risk 2/10 · Minimal
- Unhealthy air days now
- 1 days/yr
- Unhealthy air days in 30 yrs
- 2 days/yr
Risk factors via First Street. Map © Google.
Why this score? — see what drove the C+ grade
The composite is a weighted blend of 9 inputs, each scored 0–100. Each bar is that input's sub-score; the figure is the points it added to the 100-point composite (weight × sub-score).
- Cash flow +25.7/30.0
- ARV discount +9.8/15.0
- DSCR +8.5/10.0
- 1% rule +6.8/10.0
- Schools +3.3/10.0
- Livability +3.2/5.0
- Condition / age +2.8/5.0
- Rent growth +2.5/5.0
- Appreciation +0.0/10.0
$169,500
🖨 Deal sheet 📄 Offer letter ✓ Due diligence
Listing remarks
Great 2-bedroom 2 bath house located in the highly desirable community of Barclay Farms. This house has a great front porch and rear sunroom and is within walking distance of the clubhouse. Roof and AC have been replaced in the last 5 years. Call to schedule your showing today.
Key facts
- Rear sunroom
- Replaced ac
- Front porch
Tags
Property features AI
Finance
- Other: Pets allowed with no restrictions
- HOA & community: HOA fee $15 annually; Land lease $628.21 monthly (approximately 10 years remaining)
Exterior
- Parking: Attached front-entry garage (1 space); Driveway parking
- Utilities: Public water; Private sewer
- Home design: Manufactured home; Vinyl siding; Senior community (55+); Land lease ownership
- Construction: Vinyl siding construction; Above-grade and below-grade structures noted
- Exterior features: Community pool; Lot dimensions per assessor
Interior
- Bedrooms: Two bedrooms on the main level
- Bathrooms: Two full bathrooms (both on the main level)
- Heating & cooling: 90% forced air heating (natural gas); Central air conditioning (natural gas for cooling fuel); Electric hot water
- Interior features: No basement; Living area per assessor
Neighborhood map
What this means for you Summary
Snapshot
- This is a 2-bed/2.0-bath single-family listed at $170k. Condition is rated average.
Deal economics
- At list price, monthly cash flow is $404 ($5k/yr) — positive.
- The deal already cash-flows at list — no discount required.
- Meets the 1% rule at list price ($2k rent vs $170k).
- Recommended offer: $164k (3.0% below list) — sets the bar for market timing.
- Cap rate 9.2% vs local median 3.5% in Camden — top-decile yield for the area; either an underpriced asset or a hidden risk that comps aren't pricing in. Stress-test before assuming the spread holds.
Location & tenants
- Location reads 64/100 on livability (#47 in DE) — a middle-class / working-renter tenant base. Strengths: housing A+, employment A, cost of living A-; Watch: crime F, amenities F, commute F.
- Caesar Rodney School District (suburban): math 26% / reading 49% proficiency, ranked #9 of 26 in DE (top 35%) — families likely to look elsewhere, expect single-tenant / working-renter base with shorter leases.
- Market conditions: 94 active listings in the ZIP; 4 comparable units currently listed for rent nearby; rentals lingering (median 44d on market — plan ~5-8 weeks vacancy on turnover, expect pricing pressure); 100% of comp listings sitting > 30 days — soft ceiling on asking rent; 1,201 units permitted in Kent County in 2024 (116 in 5+ unit buildings).
Forward outlook
- Local home prices are declining (-3.0%/yr); year-one equity from $1k of loan paydown is wiped out by about $5k of value loss. Plan a longer hold.
- Kent County population projected at +22% by 2050 — long-run rental-demand tailwind backs the buy-and-hold thesis.
Negotiation context
- It's been on market 35 days — a 3% lower offer ($164k) is reasonable based on typical stale-listing flexibility.
Risks & watch-outs
- Climate carrying-cost: major wind risk, 77% chance of damaging wind over 30y; extreme-heat days projected 7→17/yr by 2055 (HVAC capex compounding) — expect insurance premiums to compound above CPI over the hold.
Questions for the listing agent
- It's been on market 35 days. Have you received any prior offers? Is the seller open to a 3% concession, seller financing, or rate buy-down credit?
- What does the HOA fee cover, when was the last increase, and are there any pending special assessments or reserve-fund shortfalls?
- Is there a deadline driving the sale (1031 exchange, divorce, estate, relocation)? That informs how much negotiation room exists.
- Crime grade is F in this area — have there been break-ins, vandalism, or insurance claims at this property in the last 3 years? What carrier currently insures it and at what premium?
- What's the average days-on-market for RENTAL listings here right now (not sales)? A rising rental-DOM trend means longer vacancies and softer asking-rent achievability than the comps imply.
- What's the recent tenant-quality profile in this submarket — average credit score on applications, eviction rate, late-payment / NSF rate, and stable-employment percentage? A property-management company in the area should have these aggregated.
- How much new for-sale + rental construction is in the pipeline within 1–3 miles? Heavy new supply typically softens prices + rents 12–24 months out; constrained supply supports both.
Investment metrics
- 1% rule
- 1.18% ✓
- Cap rate
- 9.15%
- Cash-on-cash
- 10.21%
- DSCR
- 1.45
- GRM
- 7.1
CMA / ARV
- ARV (median comp)
- $178,508
- List price
- $169,500
- Delta
- -5.05%
- Verdict
- FAIR
- Comps
- 20 within 1.0 mi
Show comp detail 12 sales within ~0.75 mi
| Address | Dist | Beds/Ba | Sqft | Sold | Price | $/sf | Match |
|---|---|---|---|---|---|---|---|
| 20 Coomb Ln | 0.12mi | 2/2.0 | 1,402 (+3%) | 8mo | $200,000 | $143 | 82 |
| 23 Wallace Ln #207 | 0.07mi | 2/2.0 | 1,340 (-1%) | 16mo | $175,000 | $131 | 82 |
| 131 S Hairgrove Ln #84 | 0.19mi | 2/2.0 | 1,412 (+4%) | 12mo | $185,000 | $131 | 74 |
| 68 Carey Ln #15 | 0.11mi | 2/2.0 | 1,524 (+12%) | 1mo | $175,000 | $115 | 73 |
| 35 N Jerman Ln #271 | 0.13mi | 2/2.0 | 1,532 (+13%) | 6mo | $192,500 | $126 | 68 |
| 120 S Ellison Ln #72 | 0.19mi | 2/2.0 | 1,533 (+13%) | 10mo | $190,000 | $124 | 61 |
| 121 S Knight Ln | 0.23mi | 2/2.0 | 1,223 (-10%) | 15mo | $140,000 | $114 | 61 |
| 33 Catts Ln #26 | 0.13mi | 2/2.0 | 1,530 (+13%) | 16mo | $149,500 | $98 | 59 |
| 132 S Jerman Ln #89 | 0.20mi | 3/2.0 (+1) | 1,507 (+11%) | 17mo | $160,000 | $106 | 54 |
| 26 Dill Ln #65 | 0.22mi | 2/2.0 | 1,167 (-14%) | 16mo | $150,000 | $129 | 53 |
| 87 Black Cherry Dr | 0.68mi | 3/2.0 (+1) | 1,515 (+12%) | 3mo | $322,000 | $213 | 42 |
| 12191 Willow Grove Rd | 0.69mi | 3/1.0 (+1) | 1,219 (-10%) | 4mo | $215,000 | $176 | 38 |
Match score weights: distance 35% · size 25% · config 20% · recency 20%. Top-matched comps best support the ARV.
Projected returns pro-forma
-3.0% appreciation · 3.0% rent growth · sell at horizon
- IRR
- -1.0%
- Equity multiple
- 0.96×
- Total profit
- $-1,716
- Equity at exit
- $25,273
- IRR
- 8.7%
- Equity multiple
- 1.67×
- Total profit
- $31,748
- Equity at exit
- $14,655
Cash invested: $47,460 (down + closing). Projections, not guarantees.
Landlord ↔ Tenant lean methodology
- Overall (STATE)
- 70 Landlord-Friendly
- State Delaware
- 70 Landlord-Friendly · D+7
- County
- — inherits STATE
- City
- — inherits STATE
ZIP-level market 19934
- Home prices YoY
- -25.1%
- Active inventory
- 94
- Price-to-rent
- 7.1×
Monthly cashflow live
- Estimated rent
- $1,995 medium interval (Pro) →
- Mortgage (P&I)
- −$889
- Tax est. 1.5%
- −$212 /mo · $2,542/yr
- Insurance
- −$71
- HOA
- −$1
- Vacancy / Maint / Mgmt
- −$419
- Net cashflow
- $404
Break-even live
UW: 25.0% down · 7.5% · 30yr · 1.5% tax · 5.0% vac · 8.0% maint · 8.0% mgmt
Financing live
Cash to close
- Down payment
- $42,375
- Closing costs
- $5,085
- Reserves months
- —
- Total cash needed
- —
Loan-product check · same deal, 3 products live
Conventional
25% down · 7.5% · 30yr
- Down + closing
- —
- Monthly P&I
- —
- Monthly cashflow
- —
- DSCR
- —
- Eligible?
- —
Personal DTI + credit; lowest rate.
DSCR
20% down · 8.5% · 30yr
- Down + closing
- —
- Monthly P&I
- —
- Monthly cashflow
- —
- DSCR
- —
- Eligible?
- —
No personal income docs; deal must DSCR.
Hard money
10% down · 12.0% · 12mo
- Down + closing
- —
- Monthly P&I
- —
- Monthly cashflow
- —
- DSCR
- —
- Eligible?
- —
Short-term bridge; refi at stabilization.
Rent comps 4 comps
| Address | Beds | Baths | Sqft | Rent | $/sqft | DOM | Units | Dist |
|---|---|---|---|---|---|---|---|---|
| 104 Southern Blvd Wyoming, DE | 3.0 | 1.0 | 1656 | $2,000 | $1.21 | 43d | 1 | 1.06mi |
| 121 Kennison Ln Dover, DE | 3.0 | 3.0 | 1530 | $2,200 | $1.44 | 43d | 1 | 1.12mi |
| 128 E Camden Wyoming Ave Unit A Camden, DE | 2.0 | 2.0 | 900 | $1,350 | $1.50 | 43d | 1 | 1.25mi |
| 300 East St Camden, DE | 1.0–3.0 | 1.0–2.0 | 1272 | $2,245 | $1.76 | 43d | 1 | 1.33mi |
HOA detail
- Monthly dues
- $1 · $12/yr
Listing history 16 events
-
2026-06-19days on market $169,500 Active 35 DOM
-
2026-06-18days on market $169,500 Active 34 DOM
-
2026-06-17days on market $169,500 Active 33 DOM
-
2026-06-16days on market $169,500 Active 32 DOM
-
2026-06-15days on market $169,500 Active 31 DOM
-
2026-06-14days on market $169,500 Active 29 DOM
-
2026-06-13days on market $169,500 Active 28 DOM
-
2026-06-10days on market $169,500 Active 26 DOM
-
2026-06-09days on market $169,500 Active 25 DOM
-
2026-06-08days on market $169,500 Active 24 DOM
-
2026-06-07days on market $169,500 Active 23 DOM
-
2026-06-02days on market $169,500 Active 18 DOM
-
2026-06-01days on market $169,500 Active 17 DOM
-
2026-05-31days on market $169,500 Active 16 DOM
-
2026-05-30days on market $169,500 Active 15 DOM
-
2026-05-15$169,500 Active 278-char remark
ⓘ Source: listings_history table (triggers on properties + properties_extension) + one-shot
backfill from property_details.listing_events for pre-trigger history.
Climate risk First Street
- Flood 1/10 Low FEMA zone X (unshaded) · 0% chance over 30 yrs
- Wildfire 1/10 Low
- Heat 8/10 Severe 7 d/yr ≥102°F today · 17 d/yr by 30 yrs out
- Wind 6/10 Major 77% chance of damaging wind over 30 yrs
- Air quality 2/10 Low 1 unhealthy d/yr today · 2 by 30 yrs out
Nearby sold comps map
Loading sold comps map…
Walkable amenities ~0.75 mi
Loading nearby amenities…
Taxation est. · year 1
- Rental income
- $23,942
- − Mortgage interest
- −$9,495
- − Property taxes
- −$2,542
- − Insurance
- −$848
- − Repairs & maintenance
- −$1,915
- − Management
- −$1,915
- − HOA
- −$12
- − Depreciation
- −$4,931
- Taxable income
- $2,284
- Est. tax owed @ 24.0%
- −$548
- After-tax cash flow
- $4,298/yr
For passive investors: Depreciation is non-cash, so a rental often shows a tax loss while cash-flowing — sheltering income. Rental losses are passive: they offset passive income freely, and up to $25,000/yr can offset ordinary (W-2) income if you actively participate and your MAGI is under $100k (phasing out to $0 by $150k); unused losses carry forward. On sale, claimed depreciation is recaptured at up to 25%, and gains may owe capital-gains tax (a 1031 exchange can defer both). Figures are a year-1 estimate at your 24.0% rate — not tax advice; consult a CPA.
Condition & rehab AI · 18 photos
This home is in average condition with moderate repairs and maintenance needed. The kitchen and bathrooms are in need of updates, which can significantly increase its resale value.
Repairs flagged
- Moderate kitchen cabinets — dated and in need of replacement
- Moderate bathroom fixtures — dated and in need of replacement
- Moderate kitchen countertops — dated and in need of replacement
- Moderate bathroom flooring — dated and in need of replacement
- Moderate kitchen flooring — dated and in need of replacement
Value-add opportunities
- Resale paint interior walls — fresh paint can make a significant difference in curb appeal
- Resale replace kitchen cabinets — new cabinets can improve the kitchen's functionality and aesthetics
- Resale replace bathroom fixtures — new fixtures can improve the bathroom's functionality and aesthetics
- Resale replace kitchen countertops — new countertops can improve the kitchen's functionality and aesthetics
- Resale replace bathroom flooring — new flooring can improve the bathroom's functionality and aesthetics
- Resale replace kitchen flooring — new flooring can improve the kitchen's functionality and aesthetics
Renovation cost estimate screening
| Repair item | Severity | Est. cost |
|---|---|---|
| kitchen cabinets · dated and in need of replacement | Moderate | $3,000–15,000 |
| bathroom fixtures · dated and in need of replacement | Moderate | $3,000–15,000 |
| kitchen countertops · dated and in need of replacement | Moderate | $3,000–15,000 |
| bathroom flooring · dated and in need of replacement | Moderate | $3,000–15,000 |
| kitchen flooring · dated and in need of replacement | Moderate | $3,000–15,000 |
| Total estimated repair cost · 5 items | $15,000–75,000 |
Value-add ROI direction
- Resale paint interior walls — fresh paint can make a significant difference in curb appeal ↑
- Resale replace kitchen cabinets — new cabinets can improve the kitchen's functionality and aesthetics ↑
- Resale replace bathroom fixtures — new fixtures can improve the bathroom's functionality and aesthetics ↑
- Resale replace kitchen countertops — new countertops can improve the kitchen's functionality and aesthetics ↑
- Resale replace bathroom flooring — new flooring can improve the bathroom's functionality and aesthetics ↑
- Resale replace kitchen flooring — new flooring can improve the kitchen's functionality and aesthetics ↑
ⓘ Cost ranges are severity-bucket heuristics (US national rule-of-thumb). Get contractor quotes + a written scope before underwriting a rehab budget.
Schools (NCES district)
- District
- Caesar Rodney School District
- NCES district ID
- 1000180
- Math proficiency
- 26% ▼ -21.00%
- Reading proficiency
- 49% ▼ -14.00%
- Median HH income
- $61,187
- Composite
- 33.4/100
- National rank
- #5475
- State rank
- #9 of 26 in DE
Livability — Camden
- Score
- 64/100
- State rank
- #47
- US rank
- #13717
Category grades
Schools grade is shown separately in the Schools card above.
Census & demographics
- Census place
- Camden, DE
- Population (ZIP)
- 13,579
Population outlook (Kent County) Hauer SSP2
- Today (2025)
- 194,477 people
- By 2030
- 204,351 · +5.1%
- By 2040
- 222,135 · +14.2%
- By 2050
- 236,483 · +21.6%
- By 2075
- 266,327 · +36.9%
- By 2100
- 275,335 · +41.6%
Race, ethnicity, and origin ACS 2023
- Neighborhood character
- Majority White (63%)
- Race & ethnicity
- White 63% Black 24% Two or more races 8% Hispanic / Latino 6% Asian 2%
- Hispanic origin (detail)
- Mexican 3% Puerto Rican 1%
- Common ancestry
- Romanian 3% Lithuanian 2% Slovak 2%
- Foreign-born
- 11% · Canada, Vietnam
- Languages at home
- 84% English-only · Spanish 4% German/W. Germanic 4% French/Haitian/Cajun 1%
Political lean MEDSL · Kent
- 2024 margin
- Toss-up / Even · D 50.2% · R 48.2% · Other 1.7%
- 2008→2024 swing
- -7.8pp toward R · 2008: 9.8pp · 2024: 2.0pp
- All cycles
- 2024: D+2.0 2020: D+4.1 2016: R+4.9 2012: D+4.9 2008: D+9.8
Not yet ingested
- Civics
- —
Market trends
- HPI YoY
- ▼ -62.19%
- Current HPI
- 185.0938
- Rent YoY
- —
- Metro
- —
- State GDP YoY
- —
- F500 in state
- 0
Price history
1 event — show timeline
- 2026-05-15 Listed $169,500 BRIGHT MLS
Cash-flow waterfall
monthlySold comps — $/sqft
last 12 mo · ≤1 miLoading sold comps…